



Hey,
This month, you can build a financial forecast just by describing what your business does. That’s the headline, but not the only thing.
We shipped a handful of updates to financial forecasting, plus a redesign of the entire section.
Here’s each one:
1) Forecast your financials without the complex setup
Not sure what your revenue streams should be?
Just describe what your business does and click Draft my revenue.
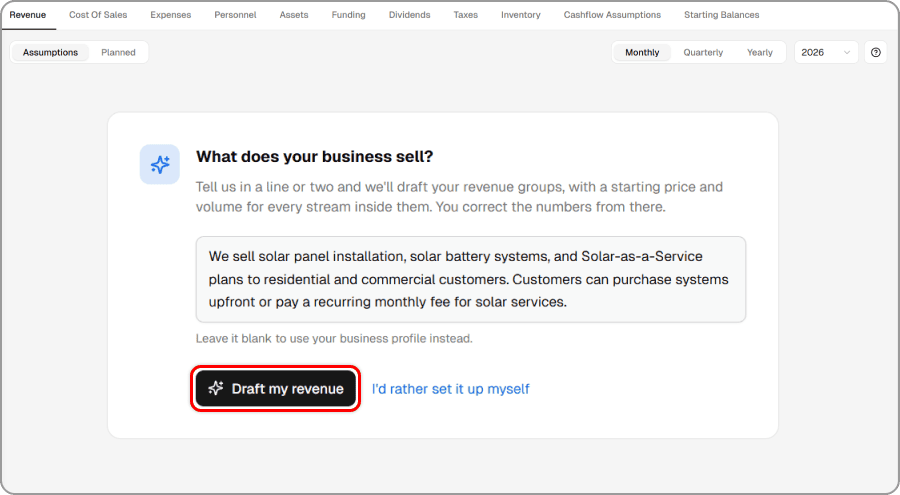
Then the AI suggests revenue streams based on your description.
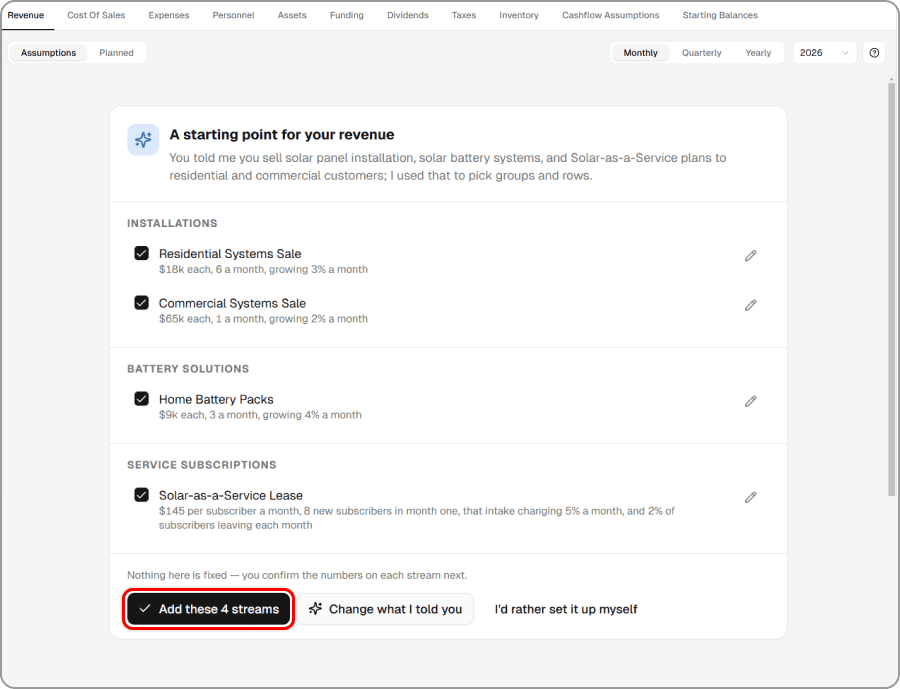
It’s a starting point, not a final answer, so customize the streams, change the numbers, or add and remove them however you like. Once it looks right, click Add these streams.
From there, the AI builds out your revenue, and you can adjust it anytime.
And this isn’t just for revenue. It works across every core forecast section: Cost of Sales, Expenses, Personnel, Assets, Funding, and Dividends.
Just like that, you forecast your financials without navigating complex workflows.
2) More control over taxes
A single tax rate doesn’t work for every business. Different products get taxed differently, and some purchases you can claim back while others you can’t. Taxes now handle all of that.
>> Create multiple sales tax rates
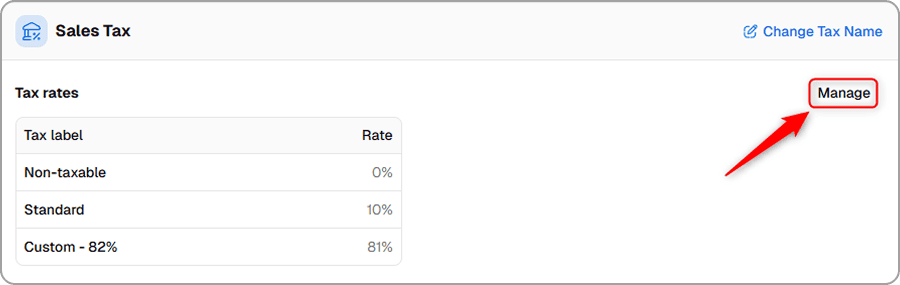
Create as many named rates as you need and assign them to individual revenue streams. We apply the right tax to each stream automatically.
>> Tax on purchases
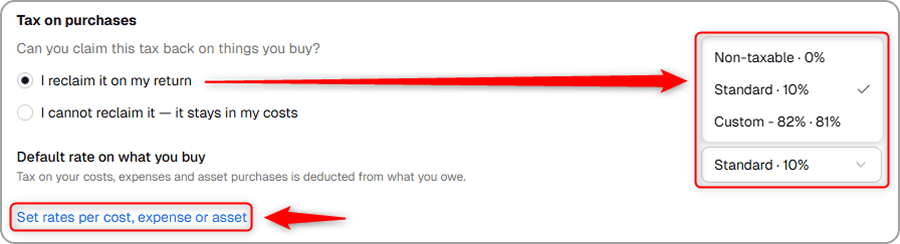
Tax applies to what you buy, not just what you sell. The new Tax on purchases section lets you set how tax on your costs, expenses, and asset purchases is treated.
Under “Can you claim this tax back on things you buy?”, pick the option that fits:
- I reclaim it on my return: for when eligible purchase tax can be deducted from what you owe
- I cannot reclaim it — it stays in my costs: for when the tax becomes part of the cost or expense
If you reclaim it, set a default rate on what you buy, and we’ll apply it to the relevant costs, expenses, and asset purchases, then deduct it from the sales tax you owe.
For different rates on specific purchases, click Set rates per cost, expense, or asset to assign them individually.
A few smaller touches came with the redesign too.
3) “Worth a look” flags things to double-check
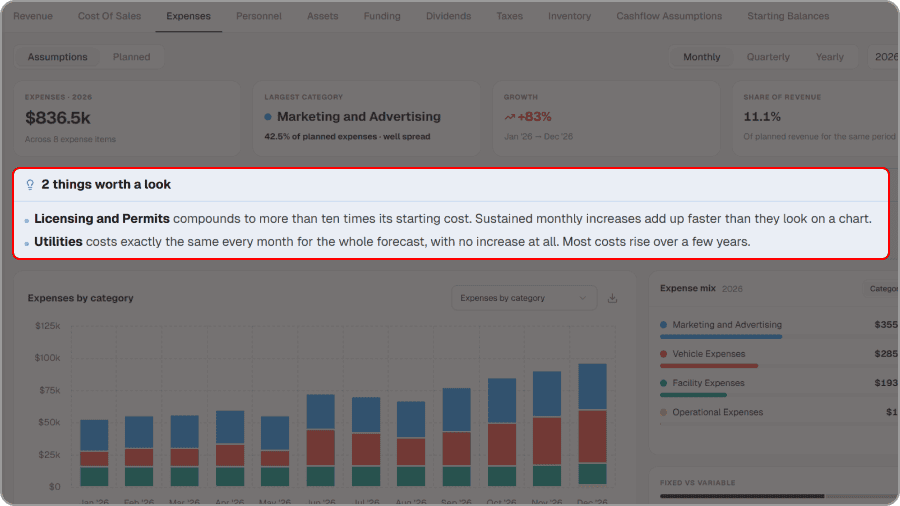
You’ll now see a “worth a look” callout inside your forecast sections. As you build, it flags things worth a second glance: a number that stays flat the whole time, or one that grows faster than it seems to.
Not errors, just a prompt to double-check.
4) Cards that show more than a number
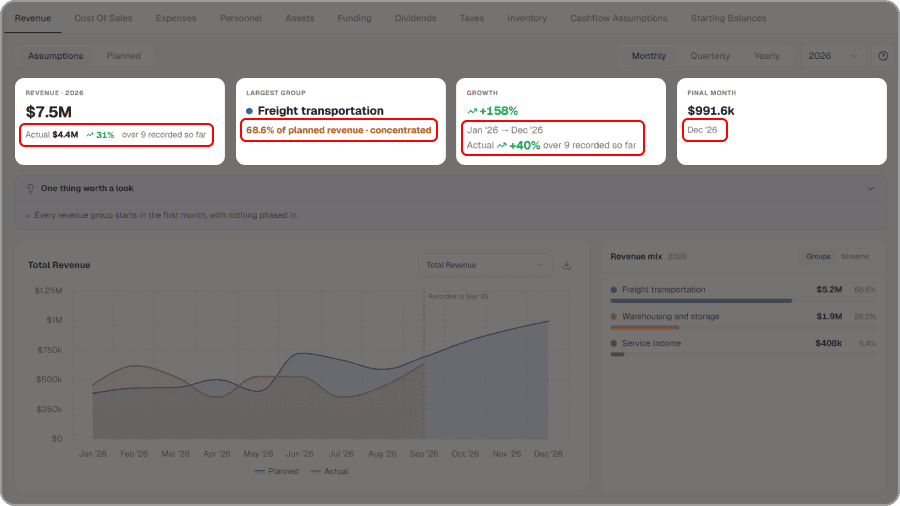
The summary cards at the top of each section used to show just a figure. Now each one adds a line of context beneath it.
A card might tell you what the total is made of, how your forecast compares to what’s actually come in, or which way things are heading. The context shows whether a number is healthy, not just what it is.
5) Actuals inside your forecast
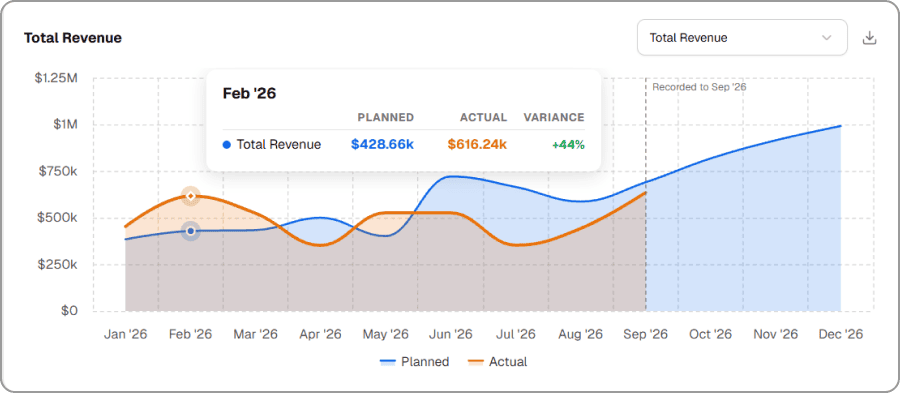
Your Actual tab has always let you compare real numbers against your plan. Now you don’t have to switch tabs to see it.
Inside the forecast section, your charts can show actual data alongside your planned data, so you can see how reality is tracking against your projections as you work.
And a fresh look across the finance section
We also redesigned the finance section, so navigating your dashboard and forecasts feels cleaner and simpler to move through.
That’s it for this month. Log in and open your forecast to try it out.
Until next time,
Happy business planning 🙂
The Upmetrics Team

Paresh Balar
Paresh Balar is the co-founder of Upmetrics, the #1 business planning software. His ultimate goal with Upmetrics is to revolutionize how entrepreneurs create, manage, and execute their business plans. He loves sharing his thoughts on business and financial planning and its challenges through his blog posts. Read more