











“Having complete control over our business plan has been instrumental in being able to raise funds from investors. Upmetrics is an invaluable product that keeps getting better.”

Jason LorjeFounder & CEO at Agmondo

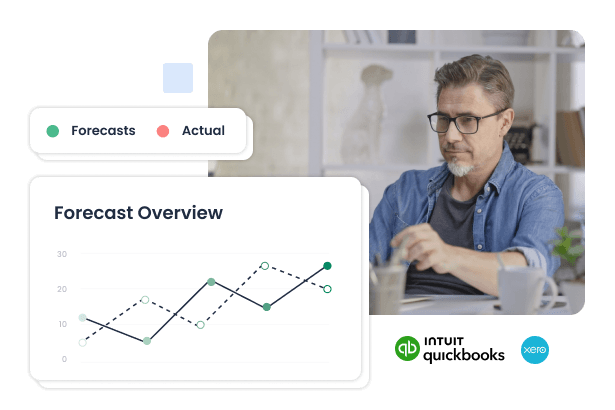
Pull your actuals from QuickBooks, Xero, or a spreadsheet. See where you are ahead, where you are slipping, and what to do next.

Trusted by founders, schools, and firms
Bring your forecast and your real numbers into the same view, so you can see how the business is actually performing every month.
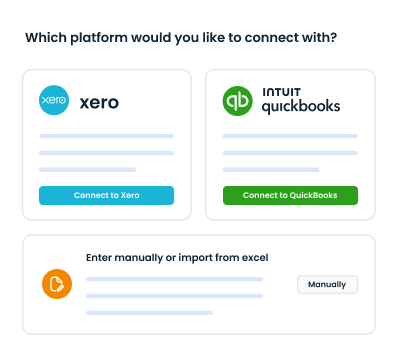
Connect your accounting software for an automatic feed, or upload a spreadsheet when that's how you work. Either way, your numbers land where they belong.
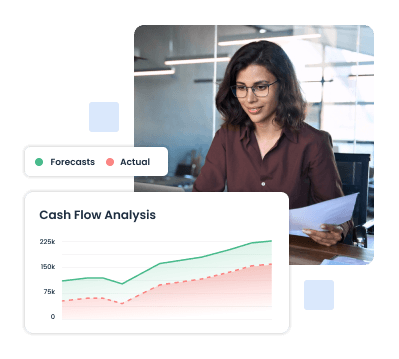
See your plan and your actual performance in one view, month by month. Red and green deltas show you where you are off track before the quarter closes.
Stop building pivot tables to answer one question. Type the question, get an answer grounded in your plan and your actuals.

Variance dashboards and monthly summaries that you can hand to your board, your bank, or your team without rebuilding them in PowerPoint.

Stop running your business on gut feel.
Securely sync your accounting data with a read-only connection, or upload an Excel or CSV file instead.
See where actuals diverge from plan, month by month, with color-coded deltas across revenue, expenses, and cash.
Use what you learn from the variance view to update your plan, so it stays useful as the business evolves.
Track whether growth is matching the projections you showed investors.
Monitor sales, expenses, and profitability against your monthly goals.
Review client performance against their financial plans without the spreadsheet back-and-forth.
Compare performance across locations against the projected targets you set.
Our users appreciate how Upmetrics streamlines their planning and enhances business operations.
“Having complete control over our business plan has been instrumental in being able to raise funds from investors. Upmetrics is an invaluable product that keeps getting better.”
“Hands down, the best business planning software I have ever used. It is extremely easy to use, intuitive, incorporates AI, guides you through it step by step, and it is extremely easy for others to collaborate.”

“I loved the financial modeling capabilities of Upmetrics as they are exceptional and easy to use. It simplifies the often complex process of creating financial projections and forecasts.”


“I had a wonderful experience. I was able to cut down the time it takes me to write a business plan because the layout was already done and the AI feature was also really helpful.”

“Love it, people are impressed! You made my dreams come true on paper fast! AI help and team response were amazing. It is awesome to use.”

“Drafting impactful and clear business plans is not easy. Navigating complex spreadsheets, creating financial projections, and generating reports take up a lot of a founder's time. Upmetrics removes all that friction.”

“Upmetrics is my assistant for business planning. Over the years I have tried a few business plan tools, but Upmetrics hands down is the best. Their AI assistant has been a great feature, and the support team is excellent.”

“The Upmetrics business plan tool stands out from the rest. Its financial forecasts are unmatched, with detailed reports on profit, loss, earnings, and breakeven points. User-friendly and adapts to any company.”

“Upmetrics streamlines business planning and pitch deck creation with sample templates. It excels at financial planning, making it effortless to integrate finance and funding details into your business plan.”

Once your actuals are flowing in, get the views you actually use to run the business.
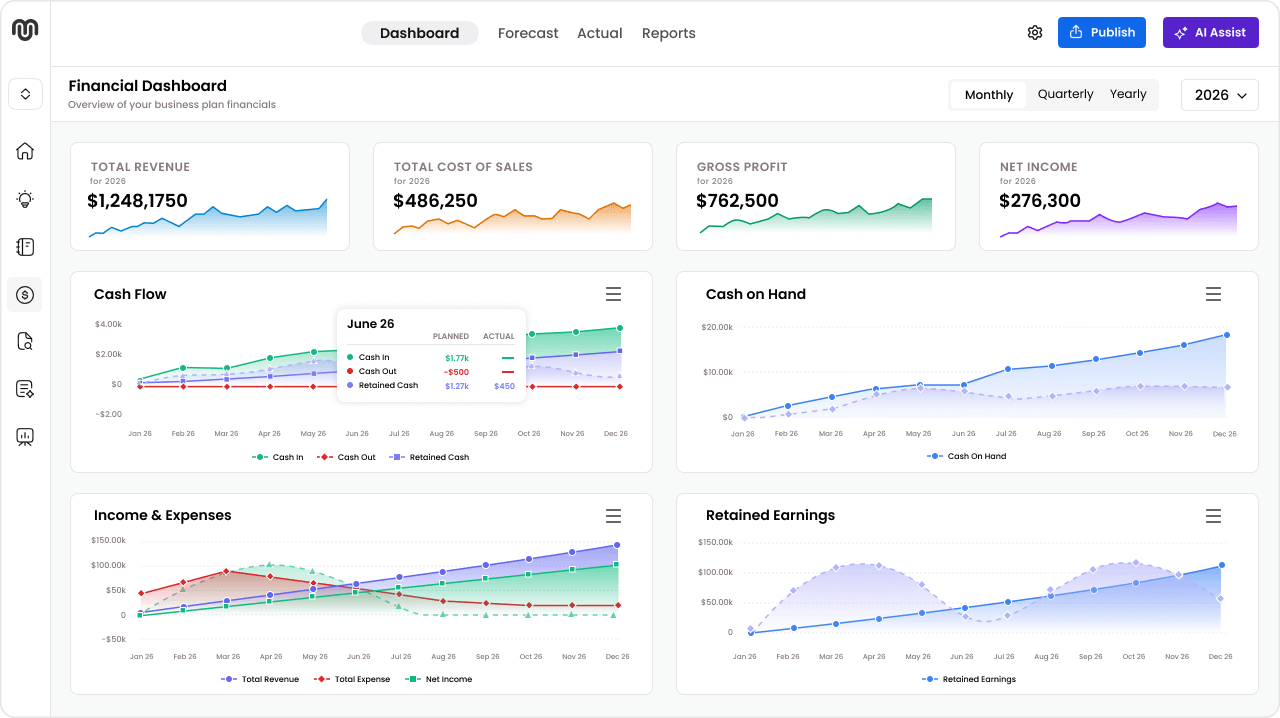
Track gaps between projected and actual performance at a glance, with color-coded deltas you can scan in seconds.
Generate updated income statements, cash flow statements, and balance sheets using your synced actuals.
Identify patterns over time and monitor business performance monthly or quarterly, so you can act before issues turn into surprises.
Skip the pivot tables. Ask the assistant a question and get an answer grounded in your plan and your actuals.
Everything you need to know about tracking your plan against real performance.
Still have questions? Contact our team
Sync your actuals and see the variance in minutes