Opening a candy store sounds fun, but getting customers to choose your shop over a grocery store isn’t easy. You need to figure out what candy people will actually buy, how much to stock for the holidays, and how to keep sales going during quieter months.
I wanted to show how these decisions work in a real business plan, so I put together this sample for Wonderjar Sweets, a fictional candy store in Brookside, Kansas City, Missouri, seeking a $125,000 SBA 7(a) loan.
The plan shows how the store expects to make 80 sales a day, manages holiday inventory, and plans its cash flow month by month.
You can use these numbers and decisions as a reference when planning your own candy store.
Executive Summary
On Friday, March 5, 2027, Wonderjar Sweets will open as a neighborhood candy store in Brookside, one of Kansas City’s oldest shopping districts. Our store is at the Halden Building, 318 W. 63rd Street, Suite 104, Kansas City, MO 64113.
We will sell candy by the pound from a 40-bin pick-and-mix wall, along with packaged and retro candy, chocolates, trending imports, and seasonal gifts.
Prices run from $1.49 for a candy stick to $75 for a large gift box. Most of our sales will come from about 80 transactions a day, at an average of $15.50 each.
Our mission is to give Brookside families a candy store where a child can fill a bag for under $10 and find something new on every visit.
Why Families Will Come
Families can buy a standard chocolate bar for less at the supermarket, and we won’t try to beat that price. Our everyday bars and bags will cost about what a convenience store charges, which helps families trust our prices.
We will earn our margin on the pick-and-mix wall, hard-to-find retro candy, imports, and gift boxes that grocery aisles don’t carry.
Our customers will be Brookside-area families, adults buying the candy they grew up with, gift buyers, and teens chasing new trends.
Candy is a steady habit for most Americans, who spent a record $55 billion on chocolate, candy, gum, and mints in 2025.
Our owner, Renee Okafor, spent nine years at a regional grocery chain. She ran its seasonal candy sets and later worked as an assistant store manager. She knows what a supermarket stocks and what it leaves out.
Opening Funds
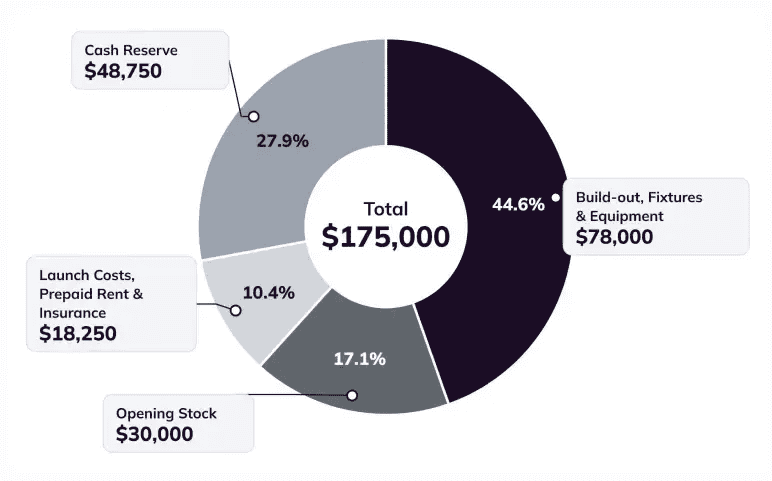
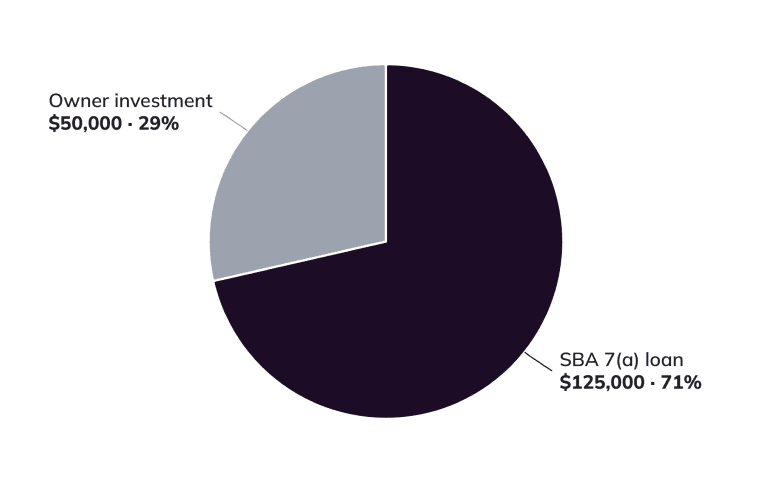
To open the store, we are asking Prairiegate Community Bank for a $125,000 SBA 7(a) loan. Renee is investing $50,000 of her savings, for $175,000 in total.
The money will pay for $78,000 of build-out, fixtures, and equipment, and $30,000 of opening stock. It also covers $18,250 of launch costs and prepaid rent and insurance, plus a $48,750 cash reserve for the quiet months between holidays.
Sales & Profit
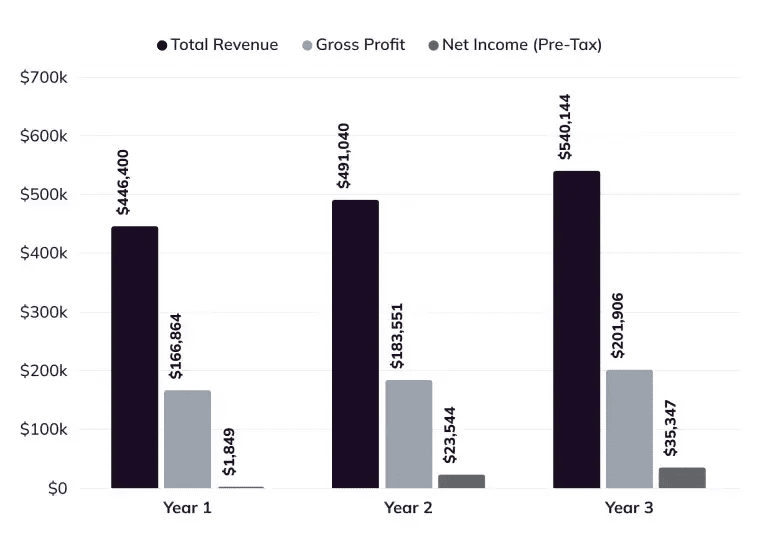
We expect sales of $446,400 in Year 1, $491,040 in Year 2, and $540,144 in Year 3. Year 1 shows a small $1,849 pre-tax profit because we pay $11,500 of one-time launch costs that year.
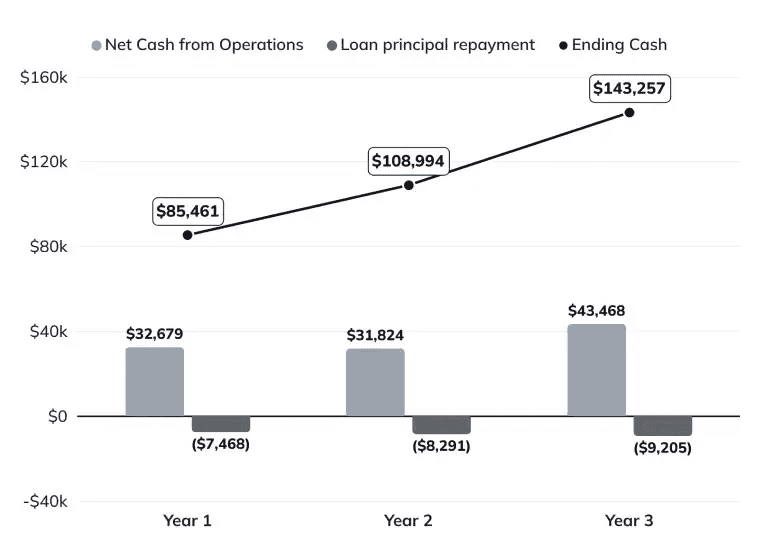
Profit then grows to $23,544 in Year 2 and $35,347 in Year 3, and we expect to end Year 3 with $143,257 in cash.

Company Overview
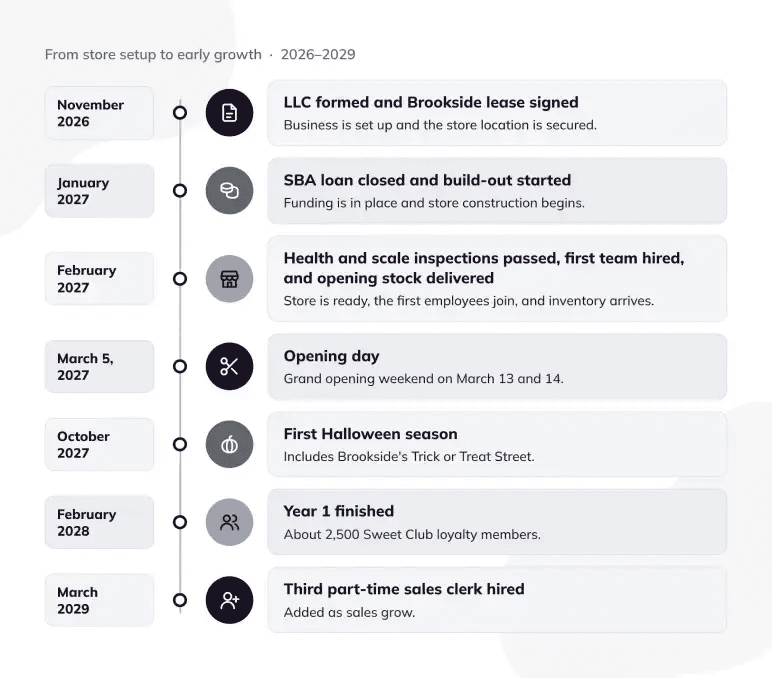
Wonderjar Sweets signed its Brookside lease in November 2026, four months before opening day. That same month, Renee Okafor registered the business as a Missouri single-member limited liability company (LLC). She owns 100% of it, works in the store full time, and will personally guarantee the SBA loan.
Wonderjar is a simple retail business. We buy finished candy from distributors and sell it in a store built for browsing. We won’t make candy, serve ice cream, or sell drinks, which keeps our equipment, permits, and staffing simple.
Vision Statement
Our vision is to become the first stop for Brookside families planning birthdays, holidays, and Saturday treats. We also want people across Kansas City to tell friends about the candy they found only at Wonderjar.
Brookside Storefront
Our 1,400-square-foot storefront sits on 63rd Street, in the middle of Brookside’s shops and restaurants. It has a wide front window, where we will put the pick-and-mix wall in full view of everyone walking past.
Families from Brookside, Waldo, and the Country Club District already come here for groceries, dinner, and errands, and several schools sit within a short drive.
We signed a 10-year lease at $27 a square foot, which includes taxes, insurance, and shared building costs. The lease also gives us a five-year renewal option. This lets us stay in the same spot for up to 15 years.
Owner Background
Renee spent nine years with a regional grocery chain in the Kansas City area. For her first five years, she was the chain’s seasonal candy lead. She planned the Halloween, holiday, Valentine’s Day, and Easter candy sets and placed the orders for each season.
She then spent four years as an assistant store manager. She scheduled about 40 employees, managed weekly orders, and reviewed the store’s shrink and margin reports every Monday. Shrink is the stock a store loses to damage, spoilage, and theft.
Over those years, customers kept asking her for candy the chain didn’t carry, such as retro bars, imported sours, and freeze-dried candy. Wonderjar Sweets is her answer to those requests.
Launch Milestones
Here are the steps from our lease signing through Year 3:
Market Analysis
Wonderjar Sweets will sell something almost every household already buys. In 2025, 99.8% of U.S. households bought confectionery, and most people ate chocolate or candy two to three times a week.
This habit helps a neighborhood store. Families who live and shop nearby can stop in often, not just before a holiday.
Brookside Shoppers
Brookside has over 90 shops, restaurants, and offices, and its first group of shops went up in 1919. The district also hosts events that bring families to the street, such as its annual Halloween celebration, Trick or Treat Street.
Our store sits in ZIP code 64113, which covers Brookside and the Country Club District. The area has 4,933 households, and their median household income is $179,964, based on 2024 Census estimates.
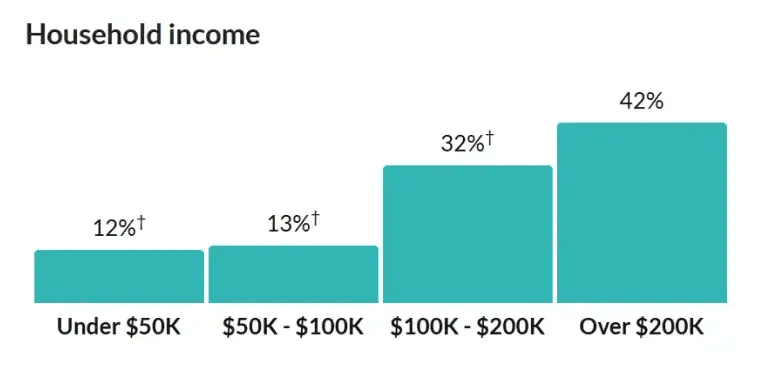
For these families, a $15.50 visit is an easy treat they can enjoy often.
Specialty candy stores are relatively uncommon in Jackson County. According to the Bureau of Labor Statistics, the county had just nine confectionery and nut retail establishments in 2025.
Wonderjar will focus on serving Brookside families with a wider candy selection, seasonal gifts, and a more personal shopping experience than grocery stores offer.
Holiday Seasons
As mentioned earlier, Americans spent $55 billion on confectionery in 2025. They should spend $62.2 billion by 2030. The four big candy seasons, Valentine’s Day, Easter, Halloween, and the winter holidays, accounted for 63% of 2025 sales. This is why we plan our buying and our cash around those four seasons.
Between them, our sales will come from families and adults who stop in for an everyday treat.
How People Buy Candy Now
Candy shoppers are changing in ways that suit a small, well-stocked store:
- Teens and young adults look for sour, spicy, and freeze-dried candy they see on social media. We will add 10 to 15 new items to a “New This Month” shelf every month.
- Adults buy retro candy for themselves, and many want the exact candy they grew up with. Our retro wall carries the candy most supermarkets dropped years ago.
- Shoppers watch prices more closely. With pick-and-mix, they can spend $3 or $30 and still leave happy.
- People give candy as gifts beyond the big holidays, for birthdays, teachers, and office events. Our gift boxes and party bags serve these buyers.
- Families start holiday shopping earlier each year. Our seasonal table goes up four to six weeks before each holiday.
Customer Groups
We will serve four groups of customers, each with its own reasons to visit:
(1) Families with children ages 5 to 14 (about 45% of transactions)
They come after school on weekdays and all day on weekends. They buy pick-and-mix cups, a chocolate bar, or a novelty item, and spend $12 to $18 a visit. Parents also order our party bags for birthdays.
(2) Adults buying retro candy (about 25%)
These customers, mostly 30 to 65, stop in during evenings and weekends, often on their way to a Brookside restaurant. They buy retro candy, licorice, taffy, and boxed chocolates, and spend $15 to $25.
(3) Gift buyers (about 15%)
They shop in the weeks before Valentine’s Day, Easter, Halloween, and the winter holidays, and before teacher-appreciation week and office events. They buy gift boxes and baskets for $25 to $75.
(4) Teens and young adults ages 13 to 24 (about 15%)
They come after school and on Friday and Saturday evenings for freeze-dried, extra-sour, and imported candy. They spend $8 to $15.
All four groups share a problem. Supermarkets carry the same few hundred items, big-box seasonal aisles empty out right before each holiday, and shipping online candy often costs more than the candy itself.
Competitive Analysis
Wonderjar will face both direct competition from specialty retailers and indirect competition from stores that sell candy alongside other products.
Direct Competitors
Sugar Tram Candy Co. is the closest match to Wonderjar’s concept. It offers a wide range of pick-and-mix, imported, and nostalgic candy, but its downtown location is less convenient for Brookside families.
Marlow & Finch Chocolates competes mainly for gift purchases. Its handmade chocolates and premium packaging appeal to special occasions, while Wonderjar plans to offer lower-priced candy gifts and everyday treats.
Indirect Competitors
Greenbriar Market, just a few blocks away, is a convenient option for standard packaged candy. Its prices and weekly promotions will be difficult to match, although its specialty selection is limited.
Big-box stores, drugstores, and gas stations also compete for everyday purchases, while online candy retailers provide greater variety at the cost of shipping and waiting.
Competitive Edge
Greenbriar Market can beat us on everyday candy prices, and Sugar Tram Candy Co. carries more products. Rather than trying to match either, we’ll focus on what Brookside families can get close to home.
Four things will help Wonderjar stand out:
- 40-bin pick-and-mix wall: Customers can create their own candy mixes instead of buying prepacked bags.
- Retro and trending candy: Familiar childhood favorites alongside new products added every month.
- Made-to-order gifts: Personalized candy boxes ready within 24 hours for birthdays, holidays, and other occasions.
- Family-friendly hours: Open until 7 PM on weeknights and 8 PM on Fridays and Saturdays, when families are more likely to be out shopping.
We know we’ll start with a few disadvantages, too. Wonderjar is a new name with no reviews, and we can’t always match supermarket prices.
To address these challenges, we’ll price our products carefully, encourage customer reviews, and use Sweet Club rewards to bring shoppers back.
Products & Pricing
Wonderjar Sweets will sell five main candy categories, with each one serving a different purpose in the store. Some products are meant to drive regular foot traffic, some carry stronger margins, and others help us capture gift and holiday sales.
Together, they support a balanced product mix built around both everyday purchases and seasonal peaks.
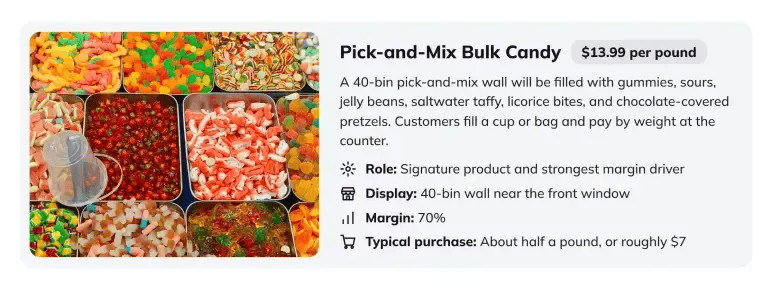
1. Pick-and-Mix Bulk Candy
The store’s main attraction and highest-margin category.
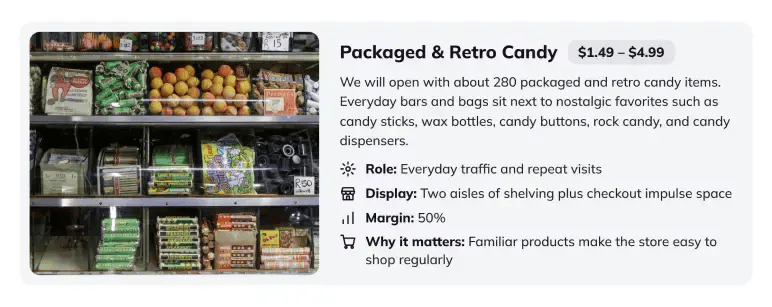
2. Packaged & Retro Candy
The everyday category that keeps families and nostalgic shoppers coming back.
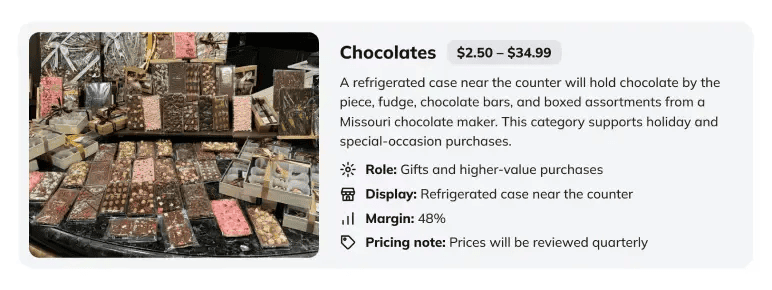
3. Chocolates
A gift-friendly category that adds a more premium side to the store.
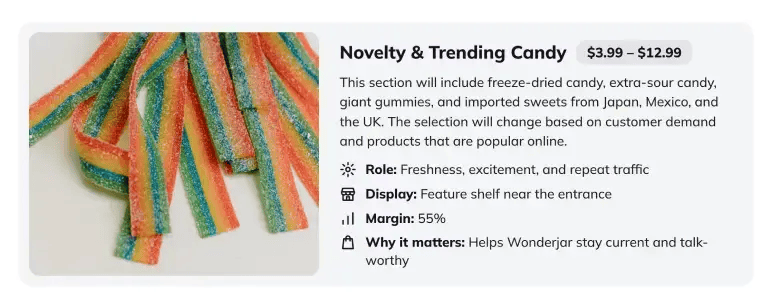
4. Novelty & Trending Candy
The category that keeps the store feeling new and gives younger shoppers a reason to come back.
5. Seasonal Gifts & Party Favors
The category is built for holidays, celebrations, and custom orders.
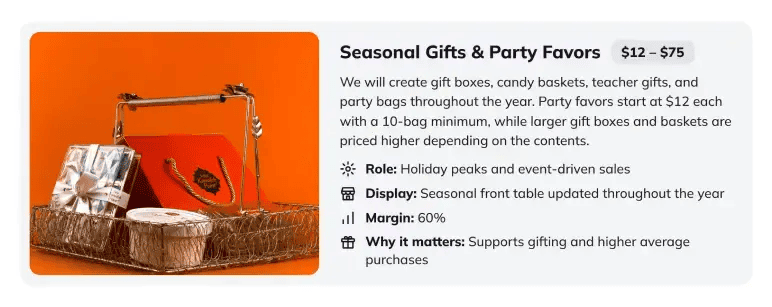
Pick-and-mix is expected to generate the largest share of sales and the highest margin. Packaged candy and chocolates will provide much of the remaining revenue, while novelty sweets and seasonal gifts will support repeat visits and holiday purchases.
The table below shows each category’s share of Year 1 sales and its cost:
| Product Category | Share of Sales | Year 1 Sales | Product Cost |
|---|---|---|---|
| Pick-and-mix candy | 34% | $151,776 | 30% |
| Packaged & retro candy | 28% | $124,992 | 50% |
| Chocolates | 18% | $80,352 | 52% |
| Novelty & trending candy | 10% | $44,640 | 45% |
| Seasonal gifts & party favors | 10% | $44,640 | 40% |
| Total | 100% | $446,400 | 42.6% |
Freight and shrinkage will add another 0.9 percentage points to product costs, bringing the projected total to about 43.5% of sales.
The store expects an average purchase of $15.50, including loyalty rewards and seasonal markdowns. We’ll also review supplier costs regularly, especially for chocolate, and adjust purchasing or prices when needed.
Buying & Inventory
At Wonderjar Sweets, buying decides much of our profit. Renee will order every week, book holiday stock weeks ahead, and keep 60 days of inventory on hand. This helps us keep the shelves full without tying up cash in candy that goes stale. We sell through and replace our full stock about six times a year.
Key Suppliers
Wonderjar will work with four main suppliers for candy, chocolates, and packaging:
(1) Lindell Sweets Distribution
This regional distributor supplies our core packaged candy and bulk cases. We order by Sunday night for delivery on Wednesday. We pay for the opening order upfront, and later orders are due 30 days after delivery.
(2) Retro Pantry Wholesale
We order retro, imported, and freeze-dried candy every two to three weeks, with minimum orders of $250 to $500.
(3) Osage Bend Chocolate Co.
This Missouri chocolate maker supplies boxed chocolates, fudge, and chocolate by the piece, with a two-week lead time and refrigerated delivery in summer.
(4) Bluestem Packaging Supply
We buy gift boxes, cellophane bags, ribbon, and party-bag supplies every quarter.
Lindell requires payment upfront for the opening order, then offers 30-day payment terms. Renee will plan purchases from other suppliers around their agreed payment schedules.
Inventory Management
Every Saturday evening, Renee will review the week’s sales and stock report from our point-of-sale system. She will send the week’s orders before the distributor’s Sunday-night deadline.
We refill bins from sealed cases, oldest stock first, and label each bin with its fill date. Before we add a new batch, we empty and clean the bin. Any packaged item that sells fewer than six units in eight weeks comes off the shelf to make room for something new.
We will book holiday stock on this schedule:
- Easter 2027: Included in our opening order, and sold from March 5 to March 28
- Halloween: Booked in July, delivered in September, and sold from late September to October 31
- Winter holidays: Booked in August, delivered in October and November, and sold through December 24
- Valentine’s Day: Booked in November, delivered in mid-January, and sold through February 14
- Easter 2028: Ordered in February 2028 for the April 16 holiday
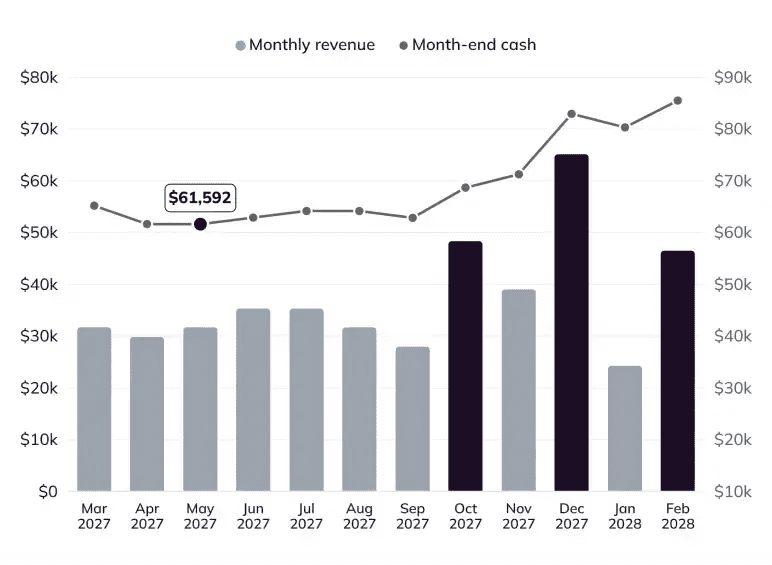
The calendar below shows our buying year from March 2027 to February 2028:
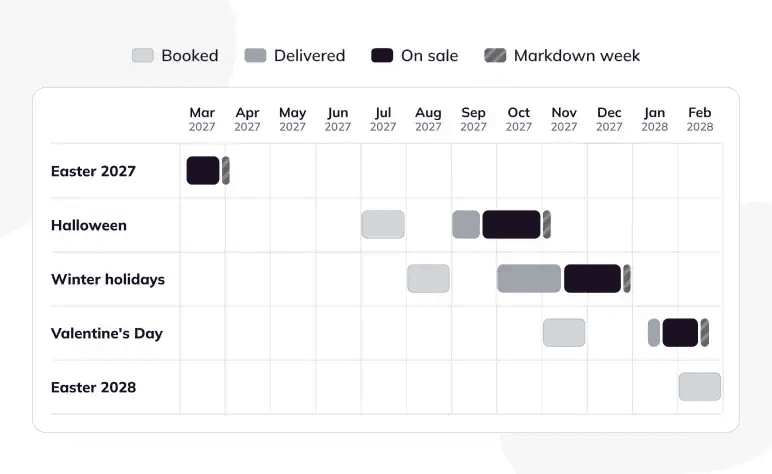
We buy each season’s stock to sell about 90% at full price. After the holiday, we mark the rest down by 50% for one week and then clear it out. Because suppliers bill us 30 days after delivery, we pay for most holiday stock during the same season it sells.
Marketing & Sales Strategy
Wonderjar Sweets will focus on local marketing, and our front window will do much of the work.
Most new customers will find us because they walked past the store. Our budget goes to schools, short videos, and a loyalty program that brings people back.
Grand Opening
We will open quietly on March 5, 2027, in time for Easter shoppers. Our grand opening weekend follows on March 13 and 14, with a $6,000 one-time budget. It covers:
- Window and street signs
- A free quarter-pound pick-and-mix cup for the first 300 kids
- Local print and social ads
- A giveaway for new Sweet Club members
Year 1 Marketing Budget
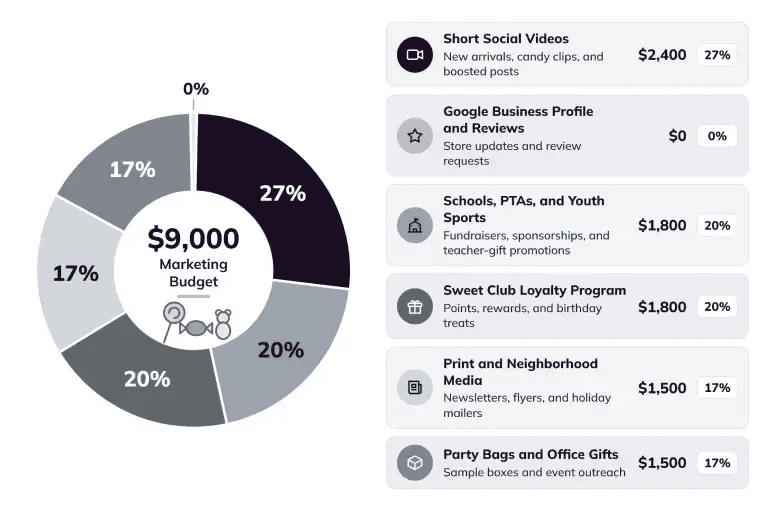
Our ongoing marketing budget is $9,000 a year, spread across six channels:
| Channel | What We Will Do | Year 1 Budget | Year 1 Target |
|---|---|---|---|
| Short social videos | Post new arrivals, bin refills, and “what $5 buys” clips, and boost the best ones | $2,400 | 3,000 local followers |
| Google Business Profile and reviews | Post photos and holiday hours, and ask for a review on every receipt | $0 | 150 reviews with a 4.7 rating or higher |
| Schools, PTAs, and youth sports | Sponsor teams, run fundraiser candy-gram orders, and share teacher-gift flyers | $1,800 | 12 school or team partners |
| Sweet Club loyalty program | Give 1 point per $1, a $5 reward at 100 points, and a free birthday treat bag | $1,800 | 2,500 members making 35% of our transactions |
| Print and neighborhood media | Run ads in neighborhood newsletters, event flyers, and holiday mailers | $1,500 | Reach local families before each holiday |
| Party bags and office gifts | Send sample boxes to offices and event planners, and party-bag flyers to parents | $1,500 | 300 party-bag orders and 60 office gift orders |
Selling in the Store
Our team will make most of our sales on the floor. Staff will:
- Greet every customer who walks in
- Offer a free taste of each new pick-and-mix flavor
- Suggest a gift box when a customer lingers at the chocolate case
- Keep small treats within reach of the register
Sweet Club members earn their reward on one visit and spend it on the next, which brings them back.
We will change the window and the seasonal table eight times a year: for Easter, spring, summer, back to school, Halloween, Thanksgiving, the winter holidays, and Valentine’s Day. Each change gets a short video and a Sweet Club email.
We will also show up at Brookside’s own events. On Trick or Treat Street, we will hand out small candy bags at our door and invite parents to join the Sweet Club.
During the Brookside Art Annual and the holiday shopping weekends, we will keep the store open late and set up a sample table on the sidewalk. These events help us meet families who don’t yet walk past our window and keep Wonderjar part of the neighborhood.
Not sure how to turn your marketing ideas into a clear plan? Upmetrics’ AI business plan generator can help you draft each section of your own plan step by step.
Operations Plan
Wonderjar Sweets will run on a simple weekly routine built around when families are free: after school, in the evening, and on weekends. Renee will run the store day to day, with a small team.
Hours & Weekly Routine
Our store will be open these hours:
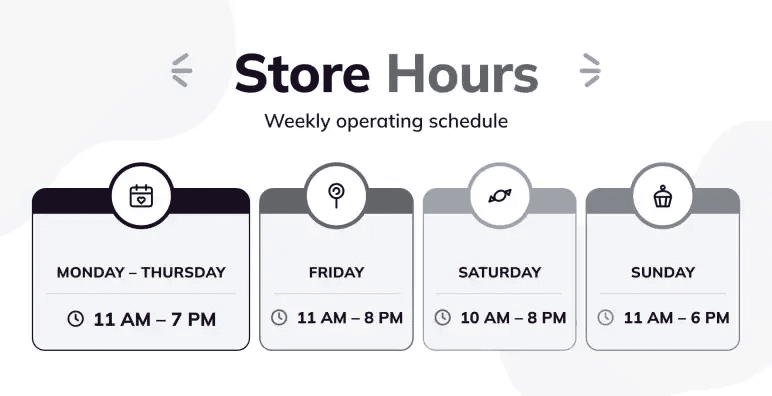
This adds up to 58 hours a week, for 360 days a year. We will close on Easter Sunday, July 4, Thanksgiving, Christmas Day, and New Year’s Day. From December 1 to 23, we will open at 10 AM and close at 8 PM every day.
The shift lead counts stock on Monday mornings, and Renee places orders on Saturday evenings. Deliveries arrive on Wednesday, and we shelve them before 3 PM.
Our busiest hours are 3 to 6 PM on school days and all of Saturday. We will keep two people on the floor from 3 PM on weekdays, and three on Saturdays from noon to 6 PM.
Store Layout
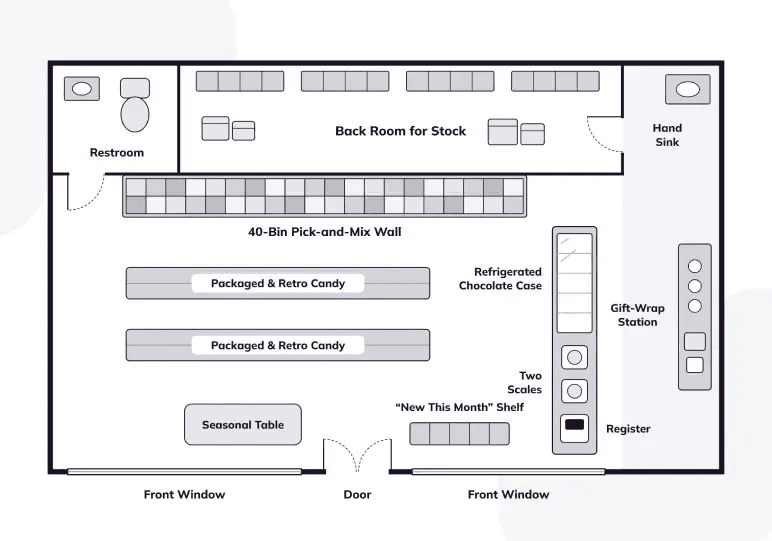
The pick-and-mix wall faces the window, and it’s the first thing people see.
Packaged and retro candy runs down two aisles, and the seasonal table sits near the door. The chocolate case, scales, and register share one counter. This lets staff weigh cups and keep an eye on the bins from one spot.
The floor plan below shows our 1,400-square-foot layout:
Party Bags & Gift Orders
Customers can order party bags and gift boxes in the store, by phone, or through a simple form on our website, and they pay when they order.
Party bags need five days’ notice, and gift boxes need 24 hours, or seven days for 10 or more. Staff will pack orders on weekday mornings, before the after-school rush. In the two weeks before each holiday, we will limit gift-box orders to 40 a day so walk-in customers don’t wait.
Bulk Bins & Food Safety
Selling unwrapped candy means we follow strict rules at the bins:
- We make sure every bin has a lid or a gravity dispenser and a scoop tied to the bin, and customers never reach in by hand.
- Bin labels list ingredients and allergens.
- Staff wash their hands at a separate sink and wear gloves when refilling bins.
- We keep the chocolate case at a set temperature and check it every morning.
To keep things simple at the inspection, we will review our bin setup with the Kansas City Health Department before the pre-opening inspection.
Store Team
Renee will run buying, scheduling, the books, and the sales floor, working about 45 hours a week from Tuesday to Saturday. Her team will include:
Shift lead (full time, hired in February 2027)
Works about 36 hours a week, covering Sunday, Monday, and three afternoon-to-close shifts. The shift lead opens and closes the store, trains clerks, and handles deliveries, for $17.50 an hour.
Two part-time sales clerks
Each works about 21 hours a week on weekday afternoons and weekends, running the register, refilling bins, and packing gifts, for $15.00 an hour. We will add a third clerk in March 2029.
Two or three seasonal clerks
They help from October to December, from late January through Valentine’s Day, and before Easter, for $15.00 an hour. Many will be local college students.
Missouri’s minimum wage rose to $15.00 an hour in 2026, with no increase scheduled after that. Retail businesses with less than $500,000 in yearly sales don’t have to pay the state rate, but we will pay $15.00 from opening day anyway. We expect to pass $500,000 in sales in Year 3, and we want to keep the people we train.
An outside bookkeeper and CPA will handle our monthly books and sales tax filings. A commercial insurance agent and a counselor from a local small business development center will also advise Renee.
Licenses & Inspections
We will hold these licenses and approvals before opening day:
| License or Approval | Issued By | Timing |
|---|---|---|
| Articles of organization (LLC) | Missouri Secretary of State | Filed in November 2026 |
| Employer Identification Number | Internal Revenue Service | Before our first payroll |
| Retail sales tax license | Missouri Department of Revenue | Before our first sale |
| City business license | City of Kansas City Revenue Division | Before opening, then renewed by March 1 each year, with the fee based on the prior year’s sales |
| Food establishment permit | Kansas City Health Department | Issued after the pre-opening inspection in February 2027, then renewed every year |
| Certificate of occupancy and sign permit | City Planning & Development Department | Before opening day |
| Scale certification | Missouri Department of Agriculture, Weights, Measures and Consumer Protection Division | Both scales tested and sealed before we sell by weight, then inspected every year |
We will also carry general liability, product liability, and property insurance, paid once a year.
Risk Analysis
Running a candy store comes with a few clear risks, and we have planned for each one:
- A slower first year
If we make 15% fewer sales than planned in Year 1, about 68 a day, we would show a pre-tax loss of about $21,400. We would still cover our everyday operating costs at that level. We would cut seasonal hours first, and our $48,750 cash reserve would cover the shortfall.
- Leftover holiday stock
We will track how much of each holiday’s stock sells at full price and use those numbers to set next year’s orders.
- Rising chocolate costs
If cocoa prices jump between our quarterly price reviews, we will reprice chocolate right away instead of waiting for the next review.
- Supermarket and big-box price cuts
Most of our sales come from pick-and-mix, retro, imported, and gift items these stores don’t carry. A price war on standard bars would touch only a small part of our shelves.
- Summer heat
From May to September, chocolate stays in the refrigerated case and out of the front window, and our chocolate deliveries arrive refrigerated.
- Shrink and snacking at the bins
Staff can see the bins from the counter, cameras cover the floor, and every scoop is tied to its bin.
Financial Plan
Wonderjar Sweets needs $175,000 to open, funded by a $125,000 SBA 7(a) loan and $50,000 from Renee. We expect a small profit in Year 1 and a $35,347 pre-tax profit by Year 3.
Startup Costs
| Category | Amount |
|---|---|
| Leasehold improvements | $36,000 |
| Store fixtures and bulk bins | $24,000 |
| Chocolate case and backroom cooler | $8,500 |
| Registers, scales, and computer | $4,500 |
| Exterior sign and window graphics | $5,000 |
| Opening inventory | $30,000 |
| Prepaid rent and insurance | $6,750 |
| Grand opening marketing | $6,000 |
| Licenses and permits | $1,500 |
| Legal and loan setup | $2,500 |
| Software setup, photography, and website | $1,500 |
| Working capital reserve | $48,750 |
| Total Startup Costs | $175,000 |
Funding Sources
| Category | Amount |
|---|---|
| SBA 7(a) loan (Prairiegate Community Bank) | $125,000 |
| Owner investment (Renee Okafor) | $50,000 |
| Total Funding | $175,000 |
Financial Assumptions
| Assumption | Year 1 | Year 2 | Year 3 |
|---|---|---|---|
| Days open | 360 | 360 | 360 |
| Customer transactions | 28,800 | 31,680 | 34,848 |
| Average transactions per open day | 80 | 88 | 97 |
| Average purchase | $15.50 | $15.50 | $15.50 |
| Product cost, freight, and shrink (share of sales) | 43% | 43% | 43% |
| Store staff pay (share of sales) | 18% | 18% | 18% |
| Payroll tax rate | 9% | 9% | 9% |
| Owner salary | $42,000 | $45,000 | $48,000 |
| Card processing fees (share of sales) | 2.6% | 2.6% | 2.6% |
| Inventory on hand (days of product cost) | 60 | 60 | 60 |
| Supplier payment terms (days) | 30 | 30 | 30 |
| Loan interest rate (10-year term) | 10.5% | 10.5% | 10.5% |
| Loan payments per year | $20,240 | $20,240 | $20,240 |
| Depreciation | $9,857 | $9,857 | $9,857 |
Struggling to build the numbers for your candy store plan? Upmetrics’ financial forecasting tool helps you turn daily sales and seasonal swings into clear monthly projections.
Projected Profit & Loss
| Category | Year 1 | Year 2 | Year 3 |
|---|---|---|---|
| Revenue | |||
| Total Revenue | $446,400 | $491,040 | $540,144 |
| Cost of Goods Sold | |||
| Product cost, freight, and shrink | $191,952 | $211,147 | $232,262 |
| Store staff pay | $80,352 | $88,387 | $97,226 |
| Payroll tax on store staff | $7,232 | $7,955 | $8,750 |
| Total Cost of Goods Sold | $279,536 | $307,489 | $338,238 |
| Gross Profit | $166,864 | $183,551 | $201,906 |
| Gross Margin | 37.4% | 37.4% | 37.4% |
| Operating Expenses | |||
| Owner salary | $42,000 | $45,000 | $48,000 |
| Payroll tax on owner salary | $3,780 | $4,050 | $4,320 |
| Rent | $37,800 | $38,934 | $40,102 |
| Insurance | $3,600 | $3,750 | $3,900 |
| Accounting, legal, and license renewals | $3,600 | $3,700 | $3,800 |
| Utilities, phone, and internet | $7,200 | $7,400 | $7,600 |
| Marketing | $9,000 | $9,500 | $10,000 |
| Store supplies | $5,400 | $5,800 | $6,200 |
| Repairs and maintenance | $1,800 | $2,000 | $2,200 |
| Software and website | $3,600 | $3,700 | $3,800 |
| Delivery and vehicle | $1,500 | $1,600 | $1,700 |
| Card processing fees | $11,606 | $12,767 | $14,044 |
| Launch costs (one-time) | $11,500 | $0 | $0 |
| Total Operating Expenses | $142,386 | $138,201 | $145,666 |
| EBITDA | $24,478 | $45,350 | $56,240 |
| Depreciation | $9,857 | $9,857 | $9,857 |
| EBIT | $14,621 | $35,493 | $46,383 |
| Interest Expense | $12,772 | $11,949 | $11,036 |
| Net Income (Pre-Tax) | $1,849 | $23,544 | $35,347 |
Projected Balance Sheet
| Category | At Launch | Year 1 | Year 2 | Year 3 |
|---|---|---|---|---|
| Assets | ||||
| Cash | $60,250 | $85,461 | $108,994 | $143,257 |
| Inventory | $30,000 | $31,554 | $34,709 | $38,180 |
| Prepaid rent and insurance | $6,750 | $0 | $0 | $0 |
| Fixtures, equipment, and build-out (net) | $78,000 | $68,143 | $58,286 | $48,429 |
| Total Assets | $175,000 | $185,158 | $201,989 | $229,866 |
| Liabilities | ||||
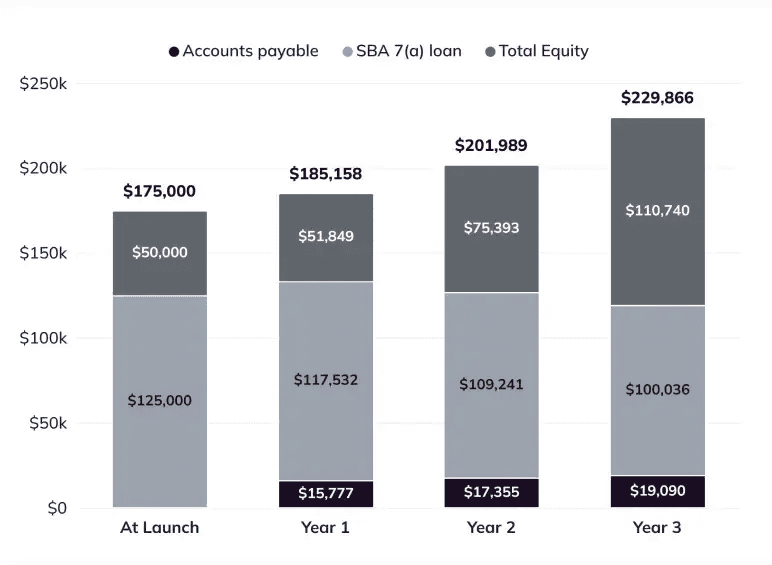
| Accounts payable | $0 | $15,777 | $17,355 | $19,090 |
| SBA 7(a) loan | $125,000 | $117,532 | $109,241 | $100,036 |
| Total Liabilities | $125,000 | $133,309 | $126,596 | $119,126 |
| Equity | ||||
| Owner investment | $50,000 | $50,000 | $50,000 | $50,000 |
| Retained earnings | $0 | $1,849 | $25,393 | $60,740 |
| Total Equity | $50,000 | $51,849 | $75,393 | $110,740 |
| Total Liabilities & Equity | $175,000 | $185,158 | $201,989 | $229,866 |
Projected Cash Flow
| Category | Year 1 | Year 2 | Year 3 |
|---|---|---|---|
| Beginning Cash | $60,250 | $85,461 | $108,994 |
| Operating Activities | |||
| Net income (pre-tax) | $1,849 | $23,544 | $35,347 |
| Depreciation | $9,857 | $9,857 | $9,857 |
| Change in inventory | ($1,554) | ($3,155) | ($3,471) |
| Change in accounts payable | $15,777 | $1,578 | $1,735 |
| Change in prepaid rent and insurance | $6,750 | $0 | $0 |
| Net Cash from Operations | $32,679 | $31,824 | $43,468 |
| Financing Activities | |||
| Loan principal repayment | ($7,468) | ($8,291) | ($9,205) |
| Net Cash from Financing | ($7,468) | ($8,291) | ($9,205) |
| Net Change in Cash | $25,211 | $23,533 | $34,263 |
| Ending Cash | $85,461 | $108,994 | $143,257 |
Year 1 Monthly Sales & Cash
| Category | Revenue | Month-End Cash |
|---|---|---|
| March 2027 | $31,620 | $65,155 |
| April 2027 | $29,760 | $61,611 |
| May 2027 | $31,620 | $61,592 |
| June 2027 | $35,340 | $62,873 |
| July 2027 | $35,340 | $64,153 |
| August 2027 | $31,620 | $64,134 |
| September 2027 | $27,900 | $62,816 |
| October 2027 | $48,360 | $68,644 |
| November 2027 | $39,060 | $71,224 |
| December 2027 | $65,100 | $82,900 |
| January 2028 | $24,180 | $80,282 |
| February 2028 | $46,500 | $85,461 |
| Total Revenue | $446,400 |
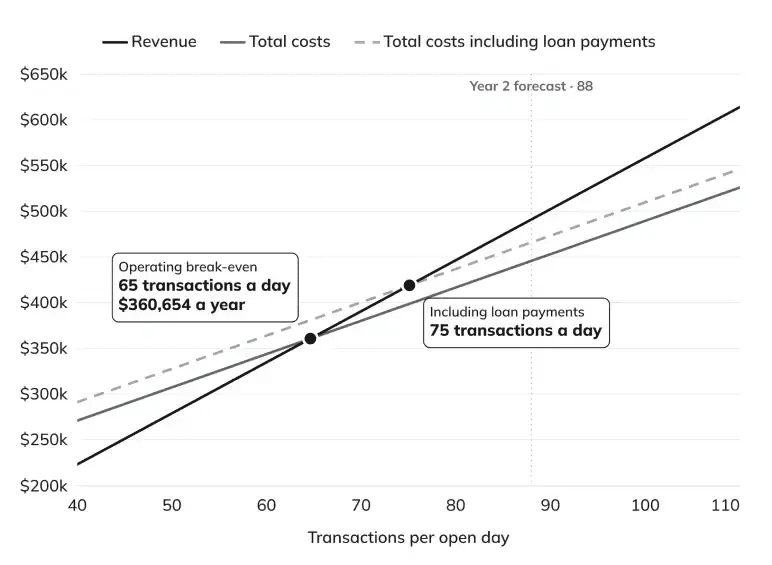
Break-Even Analysis
| Metric | Value |
|---|---|
| Average purchase | $15.50 |
| Variable cost per transaction | $10.11 |
| Contribution per transaction | $5.39 |
| Contribution margin | 34.8% |
| Fixed operating costs (Year 2, before depreciation and interest) | $125,434 |
| Break-even transactions per year (Year 2) | 23,268 |
| Break-even revenue (Year 2) | $360,654 |
| Break-even transactions per open day (Year 2) | 65 |
| Break-even transactions per open day, including loan payments (Year 2) | 75 |
| Forecast transactions per open day (Year 2) | 88 |
| Debt service coverage (Year 1) | 1.21x |
| Debt service coverage (Year 1, before one-time launch costs) | 1.78x |
| Debt service coverage (Year 2) | 2.24x |
| Debt service coverage (Year 3) | 2.78x |
The Quickest Way to turn a Business Idea into a Business Plan
Fill-in-the-blanks and automatic financials make it easy.


Upmetrics
Upmetrics is the #1 business planning software that helps entrepreneurs and business owners create investment-ready business plans using AI. We regularly share business planning insights on our blog. Check out the Upmetrics blog for such interesting reads. Read more