Opening a pet store takes more than finding a good location and stocking popular products. You need to know which products make money, how much inventory to buy, and how to keep customers coming back when they can easily shop online.
A good business plan should help you figure this out.
To show you how, we’ve created a sample plan for Bark & Burrow Pet Supply, a fictional neighborhood pet store in Harrow Park, Ohio.
The store is seeking a $240,000 SBA loan, with $80,000 set aside for opening inventory. This sample covers its product selection, pricing, customer retention, staffing, and three-year financial projections.
Use it as a reference for writing your own pet store business plan.
Executive Summary
Bark & Burrow Pet Supply will open on March 1, 2027, at Foxhill Commons, 2215 Harrow Pike, Suite 9, Harrow Park, OH 45245. This 3,000-square-foot neighborhood pet supply store sits in a grocery-anchored shopping center in western Clermont County, about 20 minutes east of downtown Cincinnati.
We will carry about 2,800 products, mostly for dogs and cats, plus a smaller range for fish, birds, and small animals. We won’t sell live animals. Instead, two local rescues will hold a monthly adoption event in the store. Customers also get free nutrition advice, same-day local delivery, and Repeat Delivery, and we’ll be open 74 hours a week, including evenings and Sundays.
Renee Castillo, a pet store manager with 12 years in pet specialty retail, will run Bark & Burrow full time. Darnell Hayes brings 15 years of grocery purchasing experience, and he will handle purchasing and the monthly numbers part time, without a salary.
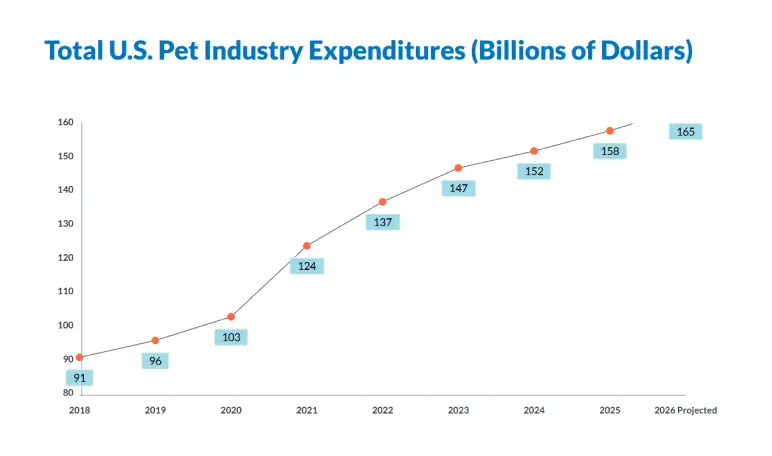
Food is a steady, repeat purchase, and U.S. pet owners spent $158 billion on their pets in 2025. And it’s projected to reach around $165 billion.
Our customers will be dog food regulars, cat households, new pet owners, small-pet and fish keepers, and delivery customers.
Our sales come from two kinds of products:
- Food and litter (56% of sales): Slim margins, but they bring about 1,400 regular customers back every four weeks or so.
- Treats, toys, supplements, and small-animal supplies (44% of sales): Margins of 50% to 60%, added to the same basket.
Together, they give us a blended product margin of 44%. No nearby store or online seller offers trained nutrition advice together with free same-day local delivery, and this is the gap Bark & Burrow will fill.
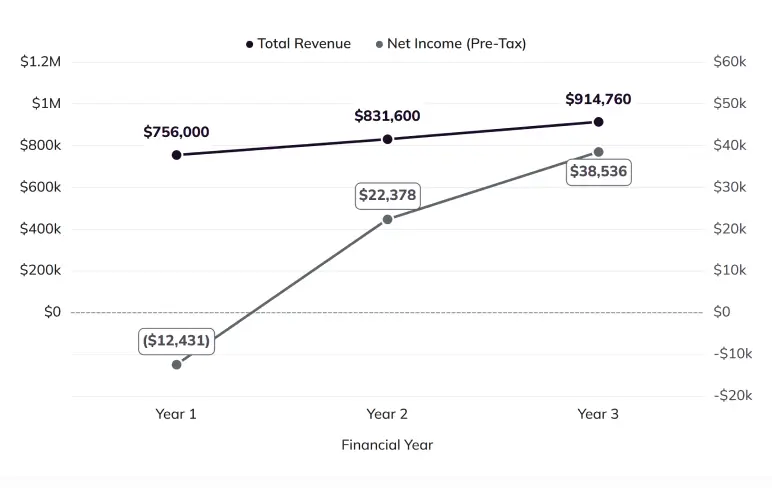
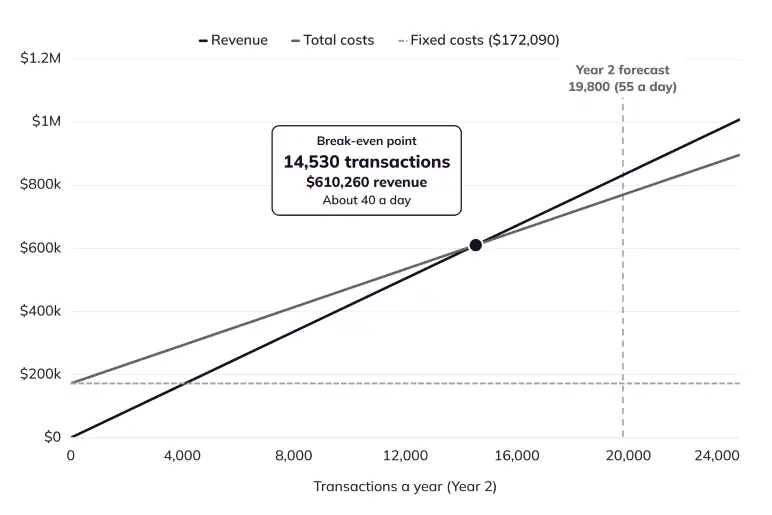
Year 1 runs from March 2027 to February 2028. We expect a small loss in Year 1 because it includes $16,000 of one-time opening costs. At our Year 2 costs, we need about 40 transactions a day to cover operating costs, and about 50 a day to cover depreciation and loan interest too. We expect 50 a day in Year 1 and 55 in Year 2.
Financial Summary
| Category | Year 1 | Year 2 | Year 3 |
| Annual transactions | 18,000 | 19,800 | 21,780 |
| Total Revenue | $756,000 | $831,600 | $914,760 |
| Gross Profit | $232,848 | $256,133 | $281,746 |
| Net Income (Pre-Tax) | ($12,431) | $22,378 | $38,536 |
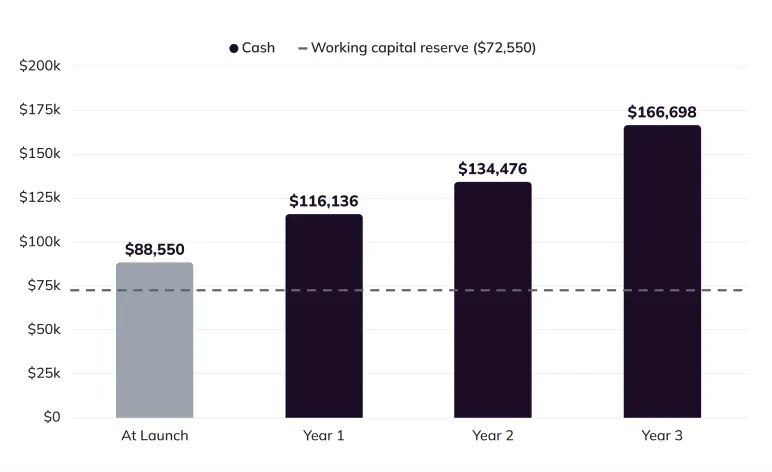
| Ending Cash | $116,136 | $134,476 | $166,698 |
Loan Request
We are requesting a $240,000 SBA 7(a) loan from Harrow Park Community Bank, and the owners will invest $60,000. Our cash at each year-end stays above $116,000, and the $300,000 will cover:
- The build-out, fixtures, freezers, displays, and a delivery van
- $80,000 of opening inventory
- Prepaid rent, prepaid insurance, and one-time opening costs
- A $72,550 cash reserve

Business Overview
Renee Castillo and Darnell Hayes formed Bark & Burrow Pet Supply as an Ohio multi-member limited liability company (LLC) in September 2026. The LLC keeps their personal assets separate from the store’s debts. Both owners will sign personal guarantees on the SBA loan.
Location & Store Layout
Foxhill Commons sits at Harrow Pike and Linden Road. We signed a 10-year lease in November 2026 at $21 per square foot, which includes taxes and the center’s shared upkeep. This comes to $5,250 a month, with two 5-year renewal options.
The site suits a store that sells heavy bags:
- The grocery store next door brings our customers past us every week
- About 650 parking spaces and curbside loading make a 30-pound bag easy to carry out
- Five veterinary clinics and two groomers are within 4 miles
- The nearest pet superstore is 6 miles away
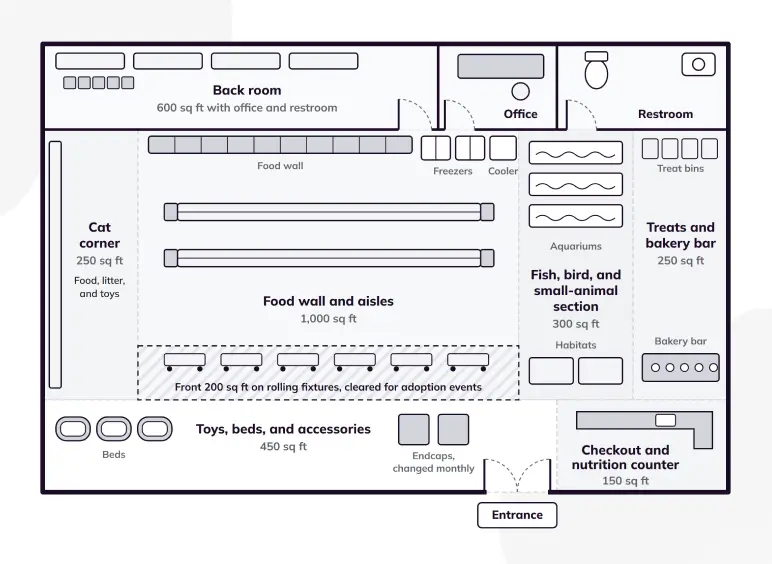
The store is split into seven zones:
- Food wall and aisles (1,000 sq ft), with two glass-door freezers and a cooler
- Treats and bakery bar (250 sq ft) beside the checkout
- Toys, beds, and accessories (450 sq ft), with two endcaps that change monthly
- Cat corner (250 sq ft) for food, litter, and toys
- Fish, bird, and small-animal section (300 sq ft) with demo aquariums and habitats
- Checkout and nutrition counter (150 sq ft)
- Back room, office, and restroom (600 sq ft)
We placed the food wall at the back on purpose. On the way to the bag they came for, customers walk past treats and toys. The front 200 square feet of the food aisles sit on rolling fixtures, which we move aside once a month for adoption events.
Owners & Roles
Renee owns 70% of the business and is investing $42,000. Her last role was managing a pet specialty store with $2.4 million in yearly sales, where she also trained staff on nutrition. She will make the decisions about the sales floor, staff, and products.
Darnell owns 30% and is investing $18,000. He will keep his full-time grocery purchasing job and help us with distributor terms, buying systems, and bank reports.
Linden Street Accounting will keep our books and file sales tax each month. Moreland & Pike, a local law firm, reviewed our lease and set up the LLC, and a volunteer SCORE mentor meets with both owners monthly.
Mission
Our mission is to help Harrow Park pet owners feed and care for their pets well, with honest advice, fair prices, and a store that’s easy to reach.
Vision
We want to be the store local families trust for every bag of pet food, from a new puppy’s first meal to the senior formula years later.
Three-Year Goals
Over our first three years, we plan to:
- Open with a fully hired and trained team on March 1, 2027
- Build a base of about 1,400 regular customers in Year 1 and 1,694 by Year 3
- Sign up 250 Repeat Delivery households by February 2028
- Keep lost and damaged stock under 1% of sales
- Earn a Google rating of at least 4.7 stars by the end of Year 1
Market Analysis
Most of our sales will come from households within a 10-minute drive of Foxhill Commons. In western Clermont County, many of these are homeowners with yards, dogs, and a weekly grocery trip that already brings them past our door.
Clermont County Households
Census data for 2024 shows 214,123 people living in Clermont County, in 86,366 households. The median household income is $87,952.
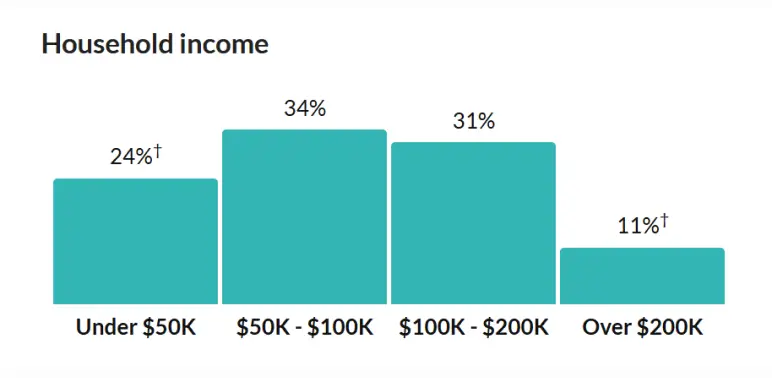
About 75% of homes are owned by the people living in them, and 75% are single-unit houses. This matters to us because homeowners with yards are more likely to keep large dogs, and large dogs need a big bag of food every month.
Nationally, 53% of households owned a dog in 2025, and 39% owned a cat. If Clermont County matches these rates, about 45,800 of its households have a dog and about 33,700 have a cat.
Our Year 1 goal of 1,400 regular customers is about 3% of the county’s dog-owning households alone.
Pet Spending
As mentioned earlier, U.S. pet owners spent $158 billion on their pets in 2025. Of that, $68.3 billion went to food and treats, and $34.4 billion went to supplies, live animals, and over-the-counter medicine.
Spread across 95 million pet-owning households, the $102.7 billion in these two groups works out to about $1,081 per household each year. We expect our regular customers to spend about $540 a year with us, which is about half of that amount.
Market Trends
How pet owners buy food and supplies is changing in ways that suit a small, well-stocked store:
- More owners are moving to premium, fresh, freeze-dried, and raw food, which needs freezer space and good advice.
- Treats and supplements for joints, skin, and teeth are growing as pets live longer.
- Home delivery and repeat orders are now normal for pet food.
- More cities and states limit puppy and kitten sales in stores, and adoption has become the usual way to get a pet.
- Sales peak in spring, with new pets and flea season, and again in December for gifts.
We will plan our freezer space, wellness shelf, delivery service, and seasonal endcaps around these changes.
Target Customers
We will serve five groups of customers, each with its own buying pattern:
(1) Dog food regulars
Owners aged 30 to 60 with one or two dogs, often in houses with yards and with household incomes of $75,000 or more. They buy a 24- to 30-pound bag of food plus treats every 4–5 weeks and spend $65–$90 a visit.
(2) Cat households
Cat owners of all ages, many in apartments and townhomes. They buy food and litter every 2–3 weeks, spend $30–$45, and often want carry-out help.
(3) New pet owners
Families with a new puppy, kitten, or rescue dog, often met at our adoption events. They need a bed, crate, bowls, collar, toys, and food all at once.
(4) Small-pet and fish keepers
Families with children and hobbyists who buy food, bedding, hay, and water care every 2–4 weeks for $20–$35.
(5) Delivery customers
Seniors, busy families, and owners of large dogs who want the same food on a set schedule, every 2 to 8 weeks.
Among them, dog food regulars will be our largest group, and small-pet and fish keepers will be our most loyal, since few stores nearby serve them well.
Competitive Analysis
Harrow Park pet owners can already buy food in five places, and each one has real strengths:
| Competitor | Distance | Strengths | Weaknesses |
| Pet superstore (national chain) | 6 miles | More than 10,000 products Grooming and a vet clinic Frequent sales on mass-market brands Delivery through apps |
High staff turnover limits advice App delivery comes with fees |
| Chewy and Amazon | Online | Autoship discounts One- to two-day shipping A huge range |
No advice A small raw and frozen range Returning an opened bag is a hassle |
| Farm-and-ranch store (national chain) | 5 miles | Low prices on value food, litter, and bird seed | Few premium, raw, or small-animal products |
| Hollow Creek Pet Pantry | 9 miles | A knowledgeable owner A good premium food selection in about 1,800 square feet |
Closes at 6 PM Closed on Sundays No delivery |
| Grocery stores and mass merchants | Next door and nearby | Grocery-brand food and litter on the weekly shopping trip | No premium brands No one to ask for advice |
Online sellers are the competitor we watch most closely, because autoship quietly takes food customers away from local stores.
Competitive Advantage
We will compete for the pet owner who wants advice, a store close to home, and easy delivery. Four things set Bark & Burrow apart:
- Trained nutrition advice at the counter, backed by a food-switch guarantee
- Local delivery the same day, plus scheduled Repeat Delivery
- Premium food brands at the same shelf price customers see online
- 74 open hours a week, including evenings and Sundays
The superstore will always carry more products, and the farm store will stay cheaper on value food and litter. We will keep up by offering special orders on the next distributor truck, usually in 2 to 4 days.
Brand-funded frequent-buyer rewards also help, and we will focus on premium food, where the price is the same everywhere.
Products & Pricing
Bark & Burrow will carry about 2,800 products in six categories. Food and litter bring customers back, and the treats, toys, and supplies they add to the same basket earn most of our margin.
Product Mix
Here’s what our pet store carries:
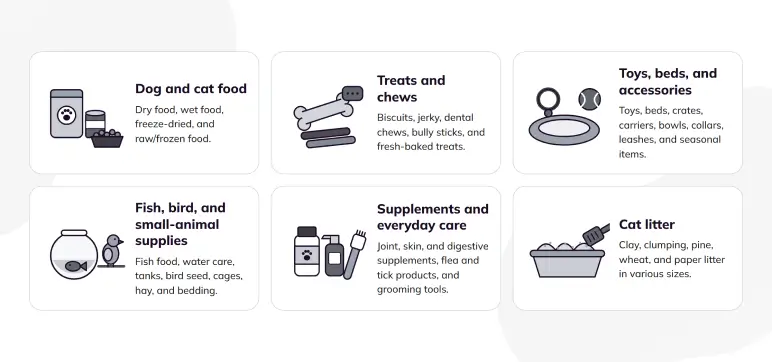
Each category plays a different part in our sales and margin:
| Category (about 2,800 products) | Share of Sales | Product Margin |
| Dog and cat food | 50% | 36% |
| Treats and chews | 14% | 55% |
| Toys, beds, and accessories | 12% | 60% |
| Fish, bird, and small-animal supplies | 10% | 53% |
| Supplements and everyday care | 8% | 50% |
| Cat litter | 6% | 30% |
Larger habitats come by special order, and we test aquarium water for free.
Pricing Strategy
Most premium food brands set a minimum advertised price. This means the same bag costs about the same at our store, the superstore, and online. We will match that price on every premium food, which helps keep food customers from leaving over a few dollars.
Treats, toys, accessories, and supplements are priced near double their cost, and this is where our margin comes from. One extra $8 treat on half of our food visits adds more profit than a 2% price increase on food.
Free Services
None of these services has a fee, and each one helps us win the next food sale:
- Nutrition advice at the counter any time, or a booked 20-minute consult with Renee
- Provide a food-switch guarantee. If a pet won’t eat a new food, the customer brings the bag back for a different one
- Free same-day delivery on orders of $49 or more within 7 miles
- Repeat Delivery, where customers pick a schedule from every 2 to 8 weeks and save 5% on each delivered order
- Special orders for anything our distributors carry, on the next truck
- Brand-funded frequent-buyer programs, such as “buy 12 bags, get 1 free,” tracked at the register
Inventory & Suppliers
Bark & Burrow opens with $80,000 of inventory on its shelves, about 27% of our startup budget. For a store like ours, managing stock well is how we keep cash in the bank. We will buy carefully, reorder often, and clear slow sellers quickly.
Our Suppliers
We will work with a small group of suppliers and partners:
- Kestrel Pet Distribution supplies most of our dog and cat food, treats, litter, and supplies, with deliveries on Tuesday and Friday mornings on Net 30 terms.
- Bluegill Aquatic Supply delivers fish, bird, and small-animal products every week, also on Net 30.
- Biscuit Row Bakery, a Harrow Park bakery, drops off fresh-baked dog treats each week.
- Premium food brands fund our frequent-buyer rewards, provide sample bags for new pet owners, and train our staff.
- Lightspeed Retail runs our register, inventory tracking, customer records, and online ordering, as part of our $500 monthly software budget.
Net 30 terms mean we pay distributors 30 days after each delivery. By the end of Year 1, $34,797 of the stock on our shelves won’t be paid for yet. This is the main reason our cash grows in Year 1 even with a small loss.
Ordering & Stock Control
Every product has a minimum and maximum stock level in our register system.
Darnell reviews the reorder report and approves each order before the distributor’s cutoff, twice a week. We aim to keep about 75 days of stock on hand, or $86,992 by the end of Year 1. At that level, our inventory turns over about 4.9 times a year.
A few simple rules keep our stock fresh and our records accurate:
- Food is shelved by best-by date, oldest first
- Anything within 60 days of its date moves to a markdown shelf
- A product with no sale in 90 days is marked down and not reordered
- One category is counted every week, and the whole store every quarter
Every Monday, we check the FDA’s pet food recall list and our distributors’ alerts. Recalled products come off the shelf the same day. Our register keeps customer records, which lets us call or text every customer who bought an affected bag.
Rescue Partners & Adoption Events
Bark & Burrow will never sell a puppy, but we plan to help about 90 pets a year find homes. Our adoption events bring new pet owners into the store on the day they need everything.
We will work with two local nonprofits:
- Rivermill Dog Rescue
- Whisker Haven Cat Rescue
The rescues screen adopters, handle the paperwork, and keep all adoption fees. Because we sell no live animals, the state’s licenses for selling dogs don’t apply to us.
Events run on the second Saturday of every month from 11 AM to 3 PM, starting with our grand opening on March 13, 2027. We clear the front of the food aisles for up to six dogs in pens and the cat rescue’s own condos. A board by the entrance shows adoptable pets all month.
We provide the space and promote each event through social media and email. Every adopting family also receives a New Family Kit with:
- A free sample bag of food
- A new-pet checklist
- 15% off one purchase within 30 days
We expect 6 to 10 adoptions at each event, and about 60% of those families to become regular customers. Their first basket of $120 to $200 is usually our largest single sale.
Customers can also round up their total at the register, and we send the proceeds to both rescues every quarter.
Marketing & Sales Plan
Bark & Burrow’s marketing is judged on one thing: how many households buy their pet’s food from us every month. Our budget is $10,000 for the launch and $1,200 a month for the rest of Year 1.
Grand Opening
Our launch runs from January to March 2027:
- Our Google Business Profile goes live 60 days before we open
- An opening-offer mailer reaches about 10,000 nearby households
- Social ads target pet owners within a 10-minute drive
- Referral cards go to the five nearby vet clinics and two groomers
- The grand opening and first adoption event take place on March 13
The $10,000 launch budget covers mailers ($4,500), photography and the website ($2,000), social ads ($2,000), and the event and giveaways ($1,500).
Marketing Channels
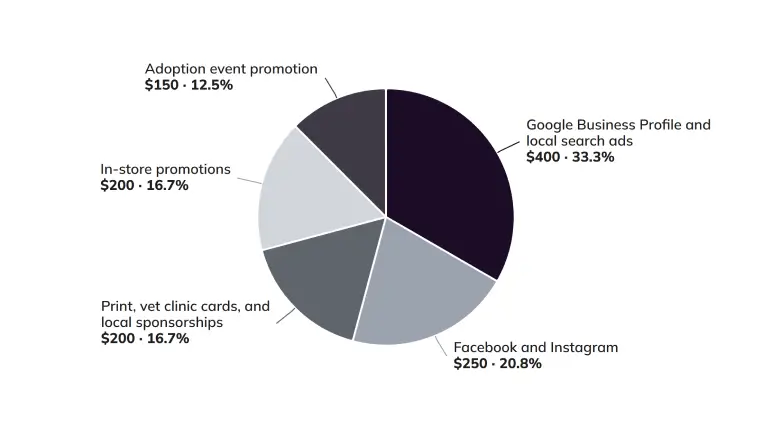
After the launch, we will spend $1,200 a month in Year 1 on these channels:
| Channel | Who It Reaches | Monthly Budget |
| Google Business Profile and local search ads | Owners searching for pet food or a pet store nearby | $400 |
| Facebook and Instagram | Pet owners within a 10-minute drive, and adoption event followers | $250 |
| Adoption event promotion | New and future pet owners | $150 |
| Print, vet clinic cards, and local sponsorships | Clinic and groomer clients, school and youth sports families | $200 |
| In-store promotions | Current customers, through endcaps and monthly deals | $200 |
| Total | $1,200 |
Email and text messages go out through our register system at no extra cost.
In-Store Selling
Every customer gets a greeting and a question about their pet. When someone buys food, our staff suggests one add-on that fits the pet, such as a dental chew or a joint supplement.
We also offer Repeat Delivery to anyone buying a bag over 25 pounds, since this is the moment they’re most likely to say yes.
Customer Retention
We will keep customers coming back with:
- Frequent-buyer cards funded by the food brands
- Repeat Delivery discounts
- Birthday treats for every registered pet
- A monthly email with new products and the next adoption event
Operations Plan
Bark & Burrow’s hours and staff schedule follow when pet owners shop: after work and on Saturdays. Our truck days, when stock has to be put away, shape the rest of the week.
Hours & Delivery Runs
The store is open 74 hours a week and 360 days a year. We close on New Year’s Day, Easter, July 4, Thanksgiving, and Christmas.
| Day | Store Hours | Delivery Run |
| Monday | 9:00 AM – 8:00 PM | None |
| Tuesday – Friday | 9:00 AM – 8:00 PM | 4:00 PM – 7:00 PM |
| Saturday | 9:00 AM – 8:00 PM | 2:00 PM – 5:00 PM |
| Sunday | 10:00 AM – 6:00 PM | None |
On delivery days, orders placed in the store, by phone, or online by 2 PM go out the same day. Sunday and Monday orders go out on Tuesday.
Our register builds each Repeat Delivery order two days before its date, and special orders are held for seven days after they arrive.
Each run can take up to 12 stops, which gives us 60 stops a week. If our 250 Repeat Delivery households average a four-week schedule, they alone will need about 62 stops a week by early 2028. This is why we will add a Monday run when we hire a fourth part-time associate in Year 2.
Truck Day Routine
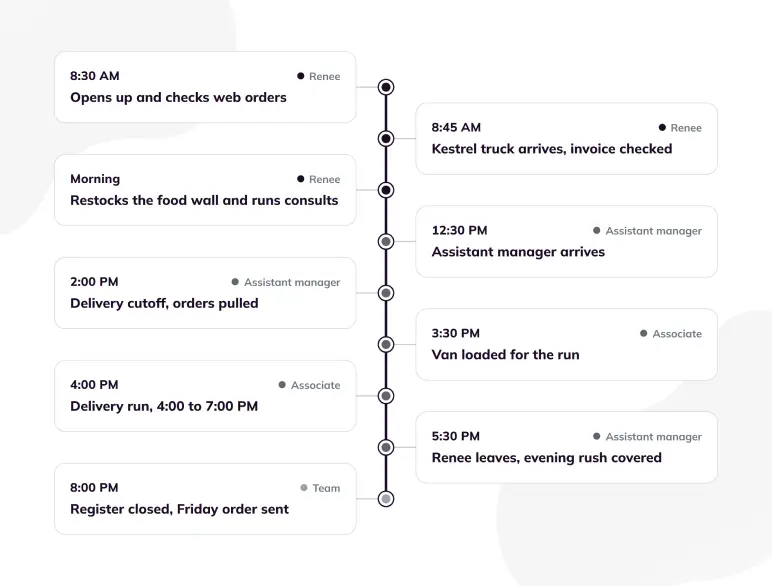
Tuesday is a typical truck day. Renee opens at 8:30 AM and checks the web orders and the Repeat Delivery list. The Kestrel truck arrives at 8:45, and she checks the invoice before the food is shelved by best-by date.
The rest of the morning goes to restocking the food wall and up to four booked nutrition consults.
The assistant manager arrives at 12:30 PM and pulls delivery orders after the 2 PM cutoff. At 3:30, the associate loads the van for the 4:00 run.
Renee leaves at 5:30, and the assistant manager covers the evening rush until the associate is back from deliveries. At 8:00, we close the register and send the Friday order.
Licenses & Insurance
Before we open, we will have these licenses and registrations in place:
- Articles of Organization from the Ohio Secretary of State, filed in September 2026
- An Employer Identification Number from the IRS
- A vendor’s license for sales tax from the Clermont County Auditor, through the Ohio Business Gateway ($25, with no yearly renewal)
- An employer withholding account with the Ohio Department of Taxation
- An unemployment insurance account with the Ohio Department of Job and Family Services
- Workers’ compensation coverage from the Ohio Bureau of Workers’ Compensation, since Ohio employers buy it from the state, not from private insurers
- A certificate of occupancy and sign permit from the City of Harrow Park, issued after the build-out inspection
We will carry $1 million per claim and $2 million in total of general liability coverage, including product liability.
Our property policy covers fixtures and inventory, and it includes spoilage coverage for the raw and frozen food in our freezers. The delivery van has its own commercial auto policy.
Staffing Plan
We will open with two owners, a full-time assistant manager, and three part-time sales associates:
| Role | Hours a Week | Pay | Main Duties |
| Renee Castillo, owner | About 45, plus adoption Saturdays | $48,000 a year in Years 1 and 2, $52,000 in Year 3 | Sales floor, staff, product selection, nutrition consults, and rescue partners |
| Darnell Hayes, owner | About 8, off the floor | No salary | Distributor orders and terms, purchasing reports, and monthly reports to the bank |
| Assistant manager (starts January 2027) | 40 | $19.50 an hour | Evening floor lead, key holder, receiving, and staff schedules |
| Sales associates (3, part-time, start February 2027) | About 21 each | $15.25 an hour | Checkout, restocking, carry-out help, and delivery runs |
Each weekday, one associate works the afternoon and evening: 1:30 to 8:30 PM on Monday, and 3:30 to 8:30 PM from Tuesday to Friday, including the delivery run.
The assistant manager works 12:30 to 8:30 PM from Tuesday to Friday and 8:30 AM to 4:30 PM on Saturday. Three associates share Saturday, and two work from 9:30 AM to 6:30 PM on Sunday.
Not counting the owners, this adds up to 103 staff hours a week: 26 on Saturday, 18 on Sunday, 13 on each day from Tuesday to Friday, and 7 on Monday.
Two of our associates will be key holders, which lets them close on Mondays and Saturdays and run the store on Sundays.
Business Risks
These are the main risks we plan for:
1) Slower sales in Year 1
If transactions come in 15% below our target, our cash would still end Year 1 above $75,000. The reserve keeps the loan current while we push Repeat Delivery sign-ups.
2) Online autoship
We match premium food prices, offer discounted Repeat Delivery, and back every food with our switch guarantee.
3) A pet food recall
Our Monday recall checks and register records let us pull products and reach buyers within a day.
4) A freezer failure or power outage
Each freezer has a temperature alarm, and our property policy covers spoiled food.
5) Renee unable to work
The assistant manager runs the floor as key holder, and Darnell covers purchasing and the bank reports.
Financial Plan
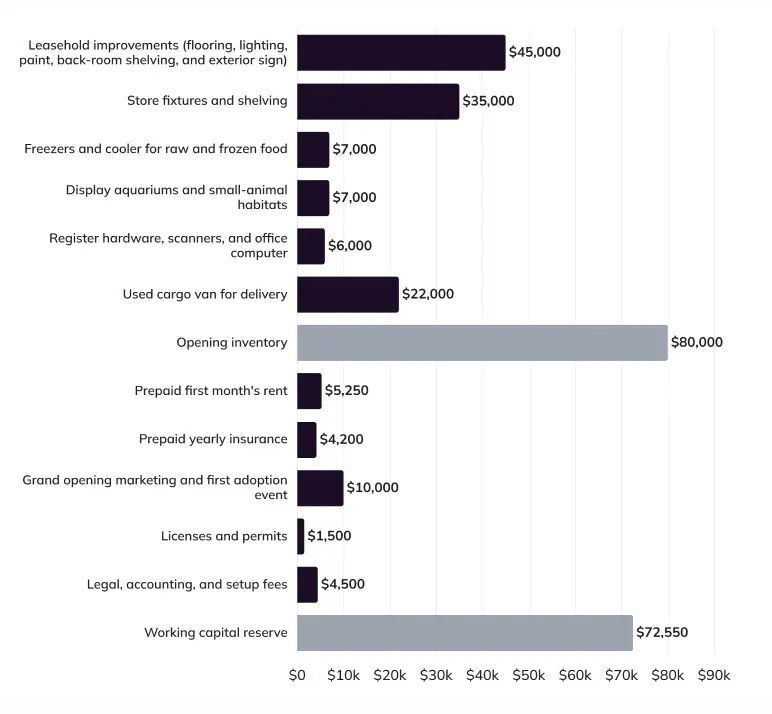
Bark & Burrow needs $300,000 to open, funded by a $240,000 SBA 7(a) loan from Harrow Park Community Bank and $60,000 from the owners. Sales grow from $756,000 in Year 1 to $914,760 in Year 3, and the store earns its first full-year profit in Year 2.
Startup Costs
| Category | Amount |
| Leasehold improvements (flooring, lighting, paint, back-room shelving, and exterior sign) | $45,000 |
| Store fixtures and shelving | $35,000 |
| Freezers and cooler for raw and frozen food | $7,000 |
| Display aquariums and small-animal habitats | $7,000 |
| Register hardware, scanners, and office computer | $6,000 |
| Used cargo van for delivery | $22,000 |
| Opening inventory | $80,000 |
| Prepaid first month’s rent | $5,250 |
| Prepaid yearly insurance | $4,200 |
| Grand opening marketing and first adoption event | $10,000 |
| Licenses and permits | $1,500 |
| Legal, accounting, and setup fees | $4,500 |
| Working capital reserve | $72,550 |
| Total Startup Costs | $300,000 |
Source of Funds
| Source | Share (%) | Amount |
| SBA 7(a) loan (Harrow Park Community Bank) | 80% | $240,000 |
| Owner equity (Castillo $42,000 + Hayes $18,000) | 20% | $60,000 |
| Total Startup Capital | 100% | $300,000 |
Financial Assumptions
| Assumption | Year 1 | Year 2 | Year 3 |
| Transactions per year | 18,000 | 19,800 | 21,780 |
| Transactions per day (360 open days) | 50.0 | 55.0 | 60.5 |
| Average ticket | $42.00 | $42.00 | $42.00 |
| Active customers | 1,400 | 1,540 | 1,694 |
| Merchandise cost (% of revenue) | 56% | 56% | 56% |
| Floor staff wages (% of revenue) | 12% | 12% | 12% |
| Payroll taxes and workers’ comp (% of pay) | 10% | 10% | 10% |
| Card processing fees (% of revenue) | 2.6% | 2.6% | 2.6% |
| Inventory on hand (days of merchandise cost) | 75 | 75 | 75 |
| Supplier payment terms (days) | 30 | 30 | 30 |
| Loan interest rate (fixed, 10-year term) | 10.5% | 10.5% | 10.5% |
| Yearly loan payments | $38,861 | $38,861 | $38,861 |
| Depreciation | $17,100 | $17,100 | $17,100 |
Spreadsheets are exhausting & time-consuming
Build accurate financial projections w/ AI-assisted features
Projected Income Statement
| Category | Year 1 | Year 2 | Year 3 |
| Revenue | |||
| Total Revenue | $756,000 | $831,600 | $914,760 |
| Cost of Goods Sold | |||
| Merchandise | $423,360 | $465,696 | $512,266 |
| Floor staff wages | $90,720 | $99,792 | $109,771 |
| Payroll taxes on floor staff | $9,072 | $9,979 | $10,977 |
| Total Cost of Goods Sold | $523,152 | $575,467 | $633,014 |
| Gross Profit | $232,848 | $256,133 | $281,746 |
| Gross Margin | 30.8% | 30.8% | 30.8% |
| Operating Expenses | |||
| Owner salary | $48,000 | $48,000 | $52,000 |
| Payroll taxes on owner salary | $4,800 | $4,800 | $5,200 |
| Rent, including taxes and shared upkeep | $63,000 | $64,890 | $66,837 |
| Insurance | $4,200 | $4,400 | $4,600 |
| Accounting and legal | $4,800 | $4,800 | $5,000 |
| Utilities, phone, and internet | $9,600 | $9,900 | $10,200 |
| Marketing | $14,400 | $15,000 | $15,600 |
| Delivery van fuel, insurance, and upkeep | $4,800 | $5,000 | $5,200 |
| Store supplies | $6,000 | $6,300 | $6,600 |
| Repairs and maintenance | $2,400 | $3,000 | $3,600 |
| Software | $6,000 | $6,000 | $6,300 |
| Card processing fees | $19,656 | $21,622 | $23,784 |
| Grand opening marketing (one-time) | $10,000 | $0 | $0 |
| Licenses and permits (one-time) | $1,500 | $0 | $0 |
| Legal, accounting, and setup fees (one-time) | $4,500 | $0 | $0 |
| Total Operating Expenses | $203,656 | $193,712 | $204,921 |
| EBITDA | $29,192 | $62,421 | $76,825 |
| Depreciation | $17,100 | $17,100 | $17,100 |
| EBIT | $12,092 | $45,321 | $59,725 |
| Interest expense | $24,523 | $22,943 | $21,189 |
| Net Income (Pre-Tax) | ($12,431) | $22,378 | $38,536 |
Projected Balance Sheet
| Category | At Launch | Year 1 | Year 2 | Year 3 |
| Assets | ||||
| Cash | $88,550 | $116,136 | $134,476 | $166,698 |
| Inventory | $80,000 | $86,992 | $95,691 | $105,260 |
| Prepaid rent and insurance | $9,450 | $0 | $0 | $0 |
| Equipment, fixtures, and van (net) | $122,000 | $104,900 | $87,800 | $70,700 |
| Total Assets | $300,000 | $308,028 | $317,967 | $342,658 |
| Liabilities | ||||
| Accounts payable | $0 | $34,797 | $38,276 | $42,104 |
| SBA 7(a) loan | $240,000 | $225,662 | $209,744 | $192,071 |
| Total Liabilities | $240,000 | $260,459 | $248,020 | $234,175 |
| Equity | ||||
| Owner capital | $60,000 | $60,000 | $60,000 | $60,000 |
| Retained earnings | $0 | ($12,431) | $9,947 | $48,483 |
| Total Equity | $60,000 | $47,569 | $69,947 | $108,483 |
| Total Liabilities & Equity | $300,000 | $308,028 | $317,967 | $342,658 |
Projected Cash Flow
| Category | Year 1 | Year 2 | Year 3 |
| Beginning Cash | $88,550 | $116,136 | $134,476 |
| Operating Activities | |||
| Net income (pre-tax) | ($12,431) | $22,378 | $38,536 |
| Depreciation | $17,100 | $17,100 | $17,100 |
| Change in inventory | ($6,992) | ($8,699) | ($9,569) |
| Change in accounts payable | $34,797 | $3,479 | $3,828 |
| Change in prepaid expenses | $9,450 | $0 | $0 |
| Net Cash from Operations | $41,924 | $34,258 | $49,895 |
| Financing Activities | |||
| Loan principal repayment | ($14,338) | ($15,918) | ($17,673) |
| Net Cash from Financing | ($14,338) | ($15,918) | ($17,673) |
| Net Change in Cash | $27,586 | $18,340 | $32,222 |
| Ending Cash | $116,136 | $134,476 | $166,698 |
Break-Even Analysis
| Metric | Value |
| Average ticket | $42.00 |
| Variable cost per transaction (merchandise, floor staff, payroll taxes, and card fees) | $30.16 |
| Contribution per transaction | $11.84 |
| Contribution margin | 28.2% |
| Fixed operating costs, Year 2 (before depreciation and interest) | $172,090 |
| Operating break-even, Year 2 (transactions a year) | 14,530 |
| Operating break-even, Year 2 (transactions a day) | 40 |
| Operating break-even revenue, Year 2 | $610,260 |
| Break-even after depreciation and interest, Year 2 (transactions a year) | 17,911 |
| Break-even after depreciation and interest, Year 2 (transactions a day) | 50 |
| Forecast transactions a day, Year 2 | 55 |
Loan Repayment
Our yearly loan payments are $38,861. EBITDA covers them 0.75 times in Year 1, or 1.16 times before the $16,000 of one-time opening costs, then 1.61 times in Year 2 and 1.98 times in Year 3.
Supplier terms and the working capital reserve cover the Year 1 shortfall, and the loan balance falls to $192,071 by the end of Year 3.
The Quickest Way to turn a Business Idea into a Business Plan
Fill-in-the-blanks and automatic financials make it easy.


Upmetrics
Upmetrics is the #1 business planning software that helps entrepreneurs and business owners create investment-ready business plans using AI. We regularly share business planning insights on our blog. Check out the Upmetrics blog for such interesting reads. Read more