The real estate market in 2026 is resetting across nearly every segment, and that brings up the question most entrepreneurs care about:
Is real estate still a good industry to enter?
The answer is: It depends on the segment. Residential sales, rentals, property management, commercial real estate, and brokerage businesses are not moving in the same direction.
Home prices are still high. Buyers are cautious because of mortgage rates. Rental demand is strong in some regions and soft in others. Brokerage models and commission structures have changed.
So before you invest in a property, start a brokerage, or launch a property management company, look at the recent numbers first.
We’ve pulled together the latest real estate statistics below so you can see where the market stands now, what’s shifted, and where opportunities exist.
Key takeaways for the 2026 real estate market (at a glance)
If you’re short on time, check out these ten numbers, which give you a quick snapshot of the US real estate market:
- The median home price hit $429,300 in May 2026. Prices are still going up, but only by about 1 to 2% a year. This is a big drop from the 15-20% gains shown in 2021 and 2022. (Source)
- Homes took a median of 49 days to sell in May 2026. Back in mid-2021, the same number was 15 days. Things have slowed down a lot. (Source)
- The U.S. housing market reached a record value of $55.1 trillion in June 2025, up more than $20 trillion since 2020. (Source)
- The 30-year fixed mortgage rate was 6.52% as of June 11, 2026. On a typical home, it’s about $750 more per month than buyers paid at the 3% rates back in 2021. (Source)
- Baby boomers are now 42% of US homebuyers, while millennials dropped to 26% (down from 29% last year). Boomers have got the top buyer spot again. (Source)
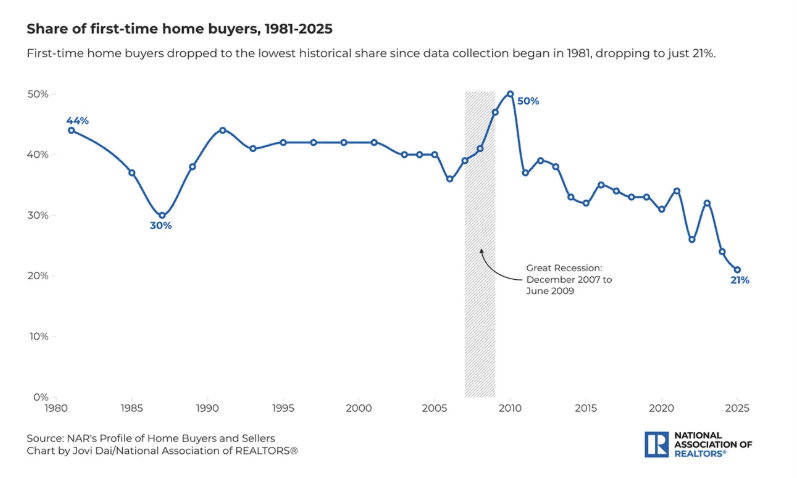
- First-time buyers accounted for 21% of home purchases in 2025. This shows how difficult it has become for new buyers to enter the market. (Source)
- Redfin’s Q2 2025 data shows buyer-agent commissions are still around 2.43%. It was 2.38% a year earlier. Many people expected them to drop after the NAR settlement in August 2024. (Source)
- The national median rent was $1,379 in May 2026. Rent growth has slowed considerably from the highs reached in 2021 and 2022. (Source)
- Office vacancy is still high. Cushman & Wakefield’s Q1 2026 report shows the national office vacancy rate at 20.2% in Q1 2026. (Source)
- Multifamily completions reached 608,000 units in 2024. This was the highest level since 1986, and the supply wave is one reason rent growth has stalled. (Source)
Residential housing market snapshot
The housing market is slower than it was during the pandemic boom. But it hasn’t frozen. People are still buying and selling homes, prices remain high, and buyers have more choices than they had a few years ago.
The main difference is pace. Homes are taking longer to sell, supply has improved, and sellers have less room to overprice.
- The global residential real estate sector dominates the overall market with a projected market value of $506.73 trillion in 2026. (Source)
- The US residential real estate market size is estimated to reach $3.81 trillion in 2026 and $4.21 trillion by 2031, with a CAGR of 2.04% during the forecast period. (Source)
- Existing-home sales hit 4.17 million in May 2026, up 3.2% from last year. Also, homes for sale increased by 0.6% and were valued at 1.55 million. (Source)
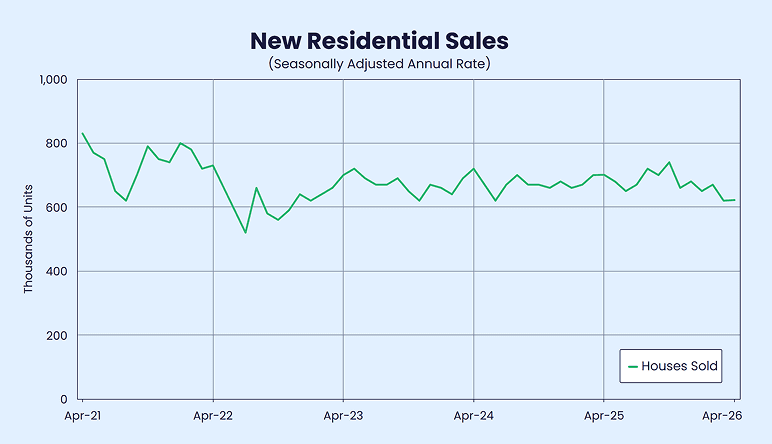
- New single-family home sales hit an annual rate of 622,000 in April 2026, which is 11.3% below the April 2025 rate of 701,000. This means a softer demand on the new-construction side. (Source)
- Now, buyers have more homes to choose from. There were 4.5 months of supply in May 2026. Just a few years ago, during the worst of the shortage, there was only 0.1 months of inventory. (Source)
- The median existing-home price hit $429,300 in May 2026. Prices are still rising, but only 1.3% from last year. (Source)
- Homes took a median of 49 days to sell in May 2026. A slower sale timeline gives buyers more time to compare properties. And this puts pressure on sellers to price more realistically. (Source)
- 35.4% (more than one-third) of US home sellers cut their asking price in April 2026. That’s down slightly from 35.6% a month earlier, based on seasonally adjustments. (Source)
Home buyer & seller demographics (with behavior trends)
The people buying and selling homes in 2026 don’t look much like the buyers and sellers of five years ago.
The market has shifted toward older buyers with more equity, and toward sellers who’ve been sitting in their homes for over a decade. First-time buyers, meanwhile, are getting squeezed out.
Home buyer statistics
- Baby Boomers are now the largest group of homebuyers in the US. They made up 42% of all buyers in 2025, while Millennials dropped to 26%. (Source)
| Generation | Age range | Share of homebuyers (2025) |
| Baby Boomers | 60–78 | 42% |
| Millennials | 26–44 | 26% |
| Gen X | 45–59 | 25% |
| Silent Generation | 79–99 | 4% |
| Gen Z | 18–25 | 4% |
- The median homebuyer is now 59 years old. And the typical first-time buyer is now 40, an all-time high. Buyers are waiting longer before entering the market. (Source)
- Cash buyers made up 25% of existing-home transactions in May 2026. On the other hand, individual investors and second-home buyers made up 14% of home sales. (Source)
- First-time buyers were just 21% of all home purchases in 2025, the lowest share since NAR started tracking in 1981. Before 2008, first-time buyers made up closer to 40% of the market. (Source)
Home seller statistics
- Home sellers stayed in their homes for a median of 11 years before selling in 2025. That was an all-time high. (Source)
- The typical home seller was 64 years old in 2025, which is also a record. (Source)
- Only 5% of homes were sold as For Sale By Owner in 2025. This was an all-time low. FSBO homes also sold for $65,000 less than agent-assisted homes ($360,000 vs $425,000). (Source)
- 60% of those FSBO sellers already knew the buyer of their home. They often sell to a friend, relative, or neighbor, not putting their home on the open market. (Source)
Mortgage rates & housing affordability
Affordability is the biggest challenge in 2026. Mortgage rates are lower than their 2023 peak, and wages are now increasing faster than home prices in many markets. But buying a house is still expensive.
The reason is rate lock-in. Lots of homeowners have very low mortgages from 2020–2021, so they don’t want to sell and take a new loan with a higher rate. That means fewer homes for sale, which keeps prices up.
- Mortgage rates were at their peak in October 2023 (7.79%). But they are still expensive for many buyers. As of June 11, 2026, the 30-year fixed mortgage rate was 6.52%. (Source)
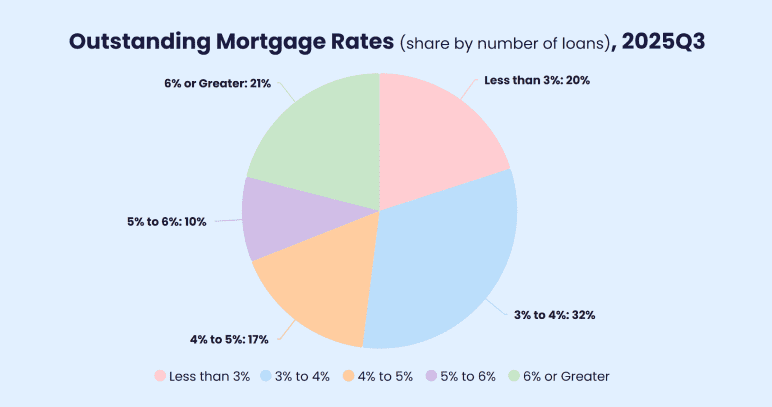
- About 80% of existing mortgages are locked in below 6%, and about half are below 4%. Selling would mean giving up those cheap rates for today’s higher ones. So many homeowners are not selling. (Source)
- Housing Affordability Index hit 105.6 in May 2026, up from 97.5 a year ago. Above 100 means a median-income family qualifies for a median-priced home. (Source)
- Affordability got better across every US region in May 2026. The West led the way (+11.0%), followed by the South (+8.4%), the Midwest (+6.6%), and the Northeast (+5.1%). (Source)
- Mortgage applications rose 10.8% in the week ending June 5, 2026. The jump shows buyers are still rate-sensitive and may move when borrowing conditions improve even slightly. (Source)
- A small rate change can move a lot of buyers. NAHB found that a 25-basis-point drop from 6.25% to 6.00% would allow about 1.42 million more households to afford a median-priced new home. (Source)
Real estate agent & brokerage industry
The real estate agent market is still big, but commissions don’t really tell you what’s going on anymore. Most buyers and sellers still work with agents. Slower sales and flat transaction volume are making brokerages rethink how they hire and train.
For new agents, the hard part isn’t getting licensed. It’s getting enough deals to actually make a living.
- The US real estate brokerage market alone was worth $206.45 billion in 2025. It is estimated to reach $217.43 billion in 2026 and $281.80 billion by 2031, growing at a CAGR of 5.32%. (Source)
- 88% of buyers and 91% of sellers used an agent or broker in 2025. The agent-led model is still the default way people buy/sell homes, even as both sides ask more questions about fees and value. (Source)
- Buyer-agent commissions averaged 2.42% in Q3 2025, up from 2.36% a year earlier, and nearly flat from 2.43% in Q2. Commissions dipped right after the NAR rules took effect, then settled back close to pre-settlement levels. (Source)
- Commission rates vary sharply by home price. Homes under $500K averaged 2.52% in Q2 2025. The $500K-$999K range averaged 2.34%. Homes over $1 million averaged 2.21%. (Source)
- The typical real estate agent earned $58,100 in 2024, up from $55,800 in 2023. That’s a small bump. But a long way from what most new agents expect when they get their license. (Source)
- The typical agent completed 10 transaction slides in 2024, and the typical sales volume remained at $2.5 million. (Source)
- Agents with 16+ years in the business earned a median of $78,900 in 2024. Agents with two years or less earned just $8,100. And 62% of brand-new agents earned less than $10,000 last year. (Source)
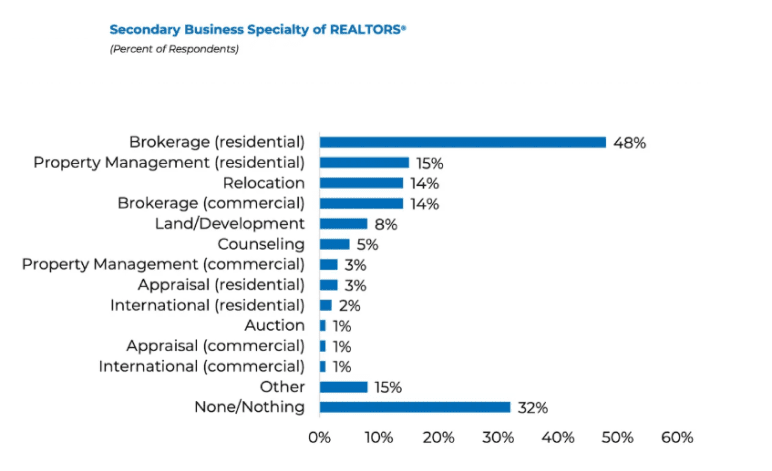
- Many realtors are diversifying beyond residential sales. Residential brokerage is the top secondary specialty at 48%, with property management, relocation, commercial, and land/development all showing up in the mix. (Source)
Rental market, multifamily, & property management
The rental market is moving differently from home sales. Rents have flattened because a wave of new apartments gave renters more choice. But demand hasn’t dried up.
More households are renting, build-to-rent is growing fast, and property managers are getting busier as owners focus on occupancy and operations.
Rental market
- The national median rent rose to $1,379 in May after four straight months of increases. This is mainly because rental demand picked up as the summer moving season began. (Source)
- National rent growth is still weak. Rent prices were down 1.5% year-over-year. And the national median rent has now fallen 4.4% from its 2022 peak. (Source)
- Single-family rentals (SFRs) became more attractive for investors. Returns reached 7.3% in Q4 2025, sharply up from 2021. (Source)
- SFR rents grew 2.6% year-over-year in January 2026, with stronger growth in Midwest markets like Milwaukee (+6.5%), Cleveland (+5.3%), and Pittsburgh (+4.9%). Austin was the only major US metro to post a decline. (Source)
- Build-to-rent (BTR) is also growing. Builders started about 69,000 BTR homes in the year ending September 2025. That was 7.2% of all single-family construction, way more than before the pandemic. (Source)
- Most new rental demand has come from higher-income households over the past decade. The number of renter households making $75,000 or more grew by 1.7 million (from 2021 to 2024). (Source)
Multifamily supply
- The national multifamily vacancy rate stands at 7.2%, slightly below the February peak. And units take about 30 days to lease after being listed. (Source)
- Apartments added a record 784,000 households in Q2 2025, then growth slowed to 366,000 by Q4. (Source)
- The market share of rental units of multifamily construction starts was 95% for Q4 2025. This shows new apartment construction is still heavily focused on rentals, not condos. (Source)
- 608,000 new multifamily units were completed in 2024, the highest since 1986. Nearly half (48%) of those completions were in the South, while the West held 27%, the Midwest 14%, and the Northeast 11%. (Source)
- Among multifamily units completed in 2024, 580,000 (95%) were built-for-rent. More than half of the units were in high-density buildings. (Source)
Property management
- The US property management industry generates $139.9 billion in annual revenue. It has grown at a 2.3% CAGR since 2020, but the market remains large. (Source)
- Residential property management alone is a $100.8 billion industry, with about 238,000 companies operating nationwide. (Source)
- Nearly 12,000 companies manage US apartment properties with 50+ units, and 71% of them run portfolios of just one to four properties. That shows the industry is still made up mostly of small operators. (Source)
- Only 107 companies (1% of the industry) manage at least 100 properties each, and they account for 34% of all apartment units. So the market is fragmented at the company level, while large firms still control a major share of units. (Source)
Here’s the distribution of property management companies, properties, and units by portfolio size:
| Number of Properties in Portfolio | Companies | Properties | Units |
| 1–4 | 8,414 (71%) | 14,495 (14%) | 1,882,927 (10%) |
| 5–19 | 2,542 (21%) | 23,683 (23%) | 3,792,435 (20%) |
| 20–99 | 856 (7%) | 33,347 (32%) | 6,217,590 (33%) |
| 100 or More | 107 (1%) | 26,866 (26%) | 6,317,936 (34%) |
| Owner Managed | – | 5,370 (5%) | 609,156 (3%) |
- No single property management company dominates the US market. Greystar, the largest, serves as the primary manager in 12 metros, including Austin, Phoenix, and Raleigh-Durham, but holds just 5% of properties in its biggest market, West Houston. (Source)
Marketing, tech & AI adoption
Digital is now the default in real estate. Buyers search online, agents use tech to manage deals, and AI has quickly moved into daily work. But the real question isn’t whether the industry is adopting these tools. It’s whether they’re actually working.
- 52% of buyers found the home they purchased online in 2025. 70% used a mobile or tablet during their search. (Source)
- eSignature is the most-used tech tool among realtors at 79%, followed by social media at 75%. Drone photography sits at 52%. These tools are no longer “nice to have.” They’re how agents work. (Source)
- 52% of realtors now use drone photography or video to market listings. This makes it one of the most-used tools in the industry. (Source)
- Social media is the top lead generator for realtors at 39%, followed by CRM tools at 23% and local MLS at 17%. (Source)
- 73% of homeowners say they’re more likely to list with an agent who uses video. But only 10% of agents actually use video in their marketing. That gap is the opportunity. (Source)
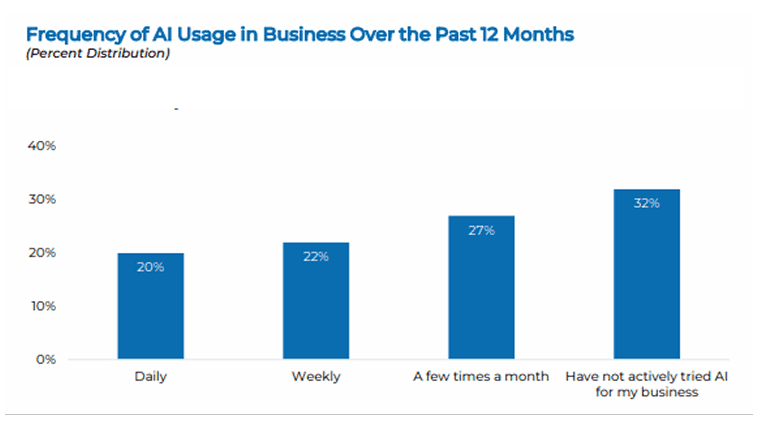
- 68% of realtors reported using AI in their business in 2025. AI moved from experiment to common tool in less than two years. (Source)
- AI use is wide but shallow. 20% of realtors use AI daily, 22% weekly, and the rest either use it occasionally or not at all. (Source)
- ChatGPT leads at 58%, followed by Gemini (20%) and Copilot (15%). Most agents stick with free tiers rather than paid models. (Source)
- 82% of Americans use AI for housing research. ChatGPT (67%) and Gemini (54%) lead with consumers, too. But buyers still trust real estate agents more than AI for housing info. (Source)
- 46% of realtors used AI for listing descriptions and marketing content. Content creation is the most common early use of AI in real estate. (Source)
- Only 17% of agents say AI has had a significant positive impact on their business. 46% say they’ve seen no noticeable difference. Adoption is high, but the productivity gains are mixed. (Source)
- JLL found that 90% of commercial real estate firms are testing AI, but only 5% have actually hit their goals with it. Lots of companies are trying. Not many are getting results yet. (Source)
Commercial real estate statistics
Commercial real estate covers everything from office towers to warehouses, shopping centers to data centers. It’s a much bigger market than residential real estate, with very different dynamics.
In 2026, conditions vary widely by property type, so before you commit capital, check what’s happening in your specific segment.
- The worldwide commercial real estate market is projected to reach $6.35 trillion in 2026 and $8.48 trillion by 2031. This results in a growing CAGR of 5.98%. (Source)
- The US market size is expected to increase from $1.7 trillion in 2025 to $1.75 trillion in 2026 and reach $2.02 trillion by 2031, with a CAGR of 2.91% over 2026-2031. (Source)
Commercial real estate looks very different from sub-sector to sub-sector. The office is finally stabilizing. Industrial is normalizing but still strong. Retail is doing better than people realize. And data centers continue to see strong demand.
Office
- National office vacancy held at 20.2% in Q1 2026, the smallest annual increase since the pandemic began. About half of all tracked US office markets saw vacancy decline year-over-year. (Source)
- Sublease availability fell to 101 million sq ft, down 25% from its Q1 2024 peak. Tenants are recommitting to space instead of dumping it on the market. (Source)
- New office construction has dropped to multi-decade lows. Q1 deliveries fell 40% year-over-year. Space under construction sits at 18.6 msf, the lowest level on record this century. (Source)
Industrial
- Industrial vacancy ticked down to 7.0% in Q1 2026, off its late-2025 peak. Net absorption hit 40 million sq ft, up 52% year-over-year and the best Q1 since 2023. (Source)
- Industrial leasing hit 249.8 million sq ft in Q1 2026, up 14% from a year earlier. Mega big-box facilities over 1.2 million sq ft drove most of the demand. Smaller industrial formats saw less activity. (Source)
- Data center vacancy is at a historic low, and demand keeps growing. Preleasing runs in the mid-70% range, well above the historical norm of 40-50%. AI campuses requiring 500+ megawatts have pushed construction timelines to 24-48 months. (Source)
Retail
- Retail availability sits at just 4.9% in Q1 2026, near multi-decade lows. Average retail asking rents rose 2.4% year-over-year to $24.59 per sq ft. Construction is at record lows, which keeps the market tight. (Source)
- Suburban retail is outperforming downtown retail. Hybrid work has shifted demand outside city centers. Since 2022, downtown availability has risen 120 basis points while suburban availability has fallen 91 basis points. (Source)
Other sectors
- US hotel occupancy rose 0.8% year-over-year in Q1 2026, and evenue per available room (RevPAR) climbed 3.8%. Demand growth outpaced new supply for the first time since the pandemic. (Source)
- Life sciences lab vacancy rose to 23.2% in Q1 2026. Also, average lab/R&D asking rent fell to $67.30 per sq. ft. after five straight quarterly declines. (Source)
Conclusion
The real estate market in 2026 is not moving the same way everywhere. Some areas still have strong demand and low inventory, while others have more listings, slower sales, and softer prices.
That’s why it’s better to watch local signals instead of relying only on national headlines. If you’re buying property, investing in rentals, starting a brokerage, or building a property management business, look at what’s happening in your market first.
Inventory, affordability, rent trends, population growth, and buyer demand will show where things may be headed next.
The Quickest Way to turn a Business Idea into a Business Plan
Fill-in-the-blanks and automatic financials make it easy.
Frequently Asked Questions
What are the best sources for real estate statistics?
Has the NAR commission settlement actually changed what buyers pay?
Is 2026 a good time to start a real estate business?
Upmetrics
Upmetrics is the #1 business planning software that helps entrepreneurs and business owners create investment-ready business plans using AI. We regularly share business planning insights on our blog. Check out the Upmetrics blog for such interesting reads. Read more