1. Executive Summary
Lone Star Auto Group, LLC will open a used-car dealership at 5800 Westheimer Road in Houston, Texas. The spot is in the Galleria/Uptown area, where thousands of cars pass each day. This gives the dealership strong visibility and steady walk-in traffic.
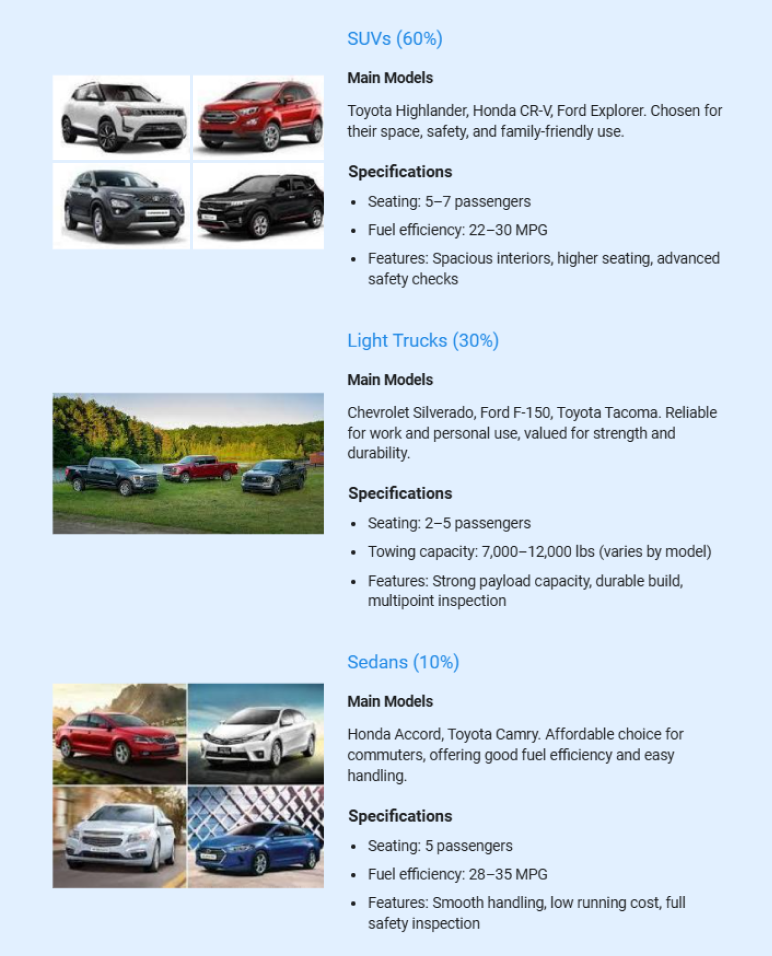
The inventory will focus on SUVs (about 60%) and light trucks (about 30%), plus a smaller number of sedans (about 10%). These are the types of vehicles most families and small-business owners in Houston are looking for—dependable and fairly priced.
Ownership is split between:
- David Tran (55%) – Managing Partner with 15 years in auto sales.
- Maria Lopez (25%) – Finance Manager with banking and compliance experience.
- James Walker (20%) – Silent investor providing capital support.
Mission & Vision
Our mission is simple: Sell reliable, affordable vehicles. Financing will be clear, and service will be helpful. English- and Spanish-speaking buyers will both feel at home.
Our vision is to be the go-to mid-sized dealership in the Galleria/Uptown area within five years. We want people to see us as honest and easy to work with. More than selling cars, we want long-term ties with families and small businesses who will come back again and recommend us to others.
Market Opportunity
Houston, based in Harris County, has over 3.52 million registered vehicles, making it one of the strongest auto markets in the U.S. The Uptown district gives Lone Star daily exposure to about 240,000 passing vehicles. The dealership will target two main groups:
- Families earning $70k–$120k who want reliable SUVs and trucks for everyday use
- Small-business owners like contractors and drivers who rely on durable vehicles for work.
The dealership will stand out by checking and reconditioning every vehicle before it’s sold. Customers will also find bilingual staff in both sales and finance. Financing will be flexible, even for those with limited credit. Warranty options and GAP (Guaranteed Asset Protection) insurance will add peace of mind and encourage repeat business.
Funding Requirements
To get started, Lone Star is applying for a $1.2 million loan from PNC Bank (formerly known as BBVA Compass Bank). The loan will run for seven years at 8.25% interest and be secured by inventory, equipment, and leasehold improvements.
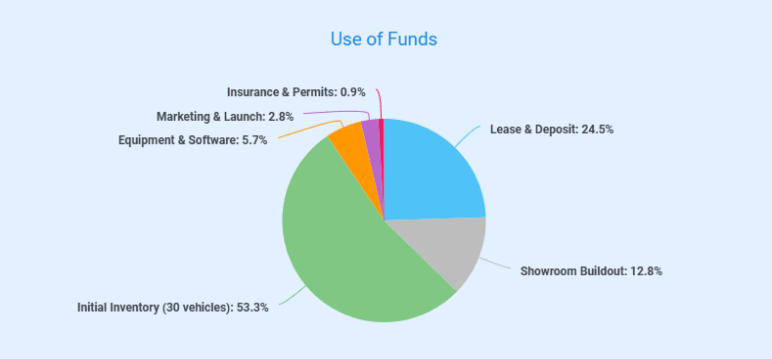
The owners will also add $400,000 of their own money, bringing the total startup fund to about $1.41 million. The money will be used as below:
Financial Highlights
The average selling price is set at $27,500, with around $3,500 profit per vehicle. Monthly fixed costs are about $145,000, so the break-even point is roughly 42 units per month.
Year 1 revenue (by vehicle sales) is estimated at $11.5 million, growing to $15.2 million in Year 2 and $18.1 million in Year 3. By Year 3, the dealership expects a 20% gross margin and 10% net margin.
| Metric | Year 1 | Year 2 | Year 3 |
|---|---|---|---|
| Units Sold | 420 | 550 | 660 |
| Revenue (By Vehicle Sales) | $11.5 million | $15.2 million | $18.1 million |
| Total Expenses | $10.8 million | $13.9 million | $16.3 million |
| Gross Profit Margin | ~18% | ~19% | ~20% |
| Net Margin | 6–7% | 8–9% | ~10% |
The main risks are changes in used-car prices, customers missing loan payments, and tough competition. These will be managed with diverse vehicle sourcing, careful loan screening, and customer-focused service.
With experienced leadership, a prime location, and a clear market plan, Lone Star Auto Group is on track to open in September 2026 and reach break-even by June 2027.
2. Company Overview
Business Identity
Lone Star Auto Group is an independent used-car dealership opening at 5800 Westheimer Road in Houston, Texas. The site is in the Galleria/Uptown area, one of the busiest car-shopping spots in the city with steady daily traffic.
We registered the dealership as a Texas LLC. That structure protects the owners from personal liability and also keeps day-to-day management flexible.
Primarily, we’ll focus on selling late-model SUVs and light trucks, plus a smaller mix of sedans. These are the vehicles Houston families, professionals, and small business owners rely on most. Prices will be fair, and we’ll offer financing designed to help first-time and working-class buyers.
The Lone Star Auto Group name highlights local Texas roots and a customer-first attitude. Our aim is simple: Make the car buying process honest, direct, and reliable, so people know they can trust us.
Ownership & Leadership
The business is owned by three partners who bring different skills.
1. David Tran (55%)
David Tran is the Managing Partner. With 15 years in Houston’s auto industry and prior leadership as Sales Director at AutoNation Southwest, David has overseen teams generating more than $20 million annually. He will manage daily operations, staffing, sales performance, and vendor relationships.
2. Maria Lopez (25%)
Maria Lopez serves as Partner and Finance & Compliance Lead. She is a certified finance and insurance (F&I) manager with experience at PNC Bank (formerly BBVA Compass). Maria will be responsible for finance office operations, compliance with state and federal regulations, lender relations, and customer financing programs.
3. James Walker (20%)
James Walker is a silent investor and former oil and gas executive. He provides capital support and adds financial oversight.
This combination of auto experience, finance skills, and investment backing gives Lone Star Auto Group a strong foundation for growth.
Business Model
Lone Star Auto Group will operate as a full-service dealership specializing in certified pre-owned vehicles. The planned inventory mix matches local demand:
- 60% SUVs such as the Toyota Highlander, Honda CR-V, and Ford Explorer
- 30% light trucks, including the Chevrolet Silverado, Ford F-150, and Toyota Tacoma
- 10% sedans such as the Honda Accord and Toyota Camry
Vehicles will be purchased from Manheim Houston, Auto Auction Dallas, and customer trade-ins. Each car will go through inspection and reconditioning before being listed for sale, ensuring buyers get reliable, good-quality vehicles.
Revenue will come from both car sales and additional products: Extended warranties ($1,200–$2,800), GAP insurance ($495), and finance reserves from in-house financing. Annual Percentage Rates (APRs) will range from 9–18%, giving options to buyers with limited credit. This dual-income model boosts profit margins and gives customers more value in one place.
Location Advantage
Lone Star Auto Group will be on Westheimer Road, one of Houston’s busiest streets. Around 240,000 cars pass by each day, giving strong visibility.
The property can hold 60–70 vehicles. That’s enough for a good variety but still easy to keep track of. There’s also a showroom and a service area, so sales and reconditioning happen in the same spot. The Southwest Freeway is right nearby, so people from across Houston can reach us fast.
The Galleria/Uptown area is packed with shops and commuters. Being here means more walk-in buyers, clear signage, and easy comparisons for customers looking at cars in one area.
Startup Summary
| Category | Amount |
|---|---|
| Start-up Requirements | |
| Lease & Deposit | $345,000 |
| Showroom Buildout | $180,000 |
| Initial Inventory (30 units) | $750,000 |
| Shop Equipment & Tools | $65,000 |
| Software & CRM Setup | $15,000 |
| Office Setup & Furniture | $20,000 |
| Marketing & Launch Ads | $40,000 |
| Insurance & Licensing | $12,000 |
| Working Capital Reserve | $50,000 |
| Total Requirements | $1,477,000 |
| Funding Sources | |
| Bank Loan (PNC Bank) | $1,200,000 |
| Owner Equity | $400,000 |
| Total Funding | $1,600,000 |
| Liabilities & Capital | |
| Long-term Loan Obligation | $1,200,000 |
| Owner Equity Contribution | $400,000 |
| Start-up Expenses Expensed Out | ($23,000) |
| Total Liabilities & Capital | $1,577,000 |
Strategic Goals
Lone Star Auto Group has set the following goals:
- Secure $1.2 million in bank financing and add $400,000 in owner equity
- Finish site buildout and purchase vehicles in mid-2026, opening by September 2026
- Sell about 35 vehicles per month in the first year, and increase sales to 55 per month by Year 3.
- Reach break-even by June 2027. This is based on $145,000 in monthly fixed costs and an average profit of $3,500 per vehicle.
- Strengthen the brand through community events, bilingual service, and warranty-backed cars
With strong leadership, a busy location, and a clear plan, Lone Star Auto Group is ready to stand out in Houston’s used-car market and build a stable, long-term business.
Find this sample useful? Want to create a plan like this?
Use Upmetrics’ AI Business Plan Generator to build your own.

3. Industry & Market Analysis
Overview
In 2024, franchised light-vehicle dealers in the U.S. sold about 15.9 million vehicles across nearly 17,000 locations. When combined with independent dealers and private transactions, total U.S. used-vehicle sales reached about 35.9 million units in 2023, and they are expected to climb to 36.2 million in 2024. This makes pre-owned vehicles the dominant choice for most buyers.
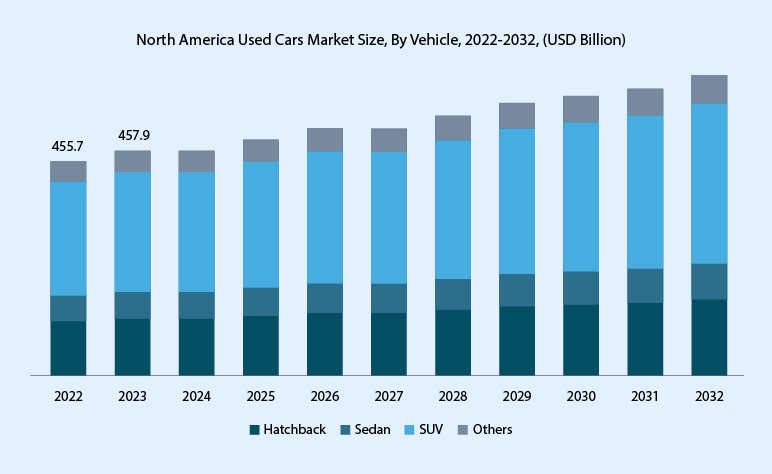
The industry is still growing. Experts project the U.S. used-car market will reach $1.05 trillion by 2025 and continue expanding steadily through 2030. In North America, the market was worth $457.9 billion in 2023 and is expected to grow about 9% each year through 2032.
Houston Market
Houston is one of the nation’s strongest markets for used cars. Public transit is limited, so residents depend on personal vehicles for work, school, and family needs. According to the Texas Department of Motor Vehicles (TxDMV) report, Harris County (home to Houston) had over 3.52 million registered vehicles in 2023. This shows the depth of demand for affordable and dependable cars in the area.
Target Customer Segments
Lone Star Auto Group will focus on two main customer groups in Houston:
| Segment | Profile | Needs | Example Vehicles |
|---|---|---|---|
| Families (Primary) | Ages 28–50, with middle income $70k–$120k | Safe, reliable SUVs with space for children and daily commuting | Toyota Highlander, Honda CR-V, Ford Explorer |
| Small Business Owners (Secondary) | Contractors, delivery drivers, trades | Durable light trucks and SUVs, fleet financing, dependable reconditioning | Ford F-150, Chevy Silverado, Toyota Tacoma |
Both groups are practical buyers. Families care about affordability and warranty protection, while business owners value dependability and credit options. Lone Star’s bilingual staff, financing programs, and extended warranties match these needs directly.
Competitive Landscape
Houston has a busy used-car market with several established players. Below is a look at the main competitors Lone Star Auto Group will face and how they compare.
1) Direct Competitors
Local buyers often choose from three main dealerships nearby. Each one brings different advantages, but also leaves room for Lone Star to stand out.
Here’s an overview:
- CarMax Houston (9951 Southwest Freeway): CarMax is the biggest used-car retailer in the country. The Houston store is well known for its wide inventory and clear pricing. However, their scale means a very standardized buying process, with limited room for negotiation and little flexibility in financing for buyers with lower credit scores.
- Houston Direct Auto (4011 Jeanetta Street): This local dealer competes mainly on low prices. It’s close to our location and appeals to budget buyers. The trade-off is that it has a smaller brand name, offers fewer warranty options, and does not have the same level of professionalism as larger dealers.
- AutoNation USA (9115 Southwest Freeway): AutoNation is a national brand with a strong reputation and plenty of inventory. But higher overhead means higher prices, and service is less personal. They also don’t offer much support for bilingual customers.
2) Indirect Competitors
Beyond nearby dealerships, Lone Star also faces competition from online sellers and new-car franchises. These options appeal to some buyers but still leave a gap that Lone Star can fill.
- Online platforms (Carvana, Vroom): These companies let people shop completely online and even deliver cars to their homes. While convenient, they lack face-to-face service, bilingual support, and the trust that comes with a local warranty.
- Franchise dealerships (new cars): New-car dealers carry the latest models and have strong manufacturer support. But many families and small businesses can’t justify spending $15,000–$20,000 more when a late-model used SUV or truck meets the same needs for far less.
Key Trends
SUVs and light trucks dominate the U.S. auto market, now making up over 80% of new-vehicle sales nationwide, with Texas leading this trend. At the same time, average new-car prices climbed to around $47,000 in 2023. These high prices are pushing many families and small businesses toward pre-owned options.
With an average selling price of $27,500, Lone Star Auto Group is positioned to meet this demand with vehicles that balance affordability and quality.
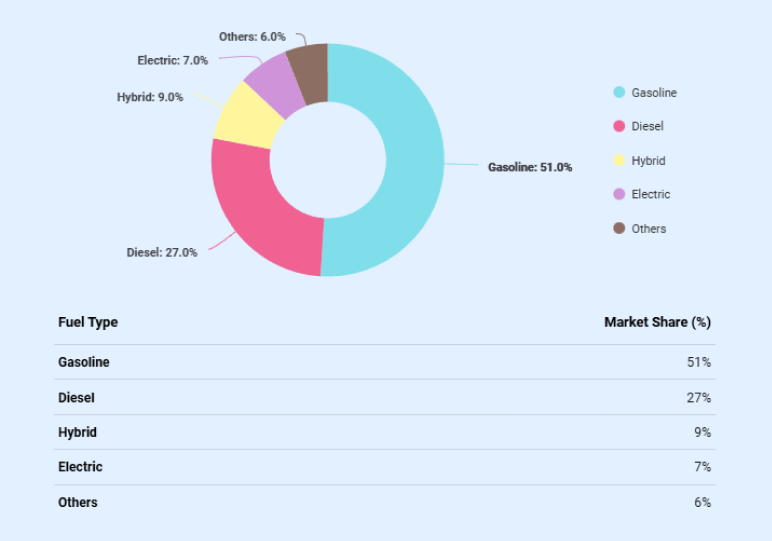
Fuel type is another driver. In 2023, gasoline-powered vehicles accounted for more than 51% of the used-car market. The strong preference for gas vehicles comes from the wide network of gas stations, lower upfront cost compared to EVs, and overall practicality for most households.
While hybrids and EVs are growing slowly, most buyers still prefer gasoline SUVs and trucks. Luckily, this directly matches Lone Star Auto Group’s inventory focus.
Moreover, how customers shop is also changing. More than 80% of buyers begin their search online before visiting a dealership. Lone Star Auto Group will meet this trend by showcasing inventory on platforms like AutoTrader, Cars.com, and Facebook Marketplace, while also highlighting bilingual service and flexible financing.
Shoppers also want peace of mind. More people are choosing certified pre-owned vehicles that come with inspections and warranties. They also expect clear, quick financing decisions, even if they don’t have perfect credit.
Lone Star’s process of multipoint inspections, warranty-backed vehicles, and in-house financing gives customers this assurance, while also building long-term loyalty.
Legal Compliance
Lone Star will stay fully compliant with Texas dealer requirements, including:
- Texas Dealer License ($700 annually).
- City of Houston Occupancy Permit.
- Garage Liability Insurance of $2M to cover test drives, lot inventory, and service work.
With compliance led by the Finance Manager, lenders can trust that risks around licensing and insurance are controlled.
4. SWOT Analysis
A SWOT analysis looks at the main strengths, weaknesses, opportunities, and threats for Lone Star Auto Group. It helps show where the business is strong and where challenges may come up.
Strengths
These are the things that give Lone Star a strong start.
- Great location on Westheimer Road with lots of daily traffic.
- Owners have experience in auto sales, finance, and compliance.
- Focus on SUVs and trucks, the most popular vehicles in Texas.
- In-house financing and warranties that add trust and extra income.
- Loan backed by inventory, equipment, and property improvements.
Weaknesses
These are the areas that may cause challenges early on.
- The business will rely heavily on bank financing at launch.
- High upfront costs for vehicles and showroom buildout.
- Brand is new, so awareness is limited at first.
- Smaller starting inventory compared to bigger competitors.
Opportunities
These are the chances for growth in the current market.
- More buyers choosing used cars as new ones get too expensive.
- Houston’s growing population with heavy car use.
- Bilingual service helps reach a wider customer base.
- Potential to grow into service plans, fleet sales, and repeat buyers.
- Strong demand for flexible financing options, including subprime loans.
Threats
These are outside risks that could affect the business.
- Competition from big chains like CarMax and AutoNation.
- Changing prices and supply at car auctions.
- Higher interest rates could make financing harder for buyers.
- Economic slowdowns may reduce car sales.
- Loan defaults or repossessions could hurt cash flow.
5. Product Offerings
Core Inventory
Lone Star Auto Group will focus mainly on certified pre-owned SUVs and light trucks, with a smaller number of sedans. This mix matches what buyers in Houston want most.
By staying focused on these categories, Lone Star will carry vehicles with steady demand, faster turnover, and stronger resale value.
Pricing Strategy
The average selling price will be about $27,500. This price keeps cars affordable for families earning $70,000–$120,000 a year, while still leaving room for profit. Each car is expected to bring in about $3,500 in gross margin, thanks to smart buying and reconditioning. This setup helps Lone Star stay competitive with bigger chains and local dealers while keeping the business profitable.
Financing Options
Financing is a big part of Lone Star’s business model. Customers will have two main options:
- In-house financing with interest rates between 9% and 18%, making it possible to serve both prime and subprime borrowers.
- Outside lending partnerships with banks and finance companies to expand loan options for qualified buyers.
The finance office will be managed by Maria Lopez, who speaks both English and Spanish. This makes sure Spanish-speaking customers clearly understand their loan terms. In-house financing not only makes loans easier for buyers but also brings extra income to the dealership.
Add-On Products
To build long-term relationships and add more value, Lone Star will offer:
- Extended warranties from $1,200 to $2,800, lasting up to 36 months.
- GAP insurance at $495, protecting buyers if a car is totaled or stolen.
- Service perks like free oil changes on qualifying purchases and tire packages through local partners.
These extras create more revenue while showing that Lone Star stands behind its vehicles and supports its customers after the sale.
Future Expansion
In the future, Lone Star also plans to launch a fleet program for local small businesses. By working with contractors, drivers, and other companies, the dealership can create steady demand for trucks and SUVs. This approach helps build lasting relationships, not just one-time sales.
6. Team
Lone Star Auto Group is led by a strong ownership team and supported by a focused staff. Together, they bring the right mix of sales, finance, and operational experience to run the dealership smoothly and grow it over time.
Key Roles and Compensation
| Role / Owner | Headcount | Compensation | Key Responsibilities |
|---|---|---|---|
| David Tran – Managing Partner / GM | 1 | $95,000 base + profit share | Leads daily operations, manages sales, and oversees vendor relationships |
| Maria Lopez – Partner / Finance Manager | 1 | $75,000 base + commissions on financing | Handles lending, compliance, and finance products |
| James Walker – Investor (Silent Partner) | 1 | No salary, equity share only | Provides capital support and strategic oversight |
| Sales Associates | 6 FTE | $2,500/month base + 3% commission (~$65K OTE) | Support customers, close sales, provide bilingual service |
| Service Technicians | 2 FTE | $24/hour + overtime | Handle inspections, reconditioning, and warranty work |
| Lot Attendants | 2 FTE | $15/hour | Keep vehicles clean, staged, and ready for customers |
| Admin/Reception | 1 | $40,000 annual salary | Manages calls, scheduling, and paperwork |
The owners bring long experience in auto sales and finance, while the staff members are trained to deliver strong customer service and efficient operations. Payroll is structured to stay predictable but flexible as sales grow.
As the business expands from 35 to 55 units per month over three years, additional sales associates and technicians will be added. This gradual approach keeps payroll in line with revenue and supports long-term growth.
7. Marketing & Sales Strategy
Marketing Objectives
Lone Star Auto Group has three clear goals for its marketing:
- Bring in steady, good-quality leads through both online and local channels.
- Build brand awareness in the Galleria/Uptown area, where many dealerships compete.
- Turn first-time buyers into repeat customers by offering good service, warranties, and referral rewards.
This mix of goals shows that Lone Star is not depending on just one way to reach customers. Instead, it uses ads, local visibility, and community ties to get results.
Marketing Channels & Budget
Lone Star Auto Group will use both online and local marketing to reach buyers. This includes Google Ads, social media, car listing sites, billboards, and local sponsorships. To support this, the dealership will spend about $16,800 each month on marketing. That’s around 2–3% of projected sales, which is in line with what most auto dealers spend.
| Channel | Purpose | % of Budget | Monthly Spend |
|---|---|---|---|
| Google Ads | Target buyers searching for SUVs, trucks, and financing in Houston. | 35% | $6,000 |
| Facebook/Meta | Reach bilingual households; promote financing and family-friendly deals. | 25% | $4,000 |
| AutoTrader + Cars.com | Capture serious buyers who are already in shopping mode. | 20% | $3,500 |
| Billboard Ads | Drive brand visibility in the Uptown auto corridor. | 15% | $2,500 |
| Sponsorships | Build goodwill with HISD sports teams and the Hispanic Chamber. | 5% | $800 |
Sales Process
The dealership will follow a clear, customer-friendly process to turn leads into sales:
- Lead Capture – Prospects contact the dealership through online listings, ads, or walk-ins. All inquiries are logged into the CRM system.
- Initial Response – Sales associates respond quickly to online leads with vehicle availability, pricing, and financing options.
- Consultation & Test Drive – Associates use a bilingual, consultative approach to match customers with vehicles based on needs and budget.
- Financing & Add-ons – The Finance Manager presents financing terms clearly, along with extended warranty and GAP insurance options.
- Closing & Delivery – Final paperwork is completed through Dealertrack, and the customer drives away with a certified vehicle and clear service commitments.
- Post-Sale Follow-up – Customers are contacted after purchase for feedback, reminders about service promotions, and referral incentives.
This customer-centered approach is designed to improve conversion rates, build trust, and increase repeat business.
Grand Opening Promotions
In the first 90 days, Lone Star Auto Group will run promotions to build quick sales, bring in walk-in traffic, and spread word-of-mouth referrals. These offers aim not only to drive early sales but also to build trust with new customers.
- $500 discount on the first 50 vehicles sold (about $25,000 cost).
- Free oil changes for one year with SUV purchases (worth about $150 per vehicle, up to $7,500 total).
- Referral rewards program offering $100 gift cards for new buyer referrals (budgeted at $5,000).
Together, these promotions represent about $37,500 in total spend. They will help spark early sales, reduce cash-flow risk, and position Lone Star as a trusted dealership from day one.
Milestone-Driven Sales Plan
Sales growth will be tracked through quarterly milestones, showing a structured ramp from opening through Year 3. This approach demonstrates to lenders that Lone Star has realistic, time-bound targets.
| Year | Quarter | Target Sales | Focus / Key Actions |
|---|---|---|---|
| Year 1 (2026–2027) |
Q1 (Sept–Nov 2026) | 90 units (30/month) | Awareness ads, launch offers |
| Q2 (Dec–Feb 2027) | 105 units (35/month) | Referral program launch | |
| Q3 (Mar–May 2027) | 120 units (40/month) | Fleet outreach (contractors/delivery) | |
| Q4 (Jun–Aug 2027) | 126 units (42/month) | Break-even target | |
| Year 2 (2027–2028) |
Full Year | ~550 units (46–48/month) | More referral/repeat sales, expand fleet program |
| Year 3 (2028–2029) |
Full Year | ~660 units (55/month) | Stronger brand, less reliance on ads |
8. Operations
Lone Star Auto Group will operate six days a week with extended evening hours and limited Sunday hours to capture weekend shoppers. Regular hours will be:
- Monday–Saturday: 9:00 a.m. to 8:00 p.m.
- Sunday: 12:00 p.m. to 6:00 p.m.
These hours match shopping habits in Houston, where most buyers prefer evenings and weekends. Being available when families and small business owners shop helps Lone Star compete with larger dealerships.
Daily Workflow
To cover busy evenings and weekends, sales staff will work AM and PM shifts, ensuring 4–5 associates are always available. Service technicians will work daytime hours to prepare cars for same-day delivery.
The sales cycle follows a clear, repeatable workflow:
- Vehicle intake from auctions or trade-ins.
- Inspection & reconditioning by technicians.
- Lot prep & staging with photos and online listings.
- Sales process managed through CRM for walk-ins and online leads.
- Financing & delivery completed with add-on product offers (warranties, GAP insurance).
Sourcing & Reconditioning
Most vehicles will come from wholesale auctions like Manheim Houston and Auto Auction Dallas, plus direct trade-ins from customers. This mix helps reduce risk if prices change at one source.
Every vehicle will go through a detailed inspection and reconditioning process before being offered for sale. This includes mechanical checks, safety testing, and cosmetic improvements. Each car will have certification tags and inspection reports, so customers can clearly see the quality and trust what they are buying.
Vendor Contracts & Systems
To keep operations professional while avoiding unnecessary overhead, Lone Star Auto Group will rely on a few key vendor partnerships:
- Dealertrack – A finance and credit tool ($1,200/month) that makes loan approvals faster, connects with many lenders, and helps customers get better financing options.
- ADESA Auction Membership – A yearly $1,500 membership that gives access to more used cars across Texas, helping Lone Star keep enough vehicles in stock at fair prices.
- Enterprise Fleet Leasing – Provides temporary loaner cars when customer repairs take longer, making sure buyers can stay on the road and feel well taken care of.
These systems give Lone Star dealership-grade tools at a reasonable cost, helping operations run smoothly and professionally from the start.
9. Financial Planning
Funding & Startup Costs
| Category | Amount | Details |
|---|---|---|
| Lease & Deposit | $345,000 | $320,000 annual lease + $25,000 security deposit |
| Showroom Buildout | $180,000 | Renovation and customer facilities (Houston Commercial Interiors) |
| Initial Inventory | $750,000 | 30 vehicles at ~$25,000 each |
| Shop Equipment | $65,000 | Lifts, diagnostic tools, reconditioning equipment |
| Software & CRM | $15,000 | Dealertrack and CRM integration setup |
| Marketing Launch | $40,000 | Google ads, billboards, referral campaigns |
| Insurance & Permits | $12,000 | Dealer license, permits, liability insurance |
| Total Startup Costs | $1.41M | $1.2M loan + $400K owner equity |
Important Assumptions
| Assumption | Year 1 | Year 2 | Year 3 |
|---|---|---|---|
| Unit Sales (per year) | 420 units (35/month avg.) | 550 units (46/month avg.) | 660 units (55/month avg.) |
| Average Selling Price | $27,500 | $27,500 | $27,500 |
| Gross Profit per Unit | $3,500 | $3,500 | $3,500 |
| Total Fixed Costs (monthly) | $145,000 | $145,000 | $145,000 |
| Break-Even Sales Level | 42 units/month | 42 units/month | 42 units/month |
| Bank Loan Terms | $1.2M @ 8.25% (7 years) | $1.2M @ 8.25% (7 years) | $1.2M @ 8.25% (7 years) |
| Inventory Turnover Period | 60 days avg. | 60 days avg. | 60 days avg. |
| Referral/Repeat Sales | 10–15% of sales | 20–25% of sales | 25–30% of sales |
Revenue by Month
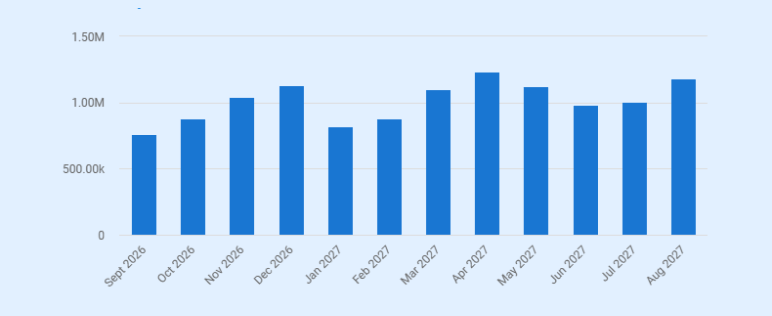
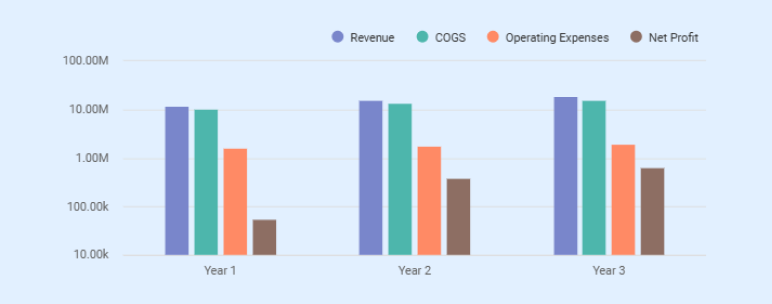
Profit & Loss Statement
| Category | Year 1 | Year 2 | Year 3 |
|---|---|---|---|
| Revenue | |||
| Vehicle Sales (units) | 420 × $27,500 = $11,550,000 | 550 × $27,500 = $15,125,000 | 660 × $27,500 = $18,150,000 |
| Finance Reserve Income | $210,000 | $280,000 | $330,000 |
| Warranty Sales | $315,000 | $400,000 | $480,000 |
| GAP Insurance | $75,000 | $100,000 | $120,000 |
| Total Revenue | $12,150,000 | $15,905,000 | $19,080,000 |
| Cost of Goods Sold | |||
| Vehicle Purchases | $10,080,000 | $13,200,000 | $15,840,000 |
| Reconditioning Costs | $126,000 | $165,000 | $198,000 |
| Total COGS | $10,206,000 | $13,365,000 | $16,038,000 |
| Gross Profit | $1,944,000 | $2,540,000 | $3,042,000 |
| Operating Expenses | |||
| Payroll & Benefits | $1,080,000 | $1,200,000 | $1,320,000 |
| Lease & Utilities | $365,000 | $370,000 | $375,000 |
| Marketing | $120,000 | $150,000 | $180,000 |
| Insurance & Permits | $40,000 | $45,000 | $50,000 |
| Admin & Office | $55,000 | $60,000 | $65,000 |
| Total Operating Exp. | $1,660,000 | $1,825,000 | $1,990,000 |
| EBITDA | $284,000 | $715,000 | $1,052,000 |
| Other Expenses | |||
| Loan Repayments | $210,000 | $210,000 | $210,000 |
| Taxes (25%) | $18,500 | $126,250 | $210,500 |
| Net Profit | $55,500 | $378,750 | $631,500 |
Cash Flow Estimate
| Category | Year 1 | Year 2 | Year 3 |
|---|---|---|---|
| Opening Balance | $400,000 | $215,500 | $394,250 |
| Cash Inflows | |||
| Sales Receipts | $11,550,000 | $15,125,000 | $18,150,000 |
| Finance/Warranty/GAP | $600,000 | $780,000 | $930,000 |
| Bank Loan | $1,200,000 | – | – |
| Owner Equity | $400,000 | – | – |
| Total Inflows | $13,750,000 | $15,905,000 | $19,080,000 |
| Cash Outflows | |||
| Vehicle Purchases | $10,080,000 | $13,200,000 | $15,840,000 |
| Reconditioning | $126,000 | $165,000 | $198,000 |
| Payroll & Benefits | $1,080,000 | $1,200,000 | $1,320,000 |
| Lease & Utilities | $365,000 | $370,000 | $375,000 |
| Marketing | $120,000 | $150,000 | $180,000 |
| Insurance & Permits | $40,000 | $45,000 | $50,000 |
| Admin & Office | $55,000 | $60,000 | $65,000 |
| Loan Payments | $210,000 | $210,000 | $210,000 |
| Taxes | $18,500 | $126,250 | $210,500 |
| Total Outflows | $12,094,500 | $15,526,250 | $18,448,500 |
| Net Cash Flow | $1,655,500 | $378,750 | $631,500 |
| Closing Balance | $215,500 | $394,250 | $1,025,750 |
Projected Balance Sheet
| Category | Year 1 | Year 2 | Year 3 |
|---|---|---|---|
| Assets | |||
| Cash | $215,500 | $394,250 | $1,025,750 |
| Accounts Receivable | $100,000 | $150,000 | $200,000 |
| Inventory | $600,000 | $700,000 | $750,000 |
| Total Current Assets | $915,500 | $1,244,250 | $1,975,750 |
| Equipment & Tools | $245,000 | $245,000 | $245,000 |
| Leasehold Improvements | $180,000 | $165,000 | $150,000 |
| Total Fixed Assets | $425,000 | $410,000 | $395,000 |
| Total Assets | $1,340,500 | $1,654,250 | $2,370,750 |
| Liabilities | |||
| Accounts Payable | $80,000 | $90,000 | $100,000 |
| Loan Balance (Remaining) | $1,050,000 | $975,000 | $900,000 |
| Other Liabilities | $40,000 | $45,000 | $50,000 |
| Total Liabilities | $1,170,000 | $1,110,000 | $1,050,000 |
| Equity | |||
| Owner Equity | $400,000 | $400,000 | $400,000 |
| Retained Earnings | -$229,500 | $144,250 | $920,750 |
| Total Equity | $170,500 | $544,250 | $1,320,750 |
| Total Liabilities + Equity | $1,340,500 | $1,654,250 | $2,370,750 |
Loan Repayment Plan
We’re asking for a $1.2 million loan at 8.25% interest, to be paid over seven years. That works out to about $17,500 a month, or $210,000 a year.
The loan will be backed by our car inventory, shop equipment, and lease improvements, so the bank has good security.
By Year 3, we expect to make about $1.8 million in net income. That’s plenty to cover loan payments and still put money back into the business. Even if sales are a little lower, we’ll still have enough cash flow to stay on track, which keeps the risk low for the bank.
| Loan Detail | Amount |
|---|---|
| Loan Principal | $1.2M |
| Interest Rate | 8.25% fixed |
| Term Length | 7 years |
| Monthly Payment (approx.) | $17,500 |
| Annual Debt Service | ~$210,000 |
| Collateral | Vehicle inventory, equipment, and leasehold improvements |
Break-Even Analysis
| Category | Amount | Notes |
|---|---|---|
| Fixed Monthly Costs | $145,000 | Lease, payroll, insurance, utilities, marketing |
| Average Selling Price/Unit | $27,500 | Based on planned inventory mix |
| Average Gross Profit/Unit | $3,500 | After reconditioning and direct costs |
| Break-Even Units/Month | 42 units | $145,000 ÷ $3,500 |
| Break-Even Units/Year | 504 units | 42 × 12 |
| Break-Even Revenue/Month | ~$1.16M | 42 × $27,500 |
| Break-Even Revenue/Year | ~$13.9M | 504 × $27,500 |
Lone Star Auto Group must sell 42 vehicles per month to cover its fixed costs of $145,000. This equals about 504 vehicles annually, generating nearly $14 million in revenue.
- In Year 1, sales are expected to reach 420 units (just below breakeven).
- By Q4 Year 1, monthly sales reach 42 units, hitting breakeven.
- By Year 3, monthly sales grow to 55 units, giving a strong profit cushion.
This break-even point shows that once the dealership reaches a stable sales volume, it can cover all costs and generate consistent profit.
Business Ratios
| Ratio Category | Year 1 | Year 2 | Year 3 |
|---|---|---|---|
| Profitability | |||
| Gross Margin % | 19.5% | 20.1% | 20.2% |
| Net Margin % | 6.5% | 9.2% | 10.0% |
| Return on Assets (ROA) | 5.4% | 8.3% | 11.5% |
| Return on Equity (ROE) | 12.5% | 18.6% | 23.5% |
| Liquidity | |||
| Current Ratio (CA ÷ CL) | 3.2 | 4.1 | 6.1 |
| Quick Ratio (Cash + AR ÷ CL) | 1.1 | 1.8 | 3.7 |
| Leverage | |||
| Debt-to-Equity | 6.6 | 2.1 | 0.8 |
| Debt-to-Assets | 0.87 | 0.68 | 0.45 |
| Efficiency | |||
| Inventory Turnover (COGS ÷ Avg. Inv.) | 6.5x | 7.2x | 7.9x |
| Days Inventory Outstanding (365 ÷ IT) | 56 days | 51 days | 46 days |
| Accounts Receivable Days | 18 | 15 | 12 |
| Asset Turnover (Sales ÷ Total Assets) | 8.4x | 9.1x | 9.6x |
Scenario Planning
1) Base Case (Expected)
| Year | Units Sold | Revenue | Net Margin |
|---|---|---|---|
| Year 1 | 420 | $11.5M | 6–7% |
| Year 2 | 550 | $15.2M | 8–9% |
| Year 3 | 660 | $18.1M | ~10% |
This means the dealership breaks even by mid-Year 1 and grows at a steady, sustainable pace.
2) Best Case
| Year | Units Sold | Revenue | Net Margin |
|---|---|---|---|
| Year 1 | 480 | $13.2M | 7–8% |
| Year 2 | 600 | $16.5M | 10–11% |
| Year 3 | 780 | $21.5M | 12–13% |
In short, stronger demand allows faster loan repayment and expansion into fleet sales earlier than planned.
3) Worst Case
| Year | Units Sold | Revenue | Net Margin |
|---|---|---|---|
| Year 1 | 320 | $8.8M | 2–3% |
| Year 2 | 400 | $11.0M | 3–4% |
| Year 3 | 480 | $13.2M | 4–6% |
It shows growth is slower, but operations remain stable through leaner payroll, smaller inventory, and the $200k credit line.
Risk Mitigation Strategy
Every business faces risks, but Lone Star Auto Group has planned steps to reduce the impact of the most important ones. This helps lenders see that the dealership can handle problems without losing stability.
- Used-car price swings: To avoid overpaying, vehicles will be purchased from several auction sources instead of relying on one. Accepting trade-ins from customers will also help keep costs balanced.
- Slow sales months: A $200,000 credit line is in place as a safety net. Seasonal promotions and discounts will be used to keep cash flowing when demand slows down.
- Loan defaults: Not every buyer will qualify, so strict credit checks will be done. For higher-risk loans, Lone Star will work with trusted lenders like Credit Acceptance Corp to reduce exposure.
- High operating costs: Payroll will stay tied to sales volume. Cars that don’t sell within 75 days will be discounted to free up space and cash.
- Competition pressure: Lone Star will set itself apart through bilingual support, transparent pricing, and warranty-backed cars, which many local dealers don’t emphasize.
- Compliance issue: The Finance Manager will oversee regular audits and keep records up to date so that the dealership avoids fines or licensing problems.
The Quickest Way to turn a Business Idea into a Business Plan
Fill-in-the-blanks and automatic financials make it easy.
Frequently Asked Questions
Why do you need a car dealership business plan?
How to get funding for your car dealership business?
Where to find business plan writers for your car dealership business?
What is the easiest way to write your car dealership business plan?
Upmetrics
Upmetrics is the #1 business planning software that helps entrepreneurs and business owners create investment-ready business plans using AI. We regularly share business planning insights on our blog. Check out the Upmetrics blog for such interesting reads. Read more