One might detest numbers. But in an entrepreneurial world where the figures dominate, understanding your finances can offer a clear picture of the company’s stability and profitability.
Financial ratios are one such tool that helps businesses evaluate their financial health and sustainability.
By analyzing key financial ratios, businesses can uncover important insights essential to making strategic decisions and enhancing business performance.
But what exactly is financial ratio analysis? How do you calculate these ratios and how can you interpret them to guide decision-making?
Well, we’ll uncover all that in this blog post. Let’s dive right in.
What is a Financial Ratio?
A financial ratio is a numerical comparison between two or more figures from your company’s financial statements. It offers insight into a company’s liquidity, growth, margin, profitability, valuation, and related aspects.
Companies perform quantitative analysis by using the figures from the balance sheet, income statement, and cash flow statement. Investors then use these ratios to make predictions about a company’s financial stability and future growth.
Types of Financial Ratios
Financial ratios are categorized into 5 aspects to help evaluate a company’s liquidity, leverage, profitability, efficiency, and market prospect.
Let’s understand each of these ratios in detail.
1. Liquidity Ratios

These financial metrics take the company’s current quick asset holding into account to ascertain its ability (liquidity) to repay its short and long-term debts as they fall due and its margin of safety.
It indicates whether the business can fulfill its current debt obligations with the assets it holds or if it needs to raise external credit to pay off its liabilities.
Current Ratio
This ratio calculates the liquidity of your business to understand its capacity to meet short-term obligations.
A current ratio below 1 indicates poor liquidity of the business, and if it is more than 1.5 it is considered a good current ratio.
Acid-Test Ratio/Quick Ratio
The financial analyst considers quick assets such as cash, marketable securities, or cash receivables to calculate the acid-test ratio. Less liquid current assets like prepaid cash expenses or inventory are removed.
The Quick Ratio of 1 or more is considered good for business but if it falls below 1, it shows the business may struggle to meet higher current obligations against its lower liquid assets.
Cash Ratio
The cash ratio ascertains the liquidity of your business if you meet your short-term obligations by using only cash and cash equivalents and no other current assets.
There isn’t any precise benchmark for a cash ratio as it follows a conservative approach of using cash and equivalents only to repay its short-term debt and other current obligations.
For example, if your business has a cash ratio of less than 1, it doesn’t mean your company is inefficient in meeting current obligations. You will still have other current assets such as inventory, prepayments, and accounts receivables to meet your current liabilities.
Operating Cash Flow Ratio
This ratio is used to understand the liquidity of your operations to cover the near-term obligations. It uses the cash generated from the operating activities to determine whether it’s sufficient to meet the obligations for the next 12 months.
2. Leverage or Solvency Ratios
The Leverage financial ratios compare the company’s debt with its assets to determine if it’s financially strong to carry on trade for the long term.
To calculate solvency ratios, long-term debt and interest against long-term assets, like equity and earnings are considered.
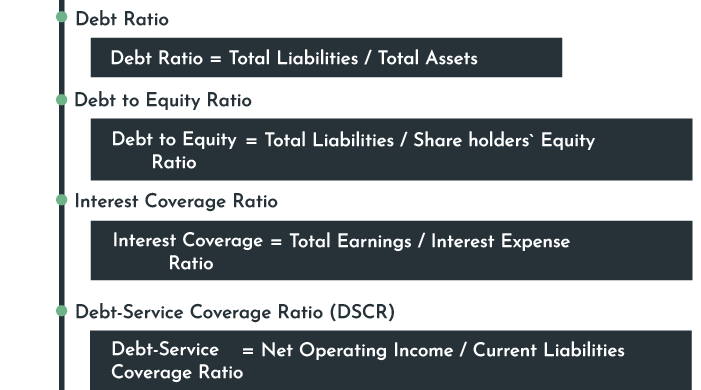
Debt Ratio
The debt ratio measures how much of the total assets are financed by the debt. Debt ratios change from company to company wherein capital-intensive companies may represent a higher debt ratio.
However, a higher debt ratio is unfavorable to your business. It demonstrates that the majority of your assets are financed by the debt.
Debt to Equity Ratio
The debt to equity calculates the debt the company uses for its growth.
A higher debt-to-equity ratio is unfavorable for a business as it indicates the possibility of default. This ratio predicts how the equity capital will cover liabilities at the time of its liquidation.
Interest Coverage Ratio
The interest coverage ratio indicates the margin of safety for a specific period. It is the number of times a company can pay interest on its debts with its current earnings. A ratio of 1.5 or more indicates that the company will have no issues paying interest on its debts.
One uses the company’s earnings before interest and taxes for calculation.
Debt-Service Coverage Ratio (DSCR)
The DSCR demonstrates the business’s financial stamina in closing its debts on time. A high ratio indicates that the business has earned sufficient income to cover the debt obligations due within 12 months.
Here, the net operating income is derived by deducting certain operating expenses from the operating revenue of the business. Also, the current liabilities will include the current portion of the long-term debt (e,.g., interest payable for a long-term loan within 12 months).
3. Profitability Ratios
The Profitability Ratio indicates the company’s capacity to earn profits against the revenue.
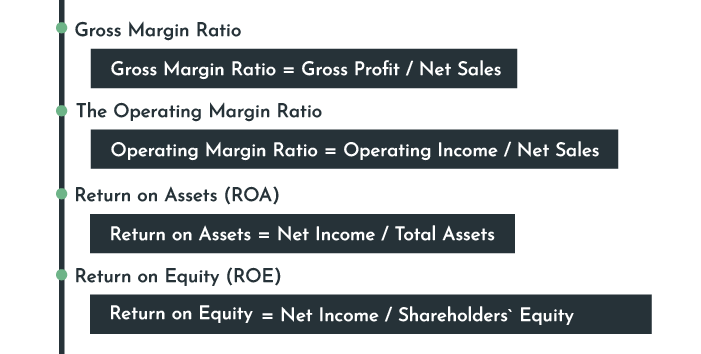
Gross Margin Ratio
The Gross Margin Ratio shows a company’s gross profit as a percentage of its net sales.
A higher gross profit ratio represents that the company’s operations are profitable and your business is efficiently using its resources.
The Operating Margin Ratio
The ratio measures the operating income of a business against its net sales. It’s an excellent indicator of the company’s operational efficiency.
A higher ratio represents that the company is stable and capable of covering its expenses from its primary operations.
Return on Assets (ROA)
ROA measures the profitability of your business in relation to its total assets. It determines whether the capital invested in your company’s assets is generating desired profits for your business. A lower ROA indicates a non-profitable investment in assets.
Return on Equity (ROE)
The ROE measures the return percentage on the amount invested in the business. It indicates the company’s efficiency in making profits using the investors’ money.
4. Efficiency Ratios
These ratios rate the company’s efficiency in using its assets and resources to increase returns from sales.
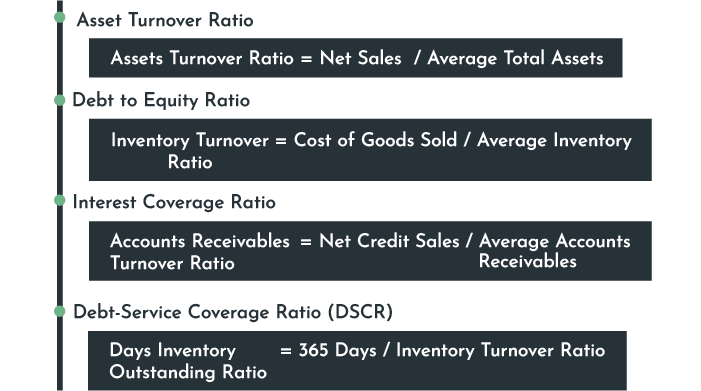
Asset Turnover Ratio
It measures a business’s effectiveness in utilizing its assets to increase sales. A company that uses its resources wisely can effectively grow its sales, and the asset turnover ratio is a measurement to indicate that effectiveness.
A low asset turnover ratio shows inefficient use of assets to produce revenue.
Inventory Turnover Ratio
This ratio indicates the number of times the company uses, sells, or replaces its inventory in a specific timeframe. For example, if an inventory turnover ratio is 10, it means the company can sell its inventory ten times in a given period.
The faster the inventory is sold, the more efficient the company’s sales and operations are. A high inventory turnover ratio is favorable, while a low ratio indicates poor performance in selling its inventory.
Accounts Receivable Turnover Ratio
These ratios show how quickly the company’s customers pay in a specific period.
Days Inventory Outstanding (DIO) Ratio
DIO refers to the average number of days it takes for a business to sell its inventory and convert it into cash. The inventory turnover ratio shows how frequently your inventory gets converted into cash, while the DIO suggests how many days it takes to convert into cash.
A lower DIO is better for your small business as it means you are efficiently selling your inventories without keeping them in the warehouse longer.
5. Market Prospect Ratios
Investors use these ratios to judge the future market rates of stocks and shares depending on their dividend measurements and current earnings.
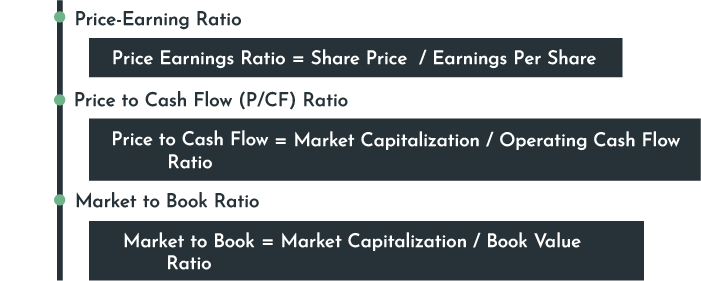
Price-Earning Ratio
It provides insights about the company’s share price against its earnings. In simple terms, the P/E Ratio or the Price Multiple shows how much an investor would be willing to pay per share considering the company’s earnings per dollar.
If your business has a higher P/E ratio, the investors will be ready to pay more amount for the share price of your company because they expect it to grow in the future.
Price to Cash Flow (P/CF) Ratio
The price-to-cash flow ratio is a measure of your company’s current share price to its operating cash flow. It indicates the value of your share related to your operating cash flow.
To calculate the market capitalization, the number of outstanding shares is multiplied by the share price.
A low P/CF ratio represents the stock’s undervaluation; however, in the early stage of your business startup, you may have a higher P/CF ratio. Due to lower cash generation and future growth prospects, you may have a higher P/CF ratio.
Market to Book Ratio
This ratio calculates your company’s current market value to its book value. It’s mainly used for insurance, banking, real estate, and investment trust companies’ valuations.
A higher market-to-book ratio indicates that your company’s stocks have outperformed, while a lower ratio represents undervaluation.
Uses of Ratio Analysis
Investors and shareholders invest in a company with favorable finances. Be it liquidity, solvency, profitability, or efficiency ratio—ratio analysis helps investors and businesses in multiple ways.
- Ratio analysis reveals whether the financial status of a company is sound, weak, or questionable.
- It helps the managerial level make informed decisions by predicting and validating the financial statements.
- To analyze the financial health of your business and how efficiently you are improving your business.
- Encourages creditors to offer extended credit periods to the business.
- Employees eagerly watch ratios to know if the company is doing well with the hope of earning higher salaries.
- The Government assesses the overall strength of the industry through financial ratio analysis.
- Significant variations in ratios help auditors make the necessary inquiries for tax computations.
Conclusion
Interpretation of your ratios will assist you in making the right management decisions. It offers a means to understand the business’s financial health by recognizing its weaknesses and strengths.
Don’t spend longer than necessary calculating your financial ratios. With the Upmetrics business planning software, you can prepare detailed financial statements and calculate required ratios in a jiffy.
Take control of your financial future by leveraging these insights. The better you understand your finances, the better positioned you are for success.