Global ad spending crossed a historic milestone in 2026. That number alone tells you something about where marketing budgets are heading, but it does not tell you where your money should go.
If you are trying to figure out where to put your ad budget right now, or you are writing the market analysis section of a business plan, you need current numbers. Not 2022 data dressed up as 2026.
This guide breaks down spending across digital, social, search, video, mobile, programmatic, and TV advertising. It gives you clear, current numbers to support your strategy and make better decisions about where to invest.
Advertising Industry Statistics (Key Findings)
- Global ad spend is projected to reach $1.30 trillion in 2026, the highest on record.
- The Americas region accounts for $460.5 billion, with the US driving most of that at 5% growth.
- Nearly 7 in 10 ad dollars spent anywhere in the world now go to digital channels. That share was under 50% five years ago.
- Programmatic channels now account for more than 91% of all US digital display ad spending. The human media buyer has moved from execution to oversight.
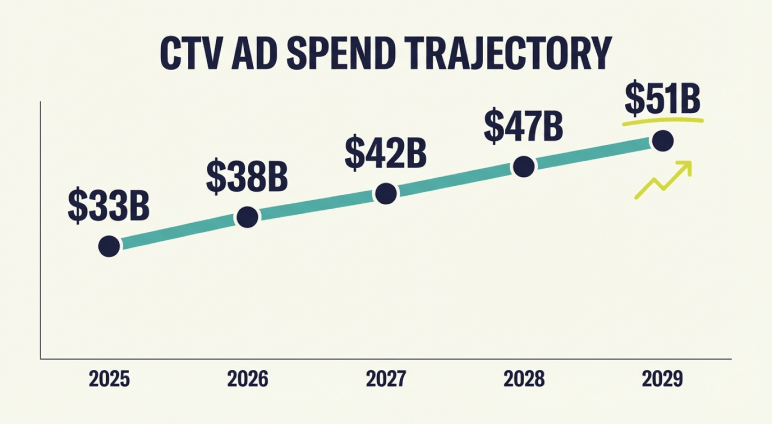
- Connected TV is where the budget fights are happening right now. In 2026, US CTV spend alone is at $38 billion and climbing fast.
- Retail media is the fastest-growing digital ad channel in 2026 at 15.6% year over year.
- US digital video ad spend hit $72 billion in 2025, growing two to three times faster than total media.
- Google, Meta, and Amazon combined will control 62.1% of all US digital ad spend in 2026.
Advertising Industry Statistics: Size and Spend in 2026
The ad industry is bigger than it has ever been. For anyone trying to figure out where to put their budget or what to write in a business plan market analysis, these numbers are the starting point.
- Global ad spend is projected to hit $1.30 trillion in 2026, growing 9.1% year over year. That is double what the industry recorded during the pandemic trough of 2020. (source)
- The Americas region alone accounts for $450.0 billion of Projection in 2026, with the US driving most of it at +6.8% growth. The World Cup and midterm elections are partly behind that bump. (source)
- The US digital ad market alone is projected to reach $413 billion in 2026. Search takes $130 billion of that, social another $108 billion, and the remaining share splits across display, video, and programmatic channels. (source)
- Brazil leads all major markets at +8.3% growth in 2026. No Western market is keeping pace. (source)
| Country | 2025 Spend | 2026 Projection | YoY Growth |
|---|---|---|---|
| United States | $421.1 billion | $450.0 billion | +6.8% |
| China | $200.1 billion | $218.0 billion | +9.0% |
| United Kingdom | $53.0 billion | $58.1 billion | +9.6% |
| Brazil | $24.0 billion | $26.0 billion | +8.3% |
| India | $14.0 billion | $15.0 billion | +7.1% |
Global and US Advertising Statistics
Every year, analysts say digital ad growth will slow down. Every year, the numbers come back higher. Here is what the global picture actually looks like heading into 2026.
- The US digital ad market is projected to reach $413.24 billion in 2026, growing 14.2% annually. (source)
- US ad spend overall is forecast to grow 9.5% in 2026, driven by social media at +14.6%, connected TV at +13.8%, and commerce media at +12.1%. (source)
- Digital accounts for 68.7% of total global ad investment in 2026, up from under 50% five years ago. (source)
- Mobile in-app advertising is projected to hit $425 billion globally in 2026, up from $201 billion in 2022. (source)
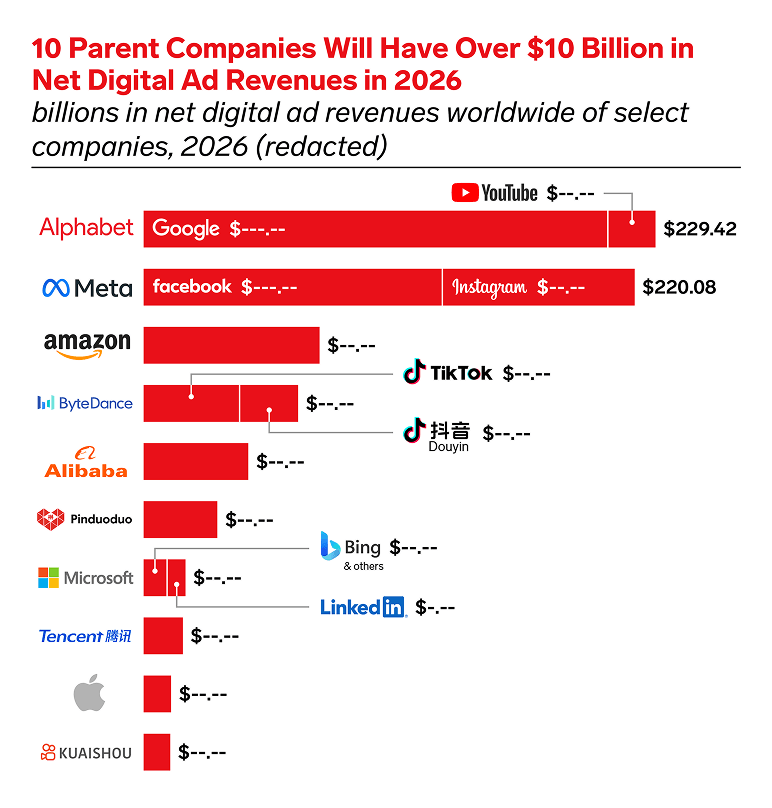
- Google and YouTube combined will bring in $229.42 billion in digital ad revenues in 2026, nearly matching Meta’s Facebook and Instagram total for the first time ever. (source)
- The US accounts for 40% of all global ad spend despite representing just 4% of the world’s population. Advertisers collectively spend more than $1,100 to reach each US consumer annually, seven times the global average. (source)
- Technology is the fastest-growing industry vertical in 2026 at 10.3% growth, driven by AI product launches and connected ecosystem expansion. Finance and retail round out the top three fastest-growing sectors. (source)
Digital Advertising Statistics
Digital advertising statistics have shifted fast over the past five years. More than half of global ad spend is now digital, and the numbers below break down exactly where that money is going and which formats are pulling the strongest returns.
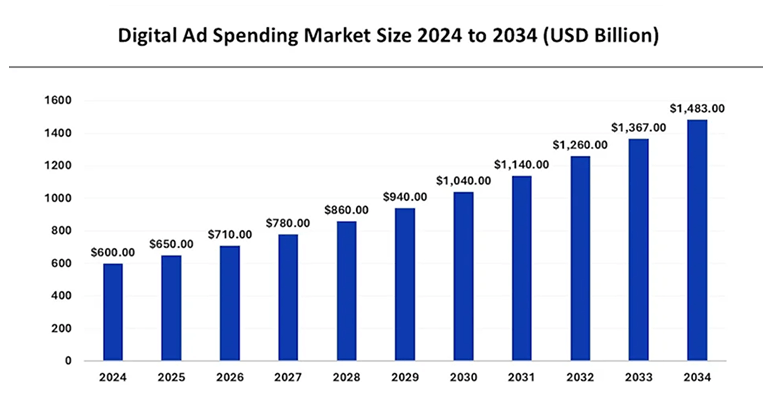
- The global digital ad market hit $650 billion in 2025 and is crossing $710 billion in 2026, running at a 9.47% CAGR through 2034. Ten years ago, the entire global ad market was not that size. (source)
- Google, Meta, and Amazon combined will control 62.1% of all US digital ad spend in 2026. Three companies. Nearly two-thirds of every digital dollar in the world’s largest ad market. Every other platform is dividing what is left. (source)
- Programmatic channels now account for more than 91% of all US digital display ad spend in 2026. Most of that inventory changes hands without a single human making the call. (source)
- Retargeted users are 70% more likely to convert than cold audiences. Retargeting ads also pull 10x higher click-through rates than standard display. Most brands still put the majority of their budget into the format that performs worse. (source)
- North America holds 37.15% of all global digital ad spend. The US alone sits at $171.33 billion in 2025 and is heading toward $440.3 billion by 2035. One country, one third of all the digital ad money on the planet. (source)
- Display ads lift brand recall by up to 80% but average just a 0.05% click-through rate. Most businesses only measure clicks, never the awareness they actually build. (source)
- US programmatic display spending grew 13.6% in 2025, surpassing $180.4 billion. It is expected to exceed $203 billion in 2026, growing another 12.5%. (source)
Search Advertising & PPC Statistics
Most businesses start with search ads and never fully understand what they are getting back. The benchmarks below show exactly what search advertising costs, what it converts to, and where the real returns are hiding by industry.
- 90% of internet users globally have seen a Google ad at some point. Harder to avoid than most people realize. (source)
- Arts and Entertainment leads Google search CTR at 13.10% in 2025. The all-industry average lands at 6.66%. (source)
- The average cost per lead is $70.11 across all industries. Legal hits $131.63. Restaurants come in at $30.27. The range surprises most people seeing it for the first time. (source)
- Google generated $212.4 billion in advertising revenue in the first three quarters of 2025 alone, more than the entire GDP of many countries. No other ad platform comes close. (source)
- Automotive Repair converts at 14.67% on Google Ads, the highest of any industry. Finance and Insurance is at 2.55% on the other end. The all-industry average is 7.52%. (source)
- Average CPC is $5.26 in 2025, the fifth straight year of increases. The same budget buys fewer clicks than it did in 2020. The edge is no longer in the bid; it is in what happens after. (source)
Social Media Advertising Statistics
Social media advertising did not gradually become important. One year it was supplementary, the next it was carrying the whole strategy. Spending has nearly tripled since 2020. Below is where things actually stand right now.
- Global social media ad spend hit $277 billion in 2025, nearly triple what it was five years ago. No other channel has grown at that pace over the same period. (source)
- The average ROI across all social platforms hit $5.28 per $1 spent in 2025. For every dollar put into social advertising, brands are getting back more than five. (source)
- The median CTR for ecommerce brands on Meta hit 2.19% in 2025, with every single category posting year-over-year improvement. Health and Wellness leads all verticals at 2.70%. (source)
- Average CPC on Facebook traffic campaigns in 2025 is $0.70. For lead campaigns, the average CPL is $27.66. Numbers that have held surprisingly steady despite more competition entering the auction. (source)
- Mobile accounts for 98% of all Instagram ad traffic, the highest of any platform. (source)
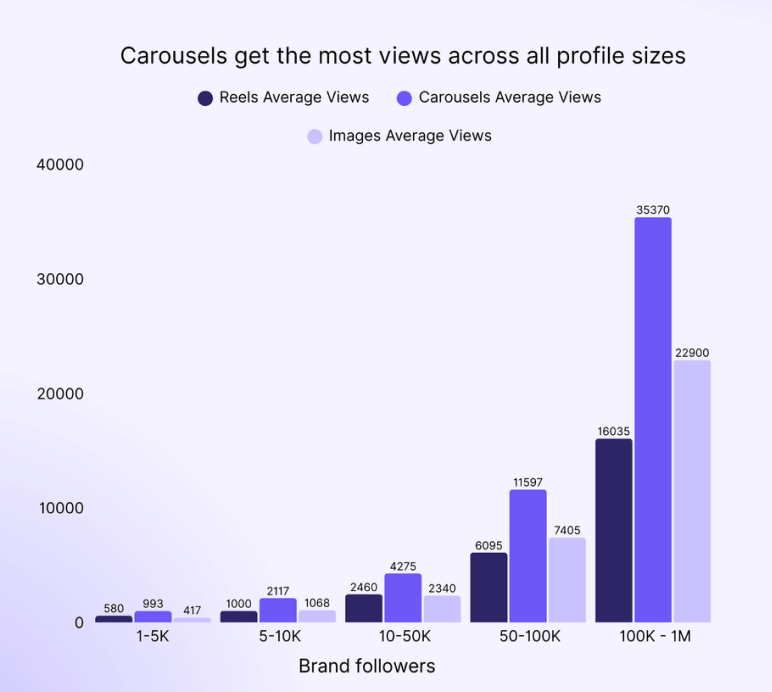
- Carousels are the top-performing format on Instagram in 2026, pulling 35,370 average views for accounts over 100K followers, more than double what Reels get at the same size. The algorithm literally shows them twice. (source)
TikTok
- TikTok ad revenue is projected to hit $43.96 billion in 2026, up from $4 billion in 2021. Cosmetics, technology, fashion, and telecom are the platform’s largest spenders. (source)
- In the US alone, that number hits $14.5 billion, roughly $1 of every $7 spent on US social ads. (source)
- LinkedIn ad CTR averages 0.52% across industries, the lowest of any major platform. (source)
- LinkedIn ad revenue is growing 18.5% year over year to $9.7 billion in 2026, with 75–85% of all B2B leads originating on the platform. Monthly active users are crossing 600 million. (source)
Video Advertising Statistics
Nobody planned for video to eat the entire ad market. It just did.
Thirty seconds of footage is closing deals that display ads have spent years trying to crack. The format matured slowly, then accelerated so fast that most media plans are still catching up to where budgets actually need to be.
- Online video is the second fastest-growing digital channel in 2026 at 11.5%, trailing only retail media and outpacing every other channel, including search, social, and CTV. (source)
- 82% of marketers reported positive ROI from video in 2026, down from 93% the year before. The drop is not a warning sign; teams simply got smarter about measurement. (source)
- 85% of buyers say a video pushed them toward a purchase. Not a review, not a rating. Footage of the thing. (source)
YouTube
- In 2024, YouTube’s ad revenue did not beat Disney, NBCU, Paramount, and WBD combined. In 2025, it did. YouTube hit $40.4 billion. Those four combined managed $37.8 billion. One year was all it took. (source)
- Nielsen’s January 2026 data put YouTube at 12.5% of all US TV viewing. Netflix was at 8.8%. YouTube is not competing with streaming anymore; it is leading it. (source)
- YouTube Shorts hit 200 billion daily views in 2025. (source)
| Format | Best For | Key Stat |
|---|---|---|
| Short-form social | Product discovery, awareness | 49% of marketers rank #1 content ROI |
| Long-form YouTube pre-roll | Consideration, demos | $40.4 billion revenue beat TV studios |
| YouTube Shorts | Mobile Gen Z reach | 200 billion daily views 2025 |
| US Digital Video | Full-funnel | $72 billion spent, 2-3x media growth |
Mobile Advertising Statistics
At some point, the “mobile vs desktop” conversation stopped being a debate. Mobile won. The only question now is how much of your budget is actually built around that reality. Here are the stats that put it in perspective.
- $262.84 billion went into mobile advertising globally in 2025. That number hits $322.67 billion in 2026, with North America holding the biggest regional slice at 33.2%. (source)
- 96% of all internet users worldwide go online via mobile phones. Only 59.6% of internet users aged 16 and above use a laptop or desktop. The device your ad appears on is almost certainly a phone. (source)
- App usage hit 5.3 trillion hours globally in 2025. That is not time spent browsing, that is time locked inside apps, where mobile ads live and where avoidance is harder. (source)
- US digital ad spend hit $137 billion in 2025 across mobile, desktop, and OTT combined, up 12% year over year, with total impressions reaching 16.3 trillion. (source)
- The average mobile eCommerce conversion rate is 1.82%, but the range is wide. Personal care converts at 4.22% on mobile, while auto parts sit at just 0.88%. Your industry benchmark matters more than the overall average. (source)
TV & Streaming Advertising Statistics
Between linear TV and streaming, the television advertising category is larger than search, larger than social, and still growing. The way money moves through it has changed, though. Here is the 2026 breakdown.
- Linear TV ad spend is dropping more than 11% in 2026 to $139.1 billion globally. It held 41.3% of global ad spending in 2013. Today, that share is 12.4%. The decline has been consistent, not sudden. (source)
- US CTV ad spend hit $33.35 billion in 2025 and is heading toward $38 billion in 2026, 14% year-over-year growth in a market where most channels are growing at 5-7%. (source)
- Streaming captured 47.3% of all US TV viewing time in mid-2025, according to Nielsen data. (source)
- Netflix’s ad revenue crossed $1.5 billion in 2025 and is expected to double in 2026. (source)
- 57% of new streaming subscriber additions in Q1 2025 chose ad-supported plans. Less than two years ago, that number was below 30%. The audience is self-selecting into ad-supported tiers faster than the platforms expected. (source)
- Nine streaming services will generate over $1 billion in ad revenue in 2026. In 2020, only two did. (source)
| Metric | 2025 | 2026 | Growth |
|---|---|---|---|
| US CTV Ad Spend | $33.35 billion | $38 billion | +14% |
| Linear TV Global Share | 12.4% | Declining | -11% YoY |
| Streaming Share of US TV Viewing | 47.3% | Growing | Record high |
| Retail Media on CTV | $4.99 billion | Growing | 2x by 2028 |
Traditional Advertising Statistics
Traditional advertising did not die. It just stopped growing and, in some cases, got genuinely better at converting.
- Digital newspaper ads crossed $5 billion in 2025, overtaking print for the first time in the US. Print fell to $4.9 billion the same year. (source)
- About a third of the newspapers that were printing in 2005 are gone now. The survivors went local, leaner, and mostly digital to stay alive. (source)
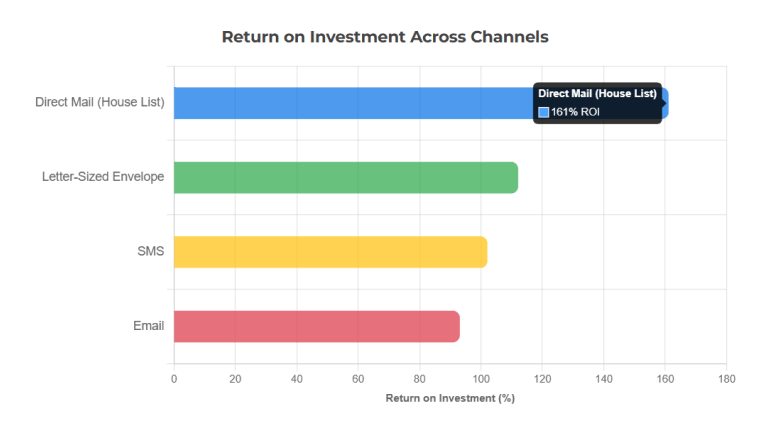
- Direct mail delivered 161% ROI in 2025, the highest of any paid marketing channel. (source)
- 85% of Gen Z and Millennials still open physical mail. 72% said they would genuinely miss it. That one caught researchers off guard. (source)
- $6.98 billion in US OOH revenue through Q3 2025, eighteen quarters of growth in a row with no sign of stopping. (source)
- Digital OOH is growing 14.5% while static formats sit at 1.5%. The billboard is not dying, it is getting a screen. (source)
- OOH returns $7.58 per dollar invested, above the $5.52 cross media average. The ROI has always been there; the measurement tools just finally caught up. (source)
Advertising Agency and Publisher Statistics
The agency business in the US has never had more players or more money moving through it. Here is what the data shows.
- Over 105,000 advertising agency businesses are now operating across the US, up from 86,814 just four years ago, and the count keeps climbing. (source)
- Retail and e-commerce clients bring in 19.75% of total US agency billings in 2025, with technology and telecom close behind and both growing fast. (source)
- The US marketing agency is sitting at $192.45 billion in 2026. By 2031, that number hits $251 billion. (source)
- WPP committed $400 million over five years to embed Google’s Gemini and Veo tools across its entire agency network. Gemini handles AI-assisted creative and planning. Veo generates video at scale. 85% of all client-facing staff, 69,000 people, are already using both monthly. (source)
- Worldwide ad spending grew 8.6% in 2025, but holding company revenues fell 1.2% over the same period. More money moved through the industry while less of it went to agencies. (source)
- 66% of major brands now run their own in-house agency, with another 21% actively building one. (source)
AI in Advertising Statistics
AI in advertising is not a future prediction anymore. The tools are live, the budgets are shifting, and the people running marketing have already made up their minds about where this is going.
- Five of the six top areas of increased advertiser focus in 2026 are now directly tied to AI. The industry moved from experimentation to infrastructure in under two years. (source)
- Nearly every CMO surveyed now uses AI in their personal workflows. Over 30% use it daily. The debate is no longer whether to adopt it. It is how fast to move and what to hand over. (source)
- 86% of advertisers are already using or planning to use generative AI for video ad creation. (source)
- 87% of CMOs believe the future of marketing will demand greater creativity, empathy, and cultural understanding — not less. AI is accelerating output, but the people running the strategy still matter. (source)
- Only 6% of marketers have fully implemented AI in their workflows despite 80% feeling pressure from leadership to adopt it. The gap between mandate and execution is where most budgets are currently stuck. (source)
Advertising ROI Benchmarks by Channel
Business owners always ask: which ad channel truly delivers ROI?
This benchmark table pits top channels against each other—averages, best uses, entry budgets, and difficulty levels.
Arm your strategy with data that cuts through the noise.
| Channel | Avg ROI | Best For | Start Budget / Month | Difficulty |
|---|---|---|---|---|
| Email Marketing | $42 per $1 (4,200%) | Customer retention, nurture | $0-$100/mo tool cost | Low |
| Google Search Ads | $8 per $1 (Google data) | High-intent buyers | $500+ | Medium |
| PPC (general) | $2 per $1 (avg) | Direct response | $500+ | Medium |
| Facebook/Meta Ads | Highest self-reported paid social ROI | B2C awareness & conversion | $300+ | Medium |
| Influencer Marketing | $5.78 per $1 avg (up to $20) | Brand awareness, Gen Z/millennial | $1,000+ per campaign | Medium |
| Podcast Advertising | ~$4.9 per $1 | Brand trust, targeted niches | $1,500+ per campaign | Low-Medium |
| SEO (organic) | $5+ per $1 (conservative) | Long-term traffic | $500+ agency or tools | High |
| Display/Programmatic | Lower direct ROI + 80% brand awareness lift | Retargeting, brand recall | $300+ | Low-Medium |
What These Advertising Statistics Mean for Your Business Plan
Use the global spend figures in your market analysis, and the ROI benchmarks in your marketing strategy section. Both make your business plan more credible and easier to defend in front of investors or partners.
Conclusion
The hardest part of advertising in 2026 is not finding channels to spend on. There are more than ever. The hard part is knowing which ones are worth it for your specific business.
That is what this data is for. Not to overwhelm, but to narrow things down.
Start with the channels showing the strongest returns in your industry. Set a benchmark. Run the numbers. The brands getting the most out of their ad budgets are not the ones spending the most — they are the ones who did the homework first.
Frequently Asked Questions
How big is the advertising industry in 2026?
What are the types of online advertising?
How much should a small business spend on advertising?
Does advertising actually work?
What is the fastest-growing advertising channel in 2026?

Riya Shah
Riya Shah is a skilled content writer experienced in various areas of writing, currently working with Upmetrics. Fascination with reading led her to be a writer. Highly creative, focused, imaginative, and passionate. Read more