The events industry is already past the trillion-dollar mark, and most of the event industry statistics out there point in the same direction. It does not look like it is slowing down anytime soon.
If you have been looking into this space before starting a business, you have probably run into a common problem. The numbers are scattered, outdated, or missing the context that actually makes them useful.
So this page is meant to fix that. We have pulled together 80+ current statistics for 2026 covering market size, growth, event formats, budgets, and technology, with one goal: to help you understand what the data actually says about the industry and whether it makes sense to enter it right now.
Event industry statistics (Key findings)
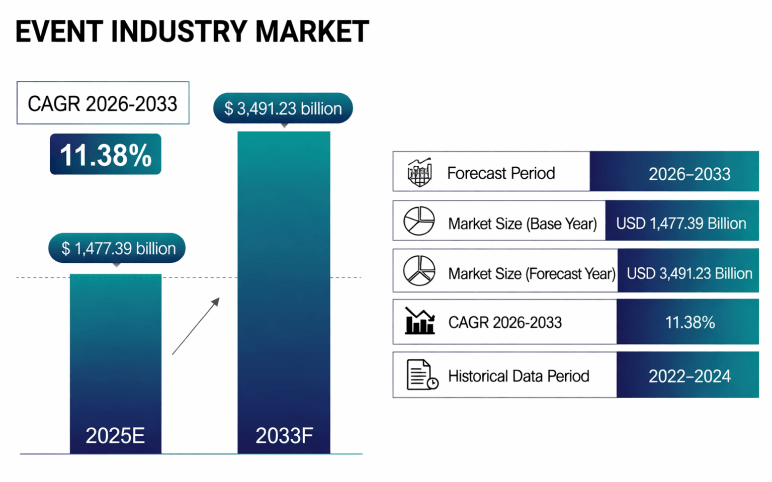
- The global events industry is valued at $1.47 trillion in 2025 and is projected to reach $3.49 trillion by 2033
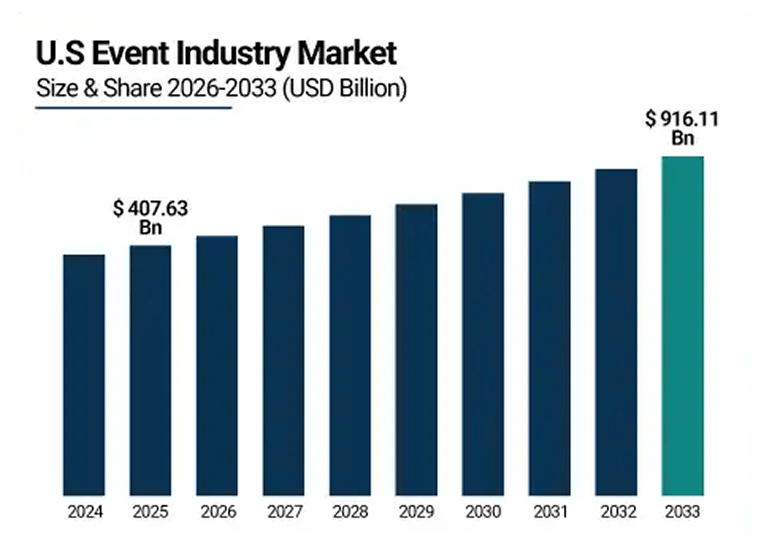
- The US events market alone is expected to nearly double from $407 billion to $916 billion by 2033
- Corporate events hold the largest market share at 38.76% of total global event activity
- 78% of organizers say in-person events are their single most impactful marketing channel
- Virtual events are growing at a 22.7% CAGR, the fastest of any event format
- 95% of event teams expect AI usage to increase in 2026, but only 16% are seeing significant results
- 58% of planners expect event costs to rise 5 to 14% in 2026
- Event budgets saw the largest increase of any marketing category in Q3 2025 at 10.9%
- 40% of organizers still struggle to prove event ROI, down from 70% in 2025
- US event planners held 155,800 jobs in 2024, the highest recorded employment level for the profession
- 83% of corporate organizers now factor sustainability into their event planning decisions
- The event management software market is projected to grow from $11.52 billion in 2025 to $36.42 billion by 2035. That’s more than a 3x increase in a decade.
Global event industry market size & growth projections
Crossing the trillion-dollar mark was one thing. Staying on this growth curve is another story entirely.
What’s worth noticing is that firms measuring this market don’t always agree on the exact numbers. But they all agree on the direction.
That kind of consensus across independent research is harder to dismiss than any single report. When analysts using different methodologies keep landing in the same place, that’s not noise. That’s a signal.
Current market size and growth
- One estimate puts the global events industry at $1.47 trillion in 2025, with growth projected all the way to $3.49 trillion by 2033. That’s a CAGR of 11.38% if it plays out. (Source)
- The global events industry is projected to grow from $1.47 trillion in 2025 to $2.43 trillion by 2035 at a CAGR of 5.10%, making it one of the most consistently tracked growth markets across independent research firms. (Source)
- A separate report starts slightly higher at $1.57 trillion for 2025, landing at $3.4 trillion by 2033 at a 10.1% CAGR. (Source)
- For a shorter view, one projection estimates the industry adds $1.07 trillion in total between 2025 and 2029 alone, at around 13.5% CAGR. (Source)
Event Industry Market Size Projections — Multiple Sources
| Research Firm | 2025 Value | Projected Value | Year | CAGR |
| SNS Insider | $1.47T | $3.49T | 2033 | 11.38% |
| SkyQuest | $1.57T | $3.40T | 2033 | 10.1% |
| Expert Market Research | $1.47T | $2.43T | 2035 | 5.10% |
| Technavio | — | +$1.06T growth | 2029 | 13.5% |
For a business plan where you want defensible, conservative numbers, use the Expert Market Research projection at $2.43 trillion by 2035 at a 5.10% CAGR. It’s the lowest estimate in the table, which makes it the hardest for an investor or lender to push back on.
If you’re putting together a pitch deck and want to lead with the market opportunity, the SNS Insider or SkyQuest figures at $3.4 to $3.49 trillion by 2033 give you a stronger growth story while still being backed by credible independent research. Either way, cite two sources rather than one. That single habit removes a question investors almost always ask.
US market
- The US events market is expected to climb from $407.63 billion in 2025 to $916.11 billion by 2033, at a CAGR of around 10.68%. (Source)
- Corporate events in the US cross 1 million annually and support over 400,000 jobs. (Source)
Corporate events segment
- Corporate events held the largest share of the global market at 38.76% in 2025. (Source)
- Corporate organizers make up 51.44% of all event organizers worldwide. (Source)
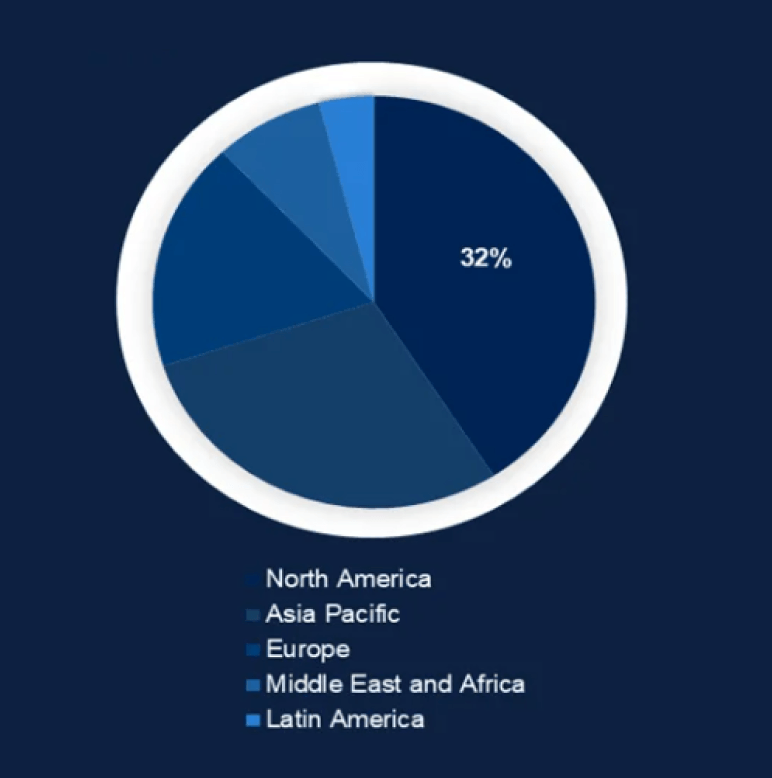
Regional breakdown
- North America accounts for roughly 32% of global event activity, driven mostly by conferences and corporate events. (Source)
- Europe follows, with Germany and the UK leading in exhibitions and large-scale conferences.
- Asia-Pacific is outpacing every other region in growth rate, backed by rising corporate spending and an increasing number of large-scale events. (Source)
In-person event statistics (2026)
In-person events aren’t just back. For 78% of organizers, they’re the single most impactful marketing channel they have. That’s not a post-pandemic relief stat. That’s a vote of confidence backed by real budget decisions.
The demand from attendees is just as clear. People aren’t showing up out of habit. They’re actively choosing to be there.
Attendance and sentiment
- 97.4% of event professionals rate in-person events as either very important or moderately important to their strategy in 2026, up from 95.4% in 2025. (Source)
- 78% of organizers say in-person events are their organization’s most impactful marketing channel. (Source)
- 54% of attendees say they plan to attend more in-person events compared to last year. (Source)
Costs and expenses
Costs are the part nobody loves talking about, but if you’re starting an event business in the US, this is where your margins live or die.
- The cost per meeting attendee per day is rising 4.3% to $169, driven by food, beverage, venue, and labor increases across the US. (Source)
- 82% of meeting professionals expect event expenses to increase further due to tariffs and shifting trade policies. (Source)
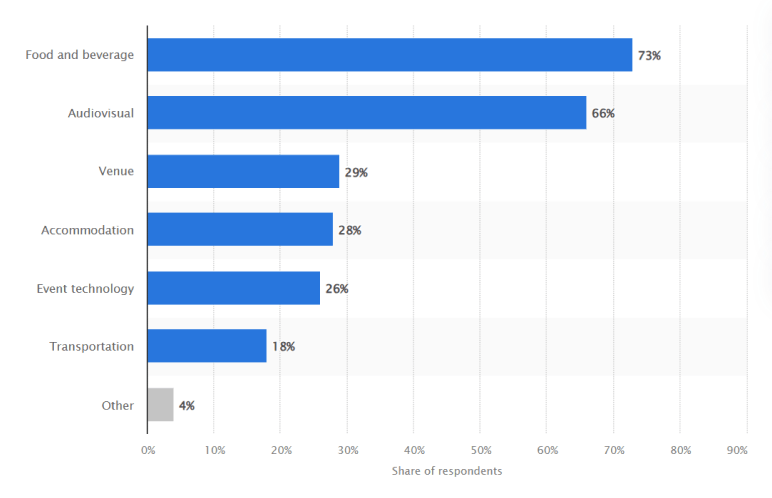
- Food and beverage alone represent 40 to 50% of total event costs at most US venues. (Source)
Top event expense categories (Source)
Virtual event statistics
Virtual events crossed $235.4 billion in 2025. And depending on which analyst you ask, they could hit anywhere from $650.67 billion to over a trillion by the early 2030s. That kind of range is not a red flag. It’s just what happens when a market grows faster than anyone expected.
For anyone building an event business, this segment is worth understanding. Not every client wants a room. Some want to reach.
Virtual event market size
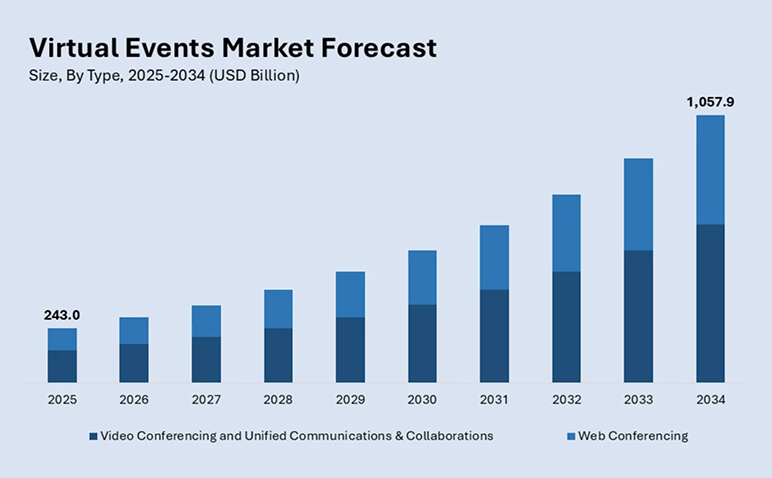
- One report tracks the market from $235.4 billion in 2025 all the way to $650.67 billion by 2030. That’s a 22.7% CAGR, which is fast by any measure. (Source)
- Zoom out further, and IMARC Group puts 2025 at $243 billion, with a path to $1.057 trillion by 2034 at 17.8% CAGR. (Source)
- In terms of geography, North America is sitting on more than 40.12% of the global share right now, mostly because corporate adoption there moved faster than anywhere else. (Source)
Who is using virtual events?
- Webinars generated 45.75% of the total virtual events market revenue in 2025. (Source)
- Corporate enterprises made up 41.52% of all virtual event demand in 2025, the largest end-user group. (Source)
- Conferences and summits accounted for 42.64% of all virtual event spending in 2025. (Source)
Webinars as a business tool
- Webinars sit at the center of this growth, and the numbers are worth a closer look if you’re building a service around virtual formats.
- 52% of B2B marketers say speaking events and webinars are among their top three most effective channels for thought leadership distribution. (Source)
Hybrid event statistics
Hybrid events are no longer the default format. But that doesn’t mean they’re fading out either. The data points to something more nuanced than either extreme.
Most planners have settled into a realistic view of hybrid. It works well in specific situations. It doesn’t work as a one-size-fits-all solution.
What the numbers actually show:
- In North America, only 15% of events are expected to take place in a hybrid format, which puts the actual adoption well below the enthusiasm around it. (Source)
- Six out of ten professional associations expect hybrid and virtual events to remain a major part of their annual calendar. (Source)
- 54% of people who joined a hybrid meeting virtually said they had fewer opportunities to build rapport with other participants, compared to those who attended in person. (Source)
- 65% of in-person hybrid participants said they naturally engage more with people sitting in the same room, which creates a two-tier experience that many organizers underestimate. (Source)
- The hybrid events segment is growing as part of the broader events market, with hybrid format adoption increasing 61% year over year, driven by the flexibility it offers organizations with distributed teams and global audiences. (Source)
- 68% of meeting professionals now include virtual and hybrid meetings within their overall event programs, showing the format has moved from experimental to standard operating practice. (Source)
Event marketing statistics
77% of marketers say events are their most effective marketing channel. Think about what that means if you’re starting an event business. The people hiring you already believe in what you do.
The data isn’t just about big enterprise brands either. The demand runs across company sizes, and budgets are moving to match it.
Why marketers keep investing in events
- 77% of marketers say events are the most impactful channel in their entire marketing mix. (Source)
- 90% say events help their company stand out from the competition, and 89% say events are critical for business growth. (Source)
- 85% of in-person event participants say they are more likely to make a purchase after attending a live event. (Source)
- 60% of companies say physical events are the most effective way to generate revenue, ranking them above every other marketing format. (Source)
Budget trends
- 33% of B2B marketers plan to increase investment in events and experiential marketing in 2026, the second-highest budget priority after AI tools. (Source)
- Events and trade shows account for 31.6% of total marketing budgets on average, making them the single largest channel allocation across B2B organizations. (Source)
- Event budgets saw the most significant increase of any marketing category in Q3 2025, with a net balance of +10.9% of companies raising event spend, making it the top-growing channel ahead of digital and paid media. (Source)
What attendees actually respond to
- 95% of attendees say they trust a brand more after participating in an in-person event, while 71% of brands saw a reputation decline through other channels in the same period. (Source)
- 87% of working professionals visited a brand’s website and expressed a desire to engage further after attending one of their live events. (Source)
Event technology & AI statistics
95% of event teams expect their AI usage to increase in 2026. But ask how many are actually seeing meaningful results, and the number drops fast. That gap between intention and impact is where smart early-stage businesses can get ahead right now.
The tools are improving quickly. The planners who learn them now won’t just save time. They’ll deliver things their competitors can’t.
The event management software market
The software side of this industry is growing almost as fast as events themselves. A few numbers put it in perspective.
- One estimate puts the event management software market at $11.52 billion in 2025, with projections stretching to $36.42 billion by 2035 at a 12.2% CAGR. (Source)
- North America sits at roughly 32% of that global usage right now, mostly because corporate event volume here is higher than anywhere else. (Source)
- By 2035, cloud-based tools are expected to hold 70% of the total market share as on-premise setups quietly get phased out. (Source)
AI adoption among event teams
- 95% of event professionals expect their organization’s use of AI in events to increase in 2026. (Source)
- 91% of business events professionals now use AI in some form, though most are still in early or developing stages. (Source)
- Most planners are using AI for content and marketing rather than core planning workflows, a pattern Soundings flagged as a missed opportunity in their September 2025 report. (Source)
AI adoption in events
| AI Use Case | % of Event Professionals Using |
|---|---|
| Data analytics and reporting | 20% |
| Personalization and attendee experience | 18% |
| Content creation | 15% |
- 55% of AI adopters in the events industry are small businesses with 1 to 50 employees, showing that AI adoption isn’t just an enterprise story. (Source)
Technology integration and software decisions
- 65% of event professionals are currently using generative AI in their work, but only 16% say they are seeing significant improvements in outcomes so far. (Source)
- 66% of event professionals say AI allows them to spend more time on high-value strategic work rather than administrative tasks. (Source)
- 89% of businesses using event technology say it saves them around 200 hours per year. (Source)
Event budgets, costs & spending statistics
58% of planners expect event costs to rise 5 to 14% in 2026. If you’re pricing your services right now for events six months out, that gap will come straight out of your margin.
The good news is budgets are moving up, too. The challenge is they’re not always moving fast enough to keep pace with costs.
What planners are expecting in 2026
- 58% of event professionals expect costs to rise 5 to 14% in 2026, while 64% say their budgets are increasing by a similar margin to keep pace. (Source)
- 71% of meeting professionals expect their costs to increase in the year ahead, with 6% anticipating increases of 11% or more. (Source)
- 90% of planners cite potential cost increases as their main concern right now, while 82% specifically expect costs to rise because of tariffs and trade policy shifts. (Source)
- 43% of planners report a budget increase of 10% or more, while 39% say budgets are staying flat. (Source)
Where the biggest pressure points are
- Travel and lodging costs are flagged by 78% of planners as a rising pinch point, followed by F&B at 69%, higher room rates at 63%, and less flexible contract terms at 50%. (Source)
- Food and beverage accounts for 29.9% of total conference spend, audiovisual production takes 15%, and housing comes in at 11%, making these three categories responsible for more than half of every conference dollar spent (Source)
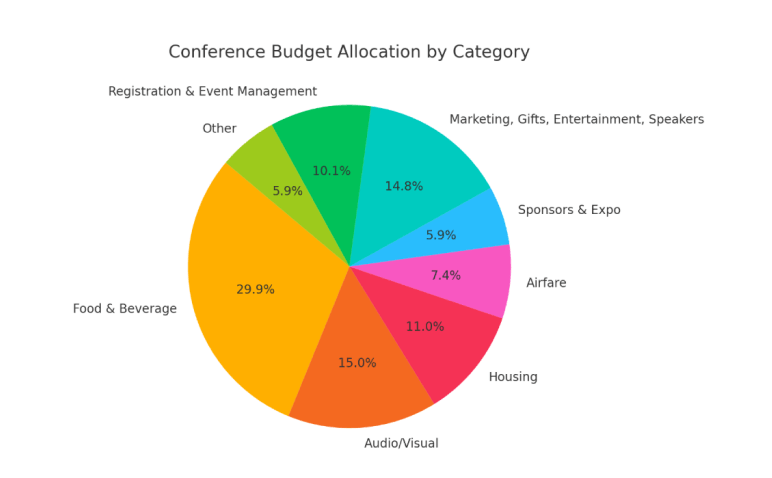
- The typical US conference budget sits at approximately $1.89 million for an average of 601 attendees, putting per-person spend at around $3,144. (Source)
| Cost Pressure Area | % of Planners Citing as Rising |
|---|---|
| Travel and Lodging | 78% |
| Food and Beverage | 69% |
| Hotel Room Rates | 63% |
| Contract Flexibility | 50% |
Event ROI & measurement statistics
40% of organizers still struggle to prove event ROI in 2026. That sounds like a problem. But here’s the context that makes it interesting: that number was 70% just a year ago.
Progress is real. The gap is closing. And for a new event business, understanding ROI isn’t just about reporting to clients. It’s about justifying your own value.
Where things stand in 2026
- 40% of organizers report difficulty proving event ROI in 2026, down from 70% in 2025, as more teams connect event data directly to CRM and revenue systems. (Source)
- 93.5% of organizers still measure success by attendee satisfaction scores, while fewer than 30% actually measure financial ROI. (Source)
- Within 24 hours of leaving a conference, attendees forget up to 70% of what they heard. Within a week, that figure climbs to 90%. (Source)
What leadership actually looks at
- 75% of event teams now have their event management system integrated with CRM or marketing automation platforms, up from previous years. (Source)
- Leadership teams now evaluate events on pipeline influence, deal velocity, and customer retention, not just attendance and satisfaction scores. (Source)
ROI benchmarks by event type
- The average ROI for events across formats sits between 25% and 34%, though this varies significantly depending on attendance rate, sponsorship revenue, and brand awareness goals. (Source)
- Only 15% of organizers rate their networking experiences as very effective, despite networking being one of the top reasons attendees show up, pointing to a measurable gap between experience design and outcome delivery. (Source)
What sponsors and leadership actually measure
- Sponsors expect qualified conversations supported by credible data. Leadership teams look for evidence that networking translates into pipeline and long-term relationship growth. (Source)
- Key ROI metrics that matter most to sponsors include cost per interaction, demographic reach, brand awareness lift, and purchase intent changes, not just attendance numbers. (Source)
Event planning employment & career statistics
The US event planning profession hit 155,800 jobs in 2024, its highest recorded employment level according to BLS data.
For anyone thinking about starting a business in this space, that number matters. A growing industry needs more planners, and right now demand is outpacing supply in several markets.
Employment and salary
- Event planners held approximately 155,800 jobs in the US in 2024, the highest recorded employment level for the profession. (Source)
- The average event planner hourly rate in the US sits at $16.07, but top-paying markets like California ($20.83/hr), the Washington DC metro area ($18.50/hr), and Massachusetts ($17.85/hr) push well above that national average. (Source)
- For those starting out independently, hourly rates vary significantly by state and event type, meaning location and specialization are two of the biggest levers you have on your own earning potential. (Source)
- The median annual wage for meeting, convention, and event planners was $59,440 in May 2024. (Source)
Job growth outlook
- Employment in this field is projected to grow 5% from 2024 to 2034, faster than the average across all US occupations. (Source)
- Around 15,500 job openings are expected each year over the decade, driven by both industry growth and natural turnover as experienced planners retire. (Source)
Event sustainability statistics
Event planners now consider sustainability when planning events. That’s not a niche concern anymore. It’s a baseline expectation, and corporate clients are the ones driving it hardest.
For a new event business, this is less of a trend to follow and more of a box you need to check before certain clients will even consider you.
- 83% of planners now weigh sustainability when making event decisions, and it’s showing up in the most practical places: which venue they pick, what gets served, and which suppliers make the shortlist. (Source)
- CSR and giveback activities were included in 42% of all corporate programs surveyed, while recycled materials for signage and badges appeared in 39% of events, showing sustainability moving from policy into actual execution. (Source)
- Switching from in-person to virtual conferencing reduces the carbon footprint of an event by up to 94%, with energy use dropping by 90%, according to research published in Nature Communications. (Source)
Attendee preferences and corporate mandates
- More than 70% of attendees say environmental practices influence whether they choose to attend an event, making sustainability a direct driver of attendance numbers. (Source)
- Attendee travel accounts for 70 to 80% of an event’s total carbon footprint, making destination and venue selection the single most impactful sustainability decision a planner makes. (Source)
Cost implications and waste benchmarks
- Events with strong sustainability plans saved an average of 20 to 30% in operating costs through reusable materials, efficient energy systems, and local sourcing. (Source)
- Zero-waste event strategies can divert 80 to 90% of materials from landfills through recycling, composting, and reusable assets, while also cutting disposal costs significantly. (Source)
What these stats mean if you’re starting an event business
The numbers paint a clear picture. The event industry is growing, in-person demand is strong, and there’s genuine room for new players. But data without context is just noise.
Here’s what the research actually means for someone building a business from scratch.
1. The market timing is good
The global events industry is sitting at $1.47 trillion in 2025 and heading toward $3.49 trillion by 2033. That kind of sustained growth doesn’t happen in a market that’s running out of room.
New businesses that enter during an expansion phase have an easier time finding clients, building referrals, and establishing rates than those that enter during a contraction. Right now, the market is expanding.
2. In-person is still the bread and butter
78% of organizers call in-person events their most impactful marketing channel. Attendees are choosing to show up, and clients are backing that with real budget increases.
If you’re deciding where to focus first, in-person events are the most proven revenue stream in this industry. Virtual and hybrid can come later once you have the fundamentals down.
3. Specialization pays more than generalism
Corporate events hold 38.76% of the global market. Webinars and virtual formats are growing at 22.7% CAGR. Sustainability-focused events are becoming a client requirement, not a differentiator.
Pick a niche based on where demand is strongest in your local market, and build your entire brand around serving that niche well. A specialist who owns one category always charges more than a generalist who does everything.
4. Budget for rising costs before you price anything
58% of planners expect costs to rise 5 to 14% in 2026. Food and beverage, venue fees, and AV production are all climbing.
Here’s what that looks like in real numbers. Say you quote a client $15,000 for a corporate dinner event today. Your vendor costs sit at $11,000, giving you a $4,000 margin. If costs rise 10% by the time the event runs six months from now, your vendor bill climbs to $12,100. That $1,100 increase comes directly out of your margin, dropping it from $4,000 to $2,900. That’s a 27% margin hit on a contract you’ve already signed.
The fix is simple, but most new planners skip it. Build a 10 to 15% cost buffer into every proposal before it goes out. On that same $15,000 event, pricing your services at $16,500 instead protects your margin even if costs run higher than expected.
If you price a contract today for an event six months from now at today’s vendor rates, you’ll absorb the difference. The client won’t. You will.
5. Technology is your competitive edge early on
64% of planners are already switching software vendors, which means the tools market is still unsettled. Getting onto the right platform early, one that handles registration, payments, and post-event reporting cleanly, puts you ahead of competitors still working out of spreadsheets.
You don’t need the most expensive stack. You need one that works and that you can demonstrate to clients.
6. Sustainability is becoming a client requirement
Sustainability has moved from “important” to “non-negotiable” and is now explicitly built into venue selection, catering, and supplier choices.
Including a clear sustainability section in your business plan and your client proposals signals that you understand how corporate procurement decisions are made.
7. Prove ROI from the very first event
40% of organizers still struggle to measure ROI. That’s not a client problem you observe from a distance. It’s a service gap you can fill.
How to use event industry data in your business plan
Industry statistics aren’t just interesting. They’re what make your business plan credible. A plan without market data is just a list of intentions. A plan with the right numbers behind it tells investors and lenders that you’ve done the work.
Here’s exactly where to put the data you’ve gathered from this article.
Executive summary
This is the first thing anyone reads, and the section most people write last. It needs one strong market stat that proves the opportunity exists.
Something like: “The US events market is projected to grow from $407 billion in 2025 to $916 billion by 2033, and corporate events already account for 38.76% of global market share.” That single sentence tells a reader the market is large, growing, and dominated by the segment you’re targeting.
One stat. First paragraph. Done.
Market analysis
This is where most of the numbers from this article belong. Use the market size projections table to show overall industry growth. Add the regional breakdown to narrow it down to your geography. Then layer in the in-person demand stats to show where the real opportunity sits right now.
The goal is to take a reader from “here’s the global picture” down to “here’s why this specific market, in this specific format, makes sense to enter today.”
Financial projections
Statistics help you justify your assumptions here. If you’re projecting a 15% price increase in year two, point to the 58% of planners expecting cost increases of 5 to 14% as context. If you’re modeling attendee growth, reference the 54% of attendees planning to attend more events.
Numbers you make up get questioned. Numbers you borrow from credible research get accepted.
Competitive analysis
Use the employment and salary data from the BLS to show the size of the professional market you’re entering. The fact that 64% of planners are switching software vendors tells investors the industry is still maturing and consolidating. That’s a gap, not a threat.
Conclusion
The data in this article points in one direction. The events industry is growing, budgets are increasing, and in-person demand is stronger than it has been in years.
A few things stand out above everything else.
The market is expanding at a pace that creates real room for new businesses. In-person events remain the most trusted and highest-converting format available to marketers. Technology is reshaping how events are planned and measured, and the planners who adopt it early will have a genuine edge. And the gap in ROI measurement means there’s a clear service opportunity for anyone willing to show clients the numbers.
None of this guarantees success. But it does mean the conditions are favorable.
If you’re ready to take the next step, start with a solid foundation. The Upmetrics event planning business plan template gives you a structure to plug this data straight into. And if you’re still mapping out your path, the guide on how to start an event planning business is the right place to begin.
The Quickest Way to turn a Business Idea into a Business Plan
Fill-in-the-blanks and automatic financials make it easy.
Frequently Asked Questions
How big is the event planning industry in 2026?
What is the projected growth rate of the events industry?
What percentage of events are in-person vs. virtual in 2026?
How much do companies spend on events?
Is event planning a good business to start in 2026?

Kruti Shah
Kruti is a passionate and skilled writer with a knack for business management. She loves to talk and write about small business, startups, business growth, and planning. Besides writing, she loves to read and explore the world. Read more