Halfway through 2026, the financial advisory industry is showing clear signs of change across demand, client expectations, and service delivery.
More people need help with retirement, investing, taxes, wealth transfer, and long-term financial decisions. At the same time, advisory firms are using more digital tools, changing fee models, dealing with advisor shortages, and serving younger clients who expect both human advice and strong digital tools.
These changes make the industry hard to understand from headlines alone. Market size, advisor jobs, client behavior, income trends, fees, and technology all show a different part of the picture.
So, we’ve compiled 60+ financial advisor statistics for 2026 across market growth, advisor demographics, income, client trends, fees, technology, shortage of advisors, and future outlook.
Top 10 financial advisor statistics at a glance
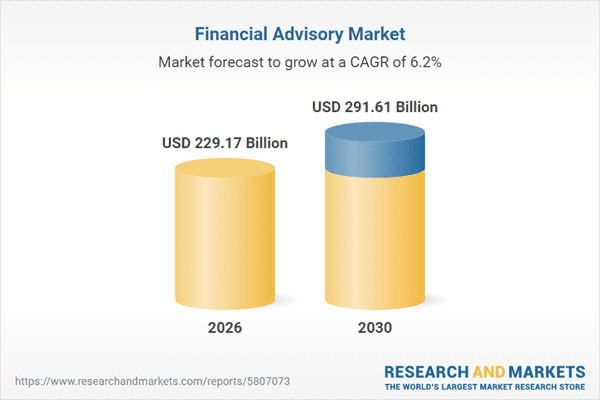
- The global financial advisory services market is expected to reach $229.17 billion by the end of 2026.
- Cerulli expects $124 trillion in US wealth to transfer through 2048. About $105 trillion will go to heirs, and $18 trillion will go to charity.
- The US had 326,000 personal financial advisor jobs in 2024, according to the BLS. Employment is expected to grow 10% by 2034.
- Independent and hybrid RIAs now manage 27% of US industry assets, up from 21% in 2014.
- The median US personal financial advisor earned $102,140 in 2024.
- About 9% of US advisors, representing $3.1 trillion in assets, are expected to have changed firms in 2025.
- McKinsey expects the US to face a shortage of 90,000 to 110,000 financial advisors by 2034.
- 63% of US RIAs use AI tools in some way in 2026.
- 81% of wealth inheritors worldwide plan to switch firms within one to two years of inheriting wealth.
- By the end of 2024, the average US RIA had $615 million in assets, $3.8 million in revenue, and 345 clients.
Industry size, headcount & growth
The financial advisory industry continues to grow as firms manage more money and serve more clients. At the same time, advisor numbers are growing more slowly, so many RIA (registered investment adviser) firms are still managing large amounts of money with small teams.
- The global financial advisory services market was worth $219.48 billion in 2025 and is expected to grow to $229.17 billion by the end of 2026. (Source)
- Global assets under management (AUM) reached $147 trillion in 2025. (Source)
- By 2030, global asset and wealth management revenue is expected to increase by $230 billion. (Source)
- In the US, the Portfolio Management and Investment Advice industry is worth $613 billion in 2026. (Source)
- The US had 283,137 advisor practitioners across all channels at the end of 2023. Advisor headcount grew just 0.2% over the previous decade. (Source)
- The RIA industry is also expanding. In 2025, 16,544 SEC-registered RIA firms were managing $176.8 trillion in assets and serving 73.7 million clients. (Source)
- Most RIAs are still small businesses. About 67.4% manage less than $1 billion in AUM, and nearly 87.3% manage less than $5 billion. (Source)
- The average US RIA focused on individual clients has just 8 employees and $424 million in AUM. (Source)
- In 2025, 6,709 new CFP (certified financial planner) professionals were certified, the highest number ever in one year. Also, 56.5% of all CFP professionals are now under age 50. (Source)
- More than 236,000 CFP professionals now work across 29 countries and territories worldwide as of the end of 2025. (Source)
Advisor demographics, talent shortage & succession
The financial advisory workforce is older than many other professional service industries. Many advisors are close to retirement, and firms are not bringing in enough new advisors to replace them.
- Only 9% of US financial advisors are under age 35, while about 45% are age 55 or older. (Source)
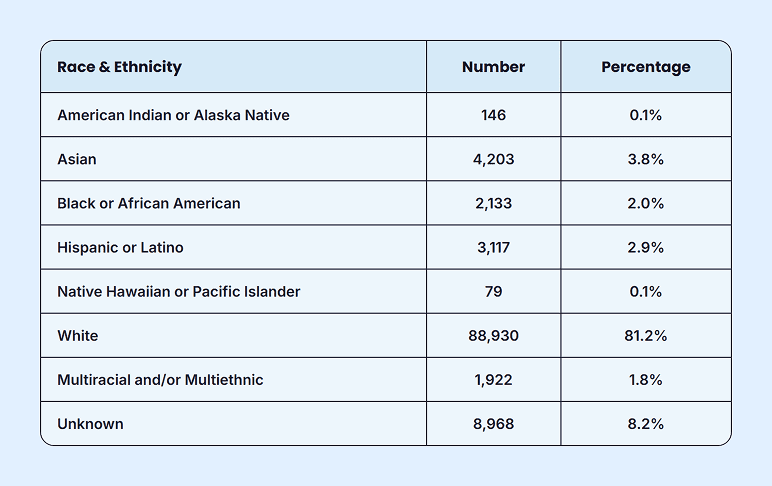
- In the US, women make up 23.8% of CFP professionals, while men make up the remaining 76.2%. The table below shows the race and ethnicity breakdown.
- California is home to the largest number of CFP professionals in the US, totaling 11,012. (Source)
- Talent shortages remain a major concern across the industry. In a survey of firms across 27 countries, 40% of wealth management firms said talent shortage is their biggest business challenge. (Source)
- The US wealth management industry could face a shortage of 90,000 to 110,000 financial advisors by 2034. (Source)
- The US financial advisory industry revenue grew from $150 billion in 2015 to $260 billion in 2024. The increase was driven by growing wealth and continued demand for human financial advice. (Source)
- In the US, employment of personal financial advisors is projected to grow by 10% from 2024 to 2034, with about 24,100 job openings each year. (Source)
- 105,887 US advisors plan to retire over the next decade. They represent 37.4% of advisor headcount and 41.4% of industry assets. (Source)
- The US rookie advisor failure rate is about 72%. Only 15% of rookies say financial advice is their first career. (Source)
- Two-thirds of US RIA leaders say lack of succession planning is a major issue. Only 22% believe their successors can afford to buy them out. (Source)
- US RIA M&A reached a record 322 transactions in 2025, up from 272 in 2024. (Source)
Fee models, compensation & revenue
Financial advisor fees and pay have changed a lot in recent years.
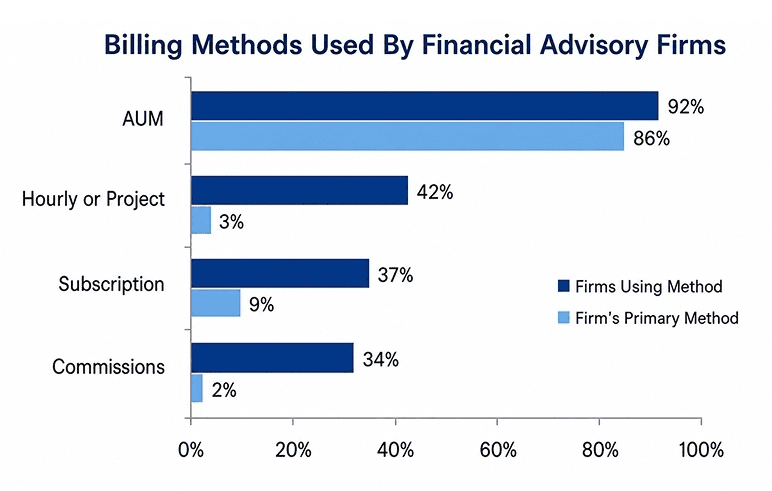
AUM fees are still the most common way advisors charge clients. But flat fees, retainers, and monthly subscriptions are also becoming more common. Advisor pay varies widely, and many RIA firms are growing fast.
- About 92% of advisors use AUM fees in some way, while 86% use them as their primary pricing model. That’s up from 82% in 2022. (Source)
- Fees usually decrease as client assets increase. By 2026, 83% of US advisors expect to charge less than 1% for clients with $5 million or more in assets. For portfolios above $10 million, the average fee is expected to be around 0.66%. By comparison, the average fee for a $100,000 portfolio is about 1.25%. (Source)
- The average flat planning fee in the US is now $2,926, up 15% over the past three years. (Source)
- The average annual retainer fee rose 52%, from $4,484 to $6,815, between 2023 and 2026. Monthly subscription fees nearly tripled, rising from $215 to $595 over the same period. (Source)
- The median US personal financial advisor earned $102,140 in 2024. The top 10% earned more than $239,200, while the bottom 10% earned less than $49,990. (Source)
- US advisor pay grows with experience. Refer to the table below:
| Experience level | Average total compensation |
| Less than 1 year | $57,114 |
| 1-4 years | $67,632 |
| 5-9 years | $79,648 |
| 10-19 years | $93,077 |
| 20+ years | $105,120 |
(Source)
- Median RIA compensation grew 17% over the past five years. This is faster than wage growth in many other professional service jobs. (Source)
- By the end of 2024, the average US RIA managed $615 million in assets, generated $3.8 million in revenue, and served 345 clients. All three metrics grew by more than 12% annually over the previous five years. (Source)
- Top-performing US RIAs grew faster than the median firm in 2024. They had twice the revenue growth and 85% more new clients. (Source)
- The median US advisory firm had a 27.8% operating margin in 2024. That is higher than the 16.2% median for accounting firms and the 10.6% median for law firms. (Source)
RIAs vs. wirehouses & the independence shift
More financial advisors are moving toward independent and hybrid RIA models.
The main reasons are ownership, flexibility, and higher take-home pay. This shift has been happening for more than a decade, and it is still growing.
- Independent and hybrid RIAs managed 27% of US industry assets in 2024, up from 21% in 2014. (Source)
- Independent RIAs grew AUM at a 10.9% annual rate over the past decade. Hybrid RIAs grew even faster, at 12.2% per year. (Source)
- A typical wirehouse advisor takes home 45% of gross revenue. Independent RIAs often keep 70% after expenses. This pay gap is one major reason advisors leave wirehouses. (Source)
- That preference shows up in advisor sentiment as well. About 71% of advisors say they would choose an independent channel if they switched firms. Among existing RIAs, 88% expect to stay where they are over the next 12 months. If they did leave, 97% say they would join another independent RIA. (Source)
- 11,172 US financial advisors changed firms in 2025, up 16% from the year before. (Source)
- Cerulli expects 9% of US advisors, representing $3.1 trillion in assets, to have changed firms in 2025 once the full count is complete. (Source)
- 54 advisor teams with $1 billion or more in assets moved to new firms in 2025. Of those, 29 teams left wirehouses. (Source)
- By 2028, independent RIA advisor headcount is expected to grow 12%. During the same period, wirehouses are expected to lose 5.7%, retail bank broker-dealers 6%, and insurance broker-dealers 9.6%. (Source)
Consumer demand & the great wealth transfer
The Great Wealth Transfer is expected to reshape the future of financial advice.
Over the next two decades, Baby Boomers and older generations will pass large amounts of wealth to Gen X, Millennials, and Gen Z. Many heirs may not stay with their parents’ advisors. This creates both a risk and an opportunity for advisory firms.
- Globally, $83.5 trillion in wealth is expected to transfer to next-generation high-net-worth individuals by 2048, according to Capgemini’s 2025 World Wealth Report, which covered 71 countries. (Source)
- The transfer will happen in stages. 30% of high-net-worth individuals are expected to inherit by the end of 2030, 63% by 2035, and 84% by 2040. (Source)
- In the US, Cerulli expects $124 trillion in wealth to transfer through 2048. Of that, $105 trillion is expected to go to heirs, and $18 trillion to charity. (Source)
- Nearly $100 trillion of US wealth transfers will come from Baby Boomers and older generations. That represents 81% of all wealth expected to move through 2048. (Source)
- More than half of US wealth transfers, or about $62 trillion, are expected to come from high-net-worth and ultra-high-net-worth households. These households make up only 2% of all US households. (Source)
- Gen X households are expected to receive nearly $1.4 trillion in inheritance each year over the next decade. US Millennials are expected to receive $45.6 trillion over the full 25-year transfer period. (Source)
- Globally, 81% of wealth inheritors plan to switch firms within one to two years of inheriting. (Source)
- 40% of US financial advisors say the Great Wealth Transfer is an “existential threat” to their business. (Source)
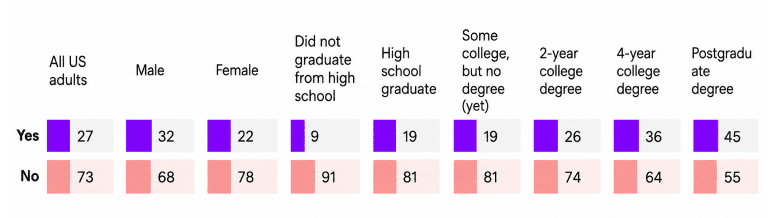
- Only 27% of US adults currently use a financial advisor. Among clients, 60% say trust is the top factor when choosing an advisor. (Source)
- 70% of Millennials prefer working with a human advisor instead of using only digital tools. But 41% prefer a hybrid model that combines human advice with digital tools. (Source)
- Among high-net-worth investors globally, 43% of Gen Z and 41% of Millennials use robo-advisor platforms along with human advisors. This shows that younger investors often expect both human support and digital tools. (Source)
AI & the tech stack reshaping advisor workflows
AI is changing how financial advisors work, but most firms are still early in the process.
Many RIAs now use AI tools, but much of the use is still happening through individual testing, not firm-wide systems. At the same time, advisor tech stacks are becoming more important, and poor technology is now one reason advisors leave firms.
- 63% of US RIAs use AI tools in some way in 2026. (Source)
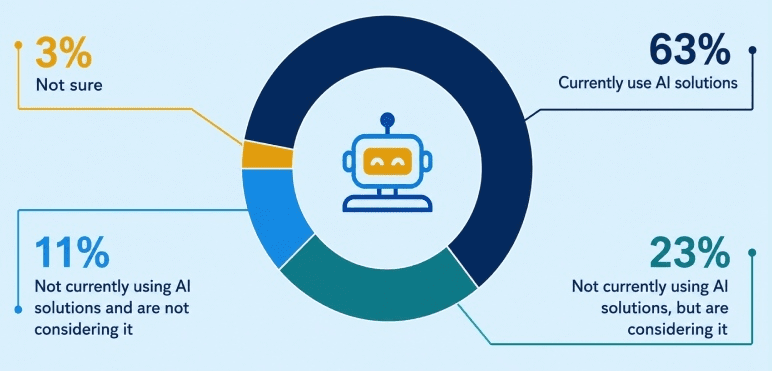
- Among RIAs using AI, 82% use generative AI tools. Most use is still based on individual testing rather than firm-wide systems. (Source)
- Only 8% of advisors now see generative AI as a threat to their job, down from 21% a year earlier. (Source)
- 59% of advisors expect AI to have a direct impact on client relationships within the next 12 months. Also, 68% expect AI to change the future of financial advice within three years. (Source)
- 70% of billion-dollar RIAs use AI for notetaking or call documentation, while 25% leverage AI for client engagement tracking, CRM updates, and meeting scheduling. (Source)
- 91.08% of US advisors use a CRM (Customer Relationship Management) in 2026, down from 96% in 2023. (Source)
- 92% of planning practices use general financial planning software, but more specialized tools are less common. 45% use estate planning tools, and 41% use stock option planning tools. (Source)
- 92% of advisors say they would switch firms because of a poor technology setup, and 44% already have. (Source)
- Global robo-advisor assets under management reached $2.06 trillion in 2025. They are expected to reach $2.38 trillion by 2029. (Source)
- The hybrid robo-advisor market, which combines digital tools with human advisors, is expected to reach $16 trillion in global AUM by 2030. (Source)
- The SEC listed artificial intelligence as a focus area in its 2025 examination priorities. AI is now one of the top compliance concerns in wealth management. (Source)
Conclusion
The numbers in this article show one clear story: demand for financial advice is growing faster than the supply of advisors.
Independent and hybrid RIAs are gaining share. More advisors are moving away from wirehouses. The Great Wealth Transfer is changing who clients are and what they expect. AI is becoming part of daily advisory work. At the same time, many current advisors are getting closer to retirement.
For advisors, these statistics show where the industry is heading. For people entering the field, they show where the opportunity is. Overall, the financial advisory industry is going through a major shift, and the next decade will likely reshape how advice is delivered.
The Quickest Way to turn a Business Idea into a Business Plan
Fill-in-the-blanks and automatic financials make it easy.
Frequently Asked Questions
Is becoming a financial advisor a good career in 2026?
How many financial advisors are there in the US?
How much does a financial advisor make?
Will AI replace financial advisors?
Upmetrics
Upmetrics is the #1 business planning software that helps entrepreneurs and business owners create investment-ready business plans using AI. We regularly share business planning insights on our blog. Check out the Upmetrics blog for such interesting reads. Read more