


You may already know what your business will sell and how much you’ll charge. But once you reach the financial projections, figuring out how much revenue the business could realistically make is often where things get difficult.
If you’re doing this for the first time, it’s hard to understand what numbers to use or where they should come from. And with no past sales data to lean on, the whole thing can start to feel like guesswork.
But it doesn’t have to be. You just need a practical way to build a reasonable forecast using the information you have available.
That’s what I’ll walk through in this guide, step by step, using a realistic example. You’ll also see how to check whether the final numbers actually make sense before you use them in your plan.
What is revenue forecasting?
Revenue forecasting is the process of estimating how much money your business expects to earn from sales over a future period, such as the next month, quarter, or year.
Because future sales are never certain, a forecast is not meant to be an exact prediction. It is a reasonable estimate based on what you already know about your business, your customers, and the assumptions you make about future sales.
A useful revenue forecast should show where the revenue is expected to come from, what assumptions support those numbers, and how sales may change over time.
Also, revenue forecasting is different from forecasting profit or cash flow. Revenue is the money the business earns from sales before expenses. Profit accounts for the costs of generating those sales, while cash flow tracks when money actually enters and leaves the business.
Now let’s understand how to build the revenue forecast step by step.
How to forecast revenue?
There is no single revenue formula that works for every business. A consulting firm, subscription company, retailer, and restaurant all earn money differently.
But the basic logic is similar: understand how your business generates revenue, estimate the values for those revenue drivers, and project how they may change over time.
I’ll use Clearview Cleaning, a new residential cleaning business in Austin, whenever an example makes the process easier to follow.
Step 1: Identify where your revenue comes from and what drives it
Start by listing the main ways your business earns money. These are your revenue streams.
For each stream, work out what actually determines how much revenue it can generate. This gives the basic formula behind it.
Depending on the business, that might be the number of customers, units sold, jobs completed, subscriptions, billable hours, or the average amount each customer spends.
If you sell many products or services, you do not need to forecast every SKU, package, or minor service separately. Group similar offers when they are priced and sold in roughly the same way, and keep them separate when their pricing or sales patterns are meaningfully different.
For example, Clearview Cleaning expects revenue from:
- Recurring home cleaning
- Deep cleaning
- Move-in and move-out cleaning
For each service, the basic revenue formula is:
Number of cleaning jobs × average price per job
The same idea applies to other businesses, but the formula will vary:
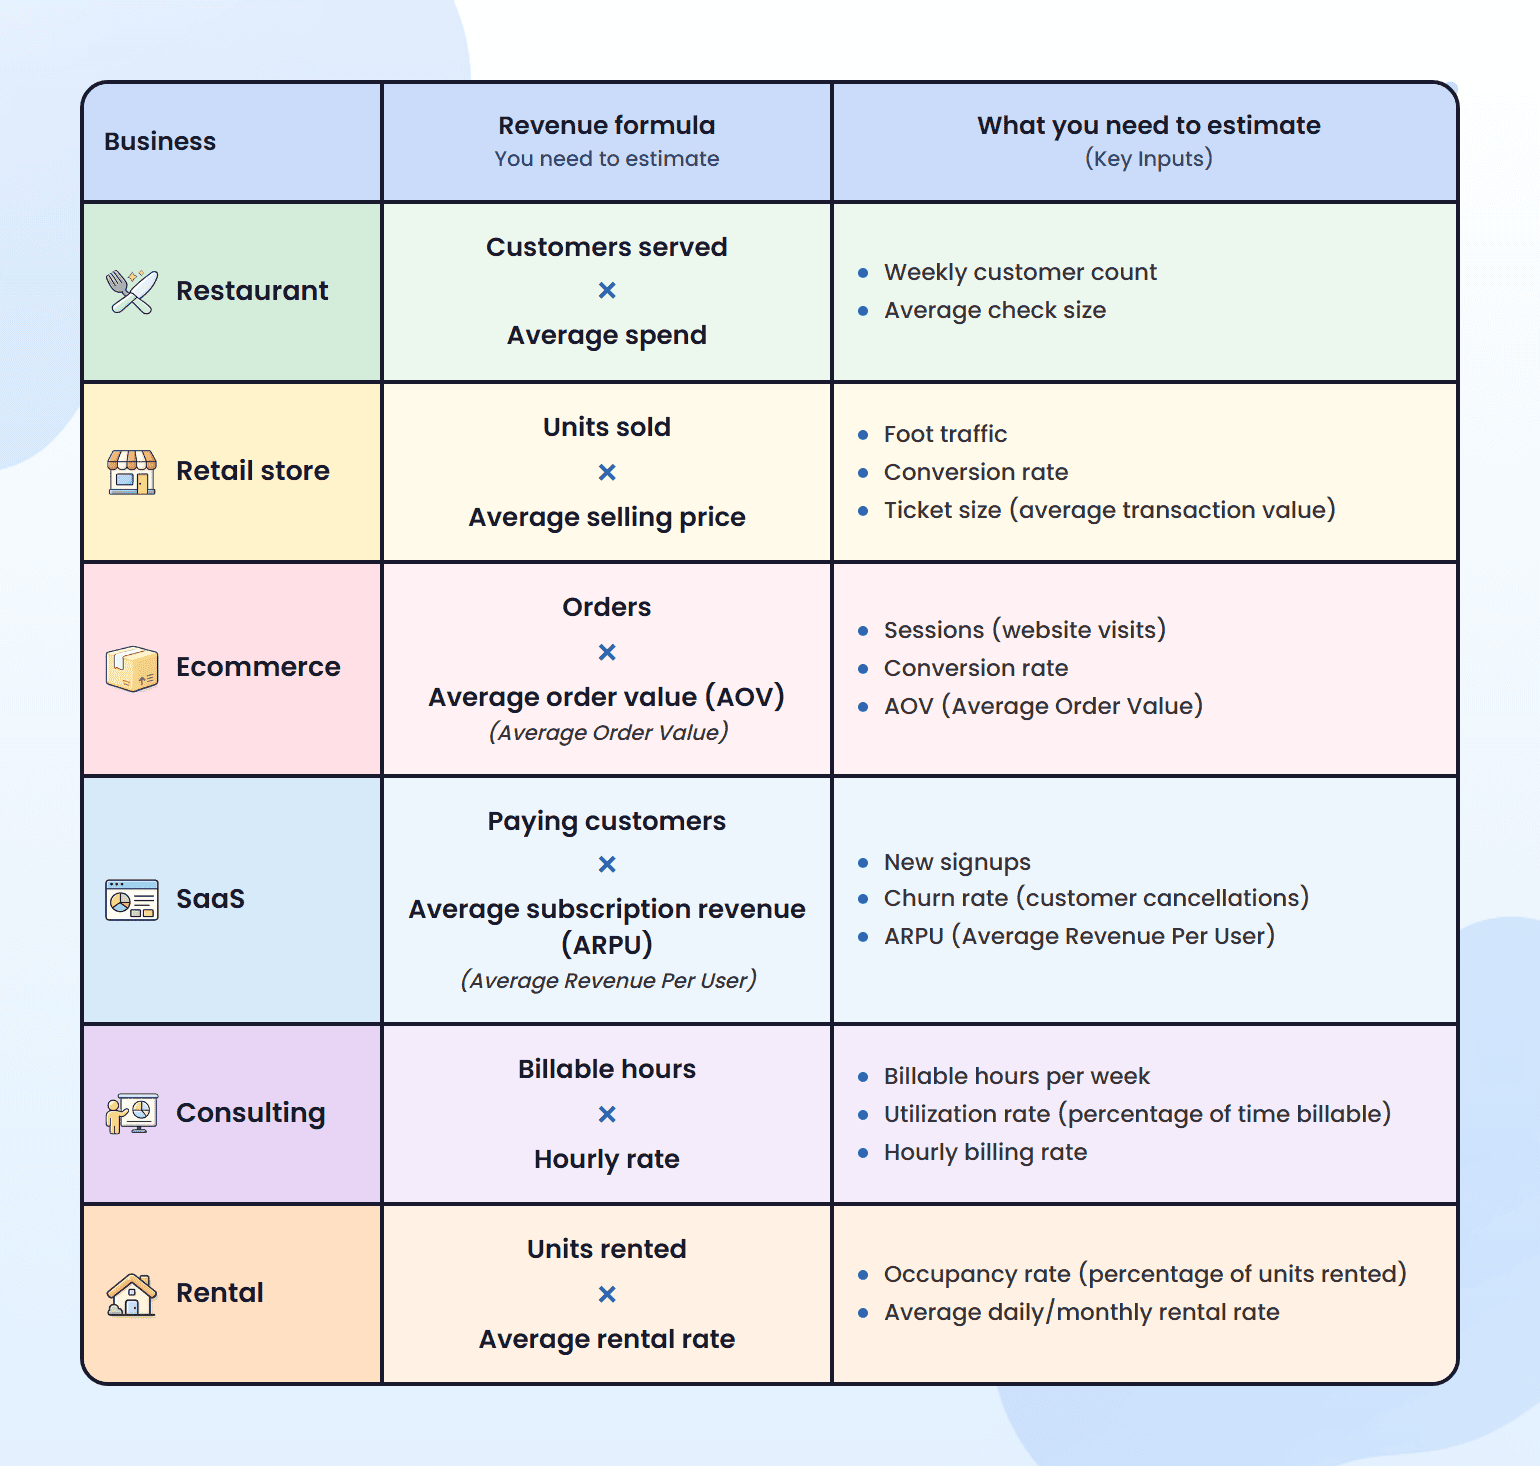
Some businesses will need several drivers. And that’s fine. Use the few inputs that best explain how your business actually earns revenue. Identifying them helps you break revenue into smaller parts you can estimate separately, rather than guessing one total figure.
Step 2: Set realistic starting values for your revenue drivers
Now that you know which numbers drive your revenue, the next step is to decide what starting value to use for each one.
This is where forecasting usually gets difficult. You may know that customer volume, average spend, conversion, or pricing matters, but still be unsure what a reasonable number should be.
That’s why I’d say begin with the best information you have available.
If your business already has sales history
Use recent actual performance as your starting point.
Look at the drivers you identified in Step 1, such as:
- Average customers or orders per month
- Average selling price or order value
- Conversion rate
- Repeat purchases, retention, or churn
- Deal volume and close rate
Before using those numbers, check whether they reflect normal performance. A one-time large contract, major promotion, temporary closure, or unusually weak month can distort the picture.
If something clearly will not repeat, account for it before using the historical number in your forecast.
The goal is to find a realistic value that reflects how the business normally performs, not simply copy past year’s results.
What if you have no historical data?
If you’re starting a new business, you won’t have past sales to rely on.
Use the best evidence available from the business and market. Depending on the revenue driver, that might include:
- Planned pricing
- Customer research
- Early enquiries or bookings
- Comparable businesses
- Industry benchmarks
- Expected leads, website traffic, or customer enquiries
- Staffing or operating capacity
For example, Clearview Cleaning has one crew that can complete about two jobs a day over 22 working days. It can handle up to 44 jobs a month, but because it is just launching, the owner may forecast only 20 jobs in month one while demand is still building.
The estimate is still uncertain, but there is a clear reason behind it.
Do the same for the other drivers that matter most. You do not need perfect data, but you should be able to explain what each important assumption is based on.
Step 3: Project how those revenue drivers will change over time
Once you have your starting values, think about which of them are likely to change during the forecast period.
For most new businesses, I suggest calculating the first year month by month. This makes changes such as startup ramp-up, seasonality, pricing, and added capacity easier to reflect.
But you do not need to predict every possible change. Focus only on the drivers you reasonably expect to change during the forecast period. If you have no good reason to expect a number to change, keep it the same.
Most changes will usually come from one of three areas: demand, customer behavior or pricing, and capacity.
Demand may change as the business builds customers or moves through seasonal periods.
A new service business might gradually increase bookings as it gains customers and referrals.
If demand normally rises or falls at certain times of the year, reflect that in the driver affected.
For example, a retailer may expect more transactions during the holidays, while a landscaping business may expect fewer jobs during colder months.
Use past sales patterns if you have them. If the business is new, use industry patterns, customer behavior, or local conditions. If there is no clear seasonal effect, you do not need to add one.
Pricing or customer behavior may change how much revenue each customer generates.
For example:
- Average spend increases after a price increase
- Repeat purchases improve
- Churn falls
- Customers move to higher-priced plans
- Product mix shifts toward higher-value offers
Only include changes you have a reasonable basis to expect.
Revenue can also change when something in the business changes, like gaining more capacity to sell or deliver.
That could happen because you:
- Hire more staff or add capacity
- Extend opening hours
- Launch a new product or service
- Open another location
- Increase sales or marketing activity
The important part is to change the driver that actually causes revenue to move. If customer volume is expected to increase, forecast the additional customers or orders rather than simply increasing total revenue by an arbitrary percentage.
If your forecast shows sales rising 40%, you should be able to point to what changes in demand, pricing, capacity, or customer behavior make that increase possible.
Step 4: Calculate revenue for each forecast period
Once you have estimated your revenue drivers and how they may change over time, you can turn those assumptions into actual revenue figures.
For each revenue stream, apply the formula you identified in Step 1 using the values you estimated in Steps 2 and 3.
For example, if revenue depends on the number of jobs completed and the average price per job:
Jobs completed × average price per job = revenue
At this stage, I would avoid introducing new assumptions. The calculation should simply reflect the numbers you have already decided on.
Suppose Clearview Cleaning charges an average of $150 per job and expects to complete 20 jobs in month one, 24 in month two, and 28 in month three.
For Month 1:
20 jobs × $150 = $3,000 in revenue
Its first three months would look like this:
| Month | Cleaning jobs | Average price | Forecast revenue |
| Month 1 | 20 | $150 | $3,000 |
| Month 2 | 24 | $150 | $3,600 |
| Month 3 | 28 | $150 | $4,200 |
Repeat the calculation for each forecast period.
However, if your business has multiple streams of income, you’ll need to work out each one separately and then sum the totals.
For Clearview, that could mean:
Recurring cleaning revenue + deep cleaning revenue + move-in/move-out revenue = total revenue
Separating the streams makes the forecast easier to understand and update if there are differences in pricing, sales volume, and/or growth patterns within each stream.
If refunds, cancellations, discounts, or churn significantly impact the expected revenue, then account for them in the relevant revenue stream rather than ignoring them.
By the end of this step, you should have monthly or quarterly revenue numbers which can be traced back to the assumptions used to come up with them.
Step 5: Validate and stress-test your revenue forecast
Getting the formula right does not automatically make the forecast believable.
The best check I know is to look at the finished forecast and ask: What would need to be true for this revenue to happen?
First, see whether the rest of the business supports those conditions.
Focus on the drivers that have the biggest effect on revenue and check whether:
- There is enough customer demand to support the projected sales
- Your marketing or sales activity can realistically generate that demand
- Your staff, equipment, inventory, or operating capacity can handle the projected volume
- Key assumptions such as pricing, average spend, conversion, or retention still make sense
For example, Clearview Cleaning’s forecast reaches 50 jobs a month, but its current crew can only complete about 44. The numbers do not work together yet. The owner would either need to reduce the sales forecast or add enough capacity to handle those extra jobs.
Next, I’d recommend testing what happens if one or two important assumptions turn out differently than expected.
You do not need to create dozens of scenarios. Focus on the drivers that could materially change the result.
For Clearview, customer demand may be one of the biggest uncertainties, so the owner could test different monthly job volumes:
| Scenario | Jobs per month | Average price | Monthly revenue |
| Lower case | 24 | $150 | $3,600 |
| Base case (Expected) | 28 | $150 | $4,200 |
| Stronger case | 32 | $150 | $4,800 |
Then compare those results with what the rest of the financial plan requires. For example, if Clearview needs around $4,000 in monthly revenue to support its expected expenses, the slower-demand case shows that the business could fall below that level if bookings build more slowly than expected.
The goal is not to predict every possible outcome. It is to understand which assumptions your revenue forecast depends on most and what happens if those assumptions do not go as planned.
By this point, you should have a revenue forecast you can explain and support, with each figure tied to a clear business assumption. That makes the forecast more useful for your business plan, financial projections, and any conversation with a lender, investor, or partner.
Review and update your revenue forecast as actual results come in
Once actual sales start coming in, compare them with what you forecast.
If actual results differ from your forecast, do not immediately change your future estimates. First, look at what caused the difference. It could be fewer customers, lower average spending, slower demand, or another revenue driver you estimated earlier.
A simple review process looks like this:
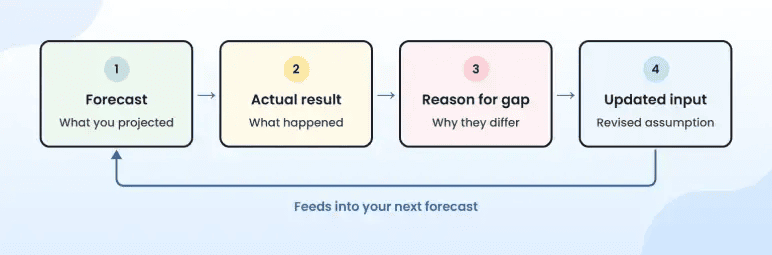
You also do not need to change the forecast because of every small difference. One unusually strong or weak month may not mean your assumptions are wrong. Update the forecast when the same pattern continues or when something important in the business clearly changes.
For example, suppose Clearview Cleaning expected to complete 28 jobs in a month but completed only 22.
Instead of immediately lowering future forecasts to 22 jobs, the owner should first understand why. Maybe the business received fewer enquiries than expected, or demand is taking longer to build.
If that pattern continues, the owner can then lower the future job-volume assumption to better reflect what the business is actually experiencing.
The same approach applies to other revenue drivers. As you get more actual results, use them to replace assumptions that no longer reflect how the business is performing.
Conclusion
A realistic revenue forecast does not need to predict sales perfectly. It needs to show how you arrived at the numbers, what assumptions they depend on, and how those assumptions may change over time.
If you build the forecast from your revenue drivers, check whether the numbers are realistic, and update it as real results come in, it becomes much more useful for planning and decision-making.
If you would rather not build and update all of this manually, Upmetrics’ financial forecasting software can help. It lets you create revenue projections, adjust key assumptions, test different scenarios, and keep your forecasts connected with the rest of your business plan.
Build Accurate Revenue Forecasts With Ease
Create reliable revenue projections, plan growth, and make smarter financial decisions.

Frequently Asked Questions
What is the difference between a revenue forecast and a sales forecast?
How far ahead should you forecast revenue?
How accurate should a revenue forecast be?
How often should I update my revenue forecast?

Vinay Kevadia
Vinay Kevadiya is the founder and CEO of Upmetrics, the #1 business planning software. His ultimate goal with Upmetrics is to revolutionize how entrepreneurs create, manage, and execute their business plans. He enjoys sharing his insights on business planning and other relevant topics through his articles and blog posts. Read more