When you’re building financial projections, there’s always that moment of hesitation. You’ve got the numbers lined up (revenue, costs, margins) and they look fine.
But there’s that lingering question: Are these actually relevant?
That’s the blind spot most plans have. Without context, even solid-looking figures don’t tell the full story. You need something to measure them against, and that’s where industry benchmarking comes in.
I use it as a calibration tool. It keeps financial projections realistic, budgets defensible, and decisions grounded in evidence instead of optimism.
In this blog, I’ll walk you through how to find the right benchmarks and use them to make your forecasts sharper, your budgets more realistic, and your decisions easier to defend.
What is industry benchmarking?
Industry benchmarking is the process of comparing your business’s financial and operational performance with others in your industry. It gives your numbers context, showing whether your margins, costs, or growth rates are actually competitive or need work.
Without it, financial data can look fine in isolation but fail to reveal where you’re strong, where you’re behind, or where you can improve. Benchmarking grounds your decisions in reality instead of assumptions.
Once you understand what benchmarking is, the next question is obvious: What exactly should I be comparing?
What metrics should you benchmark in your industry?
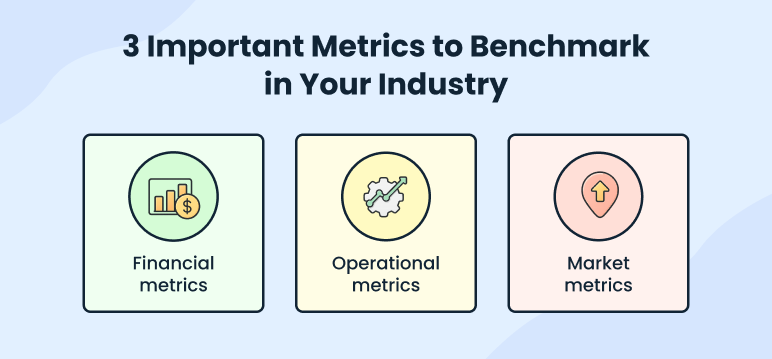
There’s no fixed list of benchmarks that works for everyone. What you measure depends on your business model, size, and goals. Still, most useful benchmarks fall into three groups: Financial, operational, and market metrics.
1. Financial metrics: Are your numbers healthy?
Financial metrics show whether your business model makes financial sense. Let me put it this way: If a friend came to me with their business plan and said their gross margin was 25%, I wouldn’t say “good” or “bad” right away. I’d ask, “What’s normal for your industry?” Because that’s where the real answer hides.
Here are a few key ratios that give a clear picture:
- Gross margin: How much you keep after covering direct costs? It tells you whether your pricing and cost structure are in sync.
- Operating costs: How much do you spend to keep the business running? If it’s higher than the industry norm, that’s often where profitability leaks.
- Net profit margin: What’s left at the end of the day? Comparing this to your industry’s average can reveal whether your cost control or pricing strategy needs work.
- Current ratio: A quick look at your liquidity. It tells you if you can comfortably handle short-term obligations without stretching cash flow.
What I tell founders is not to panic if their numbers don’t match the averages exactly. Benchmarks are meant to show you where to dig deeper. If your margins are lower, maybe your product is in an earlier growth stage or you’re investing heavily in customer acquisition.
2. Operational metrics: How efficiently are things running?
Operational metrics show how efficiently your business turns resources like people, time, and assets into results.
Some common ones include:
- Revenue per employee: A clear indicator of team efficiency. If it’s below the industry average, your structure or tools might need attention.
- Delivery or turnaround time: Measures how quickly you fulfill orders or complete work. Longer cycles usually mean higher costs or slower cash flow.
- Inventory or asset turnover: Reveals how efficiently you convert resources into revenue. A slower rate ties up cash; a faster one shows you’re running too lean.
If the financials look fine but operational benchmarks lag, that’s a sign to dig deeper. Strong operations are what make good numbers last.
3. Market metrics: How well you attract and keep customers?
As the name indicates, market metrics show how effectively you attract and retain customers—inputs for any competitive analysis. They’re crucial if you’re in a competitive or fast-moving market.
Focus on:
- Customer retention rate: Shows whether your product delivers consistent value.
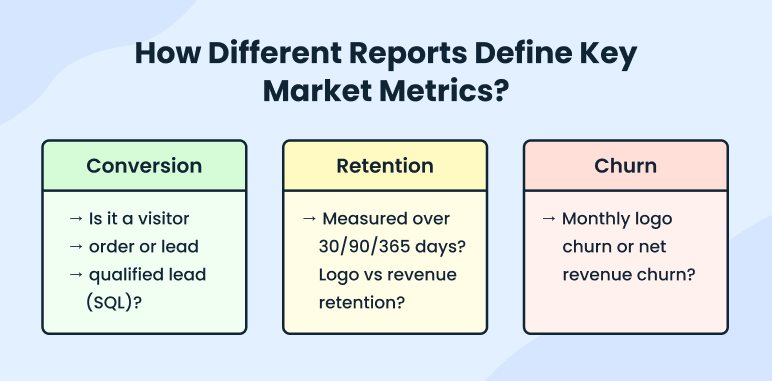
- Conversion rate: Measures how efficiently you turn interest into sales. Just make sure you understand how it’s defined in your data source.
- Churn rate: The opposite of retention, and the most telling metric for SaaS or subscription models.
If someone came to me and said their sales looked great but revenue still felt flat, I’d ask one thing: “How many of those customers are sticking around?” Nine times out of ten, that’s where the problem hides. Benchmarking these metrics helps you see whether you’re actually growing or just replacing the customers you’re losing.
That said, market metrics can get confusing fast because every industry defines them differently. Before you take any number at face value, check how it’s calculated; sometimes “conversion” or “retention” means something entirely different in another report.
Once you’re clear on that, the next step is finding how to get reliable benchmark data for your business.
Tired of tracking metrics in spreadsheets?
Build accurate projections without the manual work

How to find the right industry benchmarks for your business?
There are ample sources to find the benchmarking data, even I’ve listed some sources in the latter part of this article. Data isn’t the problem here; it’s identifying the right industry benchmarks to compare for your business.
When you have the data, check for recency, accuracy, and relevance to your specific industry and market conditions, and cross-reference multiple sources whenever possible.
I use Upmetrics’ industry research reports; you can use them or check other reputable sources like industry associations, market research firms, government databases, and consulting firms.
Here’s my exact process: how do I understand every new niche, how I filter benchmarks to compare, how I cross-check and verify them for accuracy and more. You’ll surely have better clarity post this section.
Step #1: Know your industry and niche
Before you start collecting data, get clear on what industry analysis really means for your business. Most benchmarking errors start here. When the industry definition is too broad, the comparisons don’t make sense.
How narrow should you go? Narrow enough that margins, costs, and customer behavior match your reality. “Retail” alone doesn’t say much. Women’s fashion boutiques, local groceries, and online home décor stores all run on different economics.
For example, an online boutique shouldn’t compare itself to general retail averages. Boutique eCommerce relies on curation and brand; department stores depend on volume and logistics. For different models, there are different benchmarks.
Benchmarks only work when you compare yourself to the right crowd. If your business overlaps multiple segments, focus on the one that drives most of your revenue or defines your cost structure. That’s the version investors and analysts will use in their own industry analysis.
To confirm where you fit, check your NAICS code, research similar businesses, or use tools like Upmetrics’ Industry Research or ChatGPT Deep Research. They’ll help you identify your correct classification.
The key is specificity. A boutique store shouldn’t benchmark itself against Walmart. That’s the difference between industry analysis and market analysis: understanding where your business truly operates. The sharper your focus, the more accurate your benchmarks.
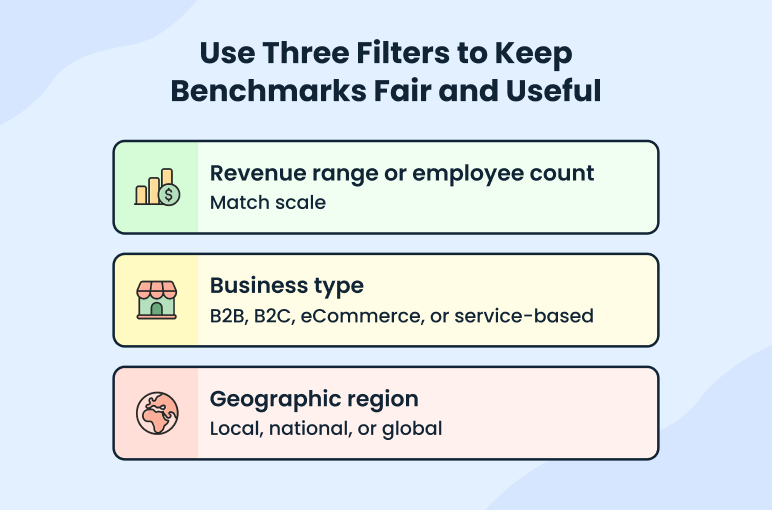
Step #2: Filter benchmarks by business size and model
Once you define your industry, narrow the data. If you skip this step, comparisons drift.
Benchmarks change with scale. A startup and a mature company may share a sector but not the same costs. Margins, overhead, and ratios evolve as you grow, so cross-stage comparisons will mislead you.
Business models matter, too. Two apparel brands can sell the same product and still look different on paper.
- An eCommerce store spends more on shipping, tech, and fulfillment.
- A brick-and-mortar shop spends more on rent and in-store staff.
Can’t find an exact match? That’s normal. Pick the closest profile, then adjust for what you know (for example, higher local wages or premium pricing tiers). The goal is a fair comparison. That’s what investors and reviewers trust.
Step #3: Choose 3-5 metrics that match your goals
When founders first get into benchmarking, they want to track everything. Revenue, churn, margins, cash flow, all of it. I know it feels like covering all bases. But in reality, the more metrics you chase, the less you actually learn.
I recommend starting small; three to five metrics, tops. The right ones depend on what you’re trying to improve.
If your goal is profitability, look at gross margin, net profit margin, or return on assets (ROA). These tell you if the business model really works. When those numbers trail industry averages, it’s often not demand—it’s pricing or cost efficiency.
If you’re after efficiency, keep an eye on inventory turnover, receivables turnover, or asset utilization. Slow movement here usually means your cash is sitting in operations longer than it should.
For stability, focus on ratios that show financial breathing room, such as the current ratio or debt-to-equity. Those matters when growth slows and bills don’t.
And if you’re chasing growth, metrics like sales per employee, customer acquisition cost (CAC), and retention rate tell you whether your scaling is sustainable.
Let me give you a quick example:
If a SaaS founder asks me what to track, I tell them to stick with churn, MRR growth, and CAC-to-LTV ratio; those three reveal most of the story. If it’s a restaurant owner, I’d swap those for food cost percentage, labor-to-sales ratio, and table turnover.
A few right metrics make your forecasts sharper, your budgets more grounded, and your growth plans easier to defend.
Step #4: Compare across multiple sources
Not all benchmark data comes from the same place. Some reports use tax filings. The rest depend on surveys or their own samples. That’s why it’s a good practice to cross-check at least two or three sources and then lock down a number.
When developing a plan, use IBISWorld in terms of industry ratios and cost structure. Then compare such figures with the IRS statistics of income that are drawn directly from filed tax returns.
When operating within a particular industry, I will also include trade group information, such as the National Restaurant Association, which releases new information on restaurant margins and cost patterns on a regular basis.
Small gaps between sources are normal. If IBISWorld shows a 9% net margin for bakeries and the IRS lists 7%, don’t pick one over the other; take the overlap. That 7%-9% range gives a realistic benchmark window and leaves room for factors like location or company size.
If two reports feel miles apart, check how they define their metrics. One might show EBITDA margin, another net margin after tax. It’s important to compare apples with apples before you settle on one of them.
The process can be simplified with tools like Upmetrics Industry Research or ChatGPT Deep Research that will help you summarize definitions and validate data sources.
Step #5: Apply benchmarks to your own data
After defining your benchmarks, compare them to your numbers- margins, expenses, or key KPIs. That’s when patterns start to show.
Say your cafe nets 8% profit, while the industry average is 12%. The 4 percent margin is normally hiding in the same areas: increasing supplier prices, menu prices that have not kept pace, or hours of labor that have slipped beyond the schedule. It doesn’t mean to achieve 12 percent overnight, but to know where the difference resides.
Here’s how I approach it:
- Spot the gaps. Compare each ratio side by side with the benchmark and flag the biggest deltas.
- Trace the cause. If margins are off, check COGS or staffing first; if cash flow lags, review receivables.
- Set one fix per quarter. Maybe it’s a vendor renegotiation, price test, or workflow update. Small, focused moves close the gap faster than broad cuts.
That’s when benchmarking shifts from being “interesting data” to a real performance tool, showing you exactly what to adjust and how it impacts the bottom line.
Where to find industry benchmarks (Paid & Free sources)
You don’t need to dig through obscure reports or pay thousands for access. The following are a few simple ways to get your benchmark data:
- Upmetrics Industry Research Reports: These are ready-made reports with verified financial ratios, profit margins, and growth trends for your industry. You can use them directly in your business plan without doing any manual research.
- IBISWorld (Paid): A trusted source among analysts, lenders, and investors. Their reports entail financial ratios, cost structures, and five-year projections in industries. The consistency and thoroughness of the data presented by IBISWorld is assured because it standardizes its approach.
- BizMiner (Paid): It’s best suited to small and medium-sized enterprises that require localized information. BizMiner breaks down financial ratios by company size, region, and NAICS code, giving you a more accurate comparison if your operation doesn’t fit national averages.
- Internal Revenue Service and U.S. Census (Free): The Internal Revenue Service publishes aggregated financial data from tax returns by NAICS code. Pair it with Census data for a grounded view of your industry’s scale and structure.
- Trade associations and chambers of commerce: There are also trade associations in many industries, which publish annual reports on benchmarks, some of which are free to members. Where operational metrics such as productivity, retention, and turnover are not found in the broader databases, these may be part of them.
If you still wish to consider a few other sources, I’ve compiled a list of 20+ credible paid and free sources for industry reports and benchmarks. Feel free to find relevant ones for your business.
How to use industry benchmarking for accurate budgeting & forecasting (analysis + application)
Accurate forecasting starts with context. Benchmarks provide that context by showing how businesses in your industry typically earn, spend, and grow. When you integrate those patterns into your planning, your numbers stop being estimates and start reflecting operational reality.
There are many ways to apply benchmarking in financial planning, but I’ll focus on a few of the most practical ones:
Use benchmarks to set realistic financial goals
How much profit should you expect on every dollar of sales? How do your costs compare to what’s typical in your industry? These are the questions that make or break a financial plan.
I always start by comparing revenue, margins, and expenses against industry benchmarks. If your profit margin is below average, the first thing I check is whether it’s a pricing issue or an expense problem. And if expenses are higher than peers, I dig into whether that extra spend is driving growth or just adding noise.
Your numbers and your financial projections should tell a consistent story about how your business performs. Benchmarks make that story believable.
Align your budget with industry spending patterns
Look at how similar businesses allocate money across marketing, operations, payroll, and R&D. These spending ratios make your budget easier to defend.
According to the U.S. Small Business Administration, most small businesses spend 7-8% of revenue on marketing, while high-growth industries go closer to 10%. Building within that range keeps your plan credible and leaves room for flexibility.
Let industry growth rate guide your forecasts
When projecting revenue or profit, anchor your assumptions in real market data. If IBISWorld reports your sector’s average annual growth at 6%, that’s your baseline. You can aim higher, but there should be a clear reason (like stronger distribution, product innovation, or market access).
These aren’t the only ways to use benchmarks, but they’re the ones that make the biggest difference when planning or presenting your financials. They keep your assumptions tied to evidence and make your forecasts easier for investors or your own team to trust.
The bottom line
Benchmarks don’t stay still, so neither should your analysis. Industries shift, margins tighten, and what looked competitive a year ago can fall behind fast. I tell founders to treat benchmarking like an annual check-in. Revisit your data, update your assumptions, and see if your numbers still make sense in today’s market.
The real value of benchmarking is the clarity. It tells you what’s working, what’s slipping, and where to focus next. Once you start tracking it consistently, it becomes less about comparison and more about control.
If you’re ready to turn those insights into a real plan, Upmetrics helps you do it faster. You can build financial projections, align budgets, and create an investor-ready business plan.
Frequently Asked Questions
What are the best sources (free or paid) for benchmarking data?
Can I benchmark my startup if I don’t have much data yet?
How do I find accurate and recent industry benchmarks for my business?
How do I know which benchmarks are relevant to my business type or size?

Chad Stephens
Chad Stephens is a Venture Capital Analyst with expertise in startup investing and institutional finance. He specializes in reviewing business plans and financial models with a strong focus on accuracy and investor alignment. With over six years of experience, he writes about private equity, venture capital, and market trends to share insights with the business community. Read more