Let’s update the old saying “All work and no play makes Jack a dull boy” to fit a business perspective: “All planning and no proper analysis makes a business stagnant.”
This is where conducting a plan vs. actual analysis comes into the picture!
By comparing your planned and actual performance, you can identify gaps, optimize strategies, and ensure your business stays on track for success.
Don’t worry, if you’re still figuring out how to conduct a plan vs. actual analysis. Here’s a step-by-step guide to make your process smoother.
Let’s get started.
What is plan vs. actual analysis?
Plan vs. actual analysis is the process of comparing forecasted financial goals, such as sales, revenues, and expenses, with the actual financial outcomes achieved over a specific period.
This analysis helps to identify variances (differences between the two data sets), understand the reasons behind them, and make informed decisions to improve financial strategies and future forecasts.
How to conduct a plan vs. actual analysis?
You can conduct a plan vs. actual analysis in various ways, and the most common way is to do it through a spreadsheet. The other easy way is to do it through Upmetrics. Let’s see them both:
Plan vs. analysis using spreadsheets
Spreadsheets, such as Excel or Google Sheets, provide a powerful platform for data manipulation, calculations, and visualization, making them ideal tools for conducting analysis.
Below is a detailed description of using spreadsheets for plan vs. actual analysis.
1. Start with the plan
Since you’re planning to conduct a plan vs. actual analysis, we’re assuming you already have your forecasts with you. However, if you don’t have forecasts yet, here is the process for creating them:
First, start a new spreadsheet to forecast your data. Consider all the metrics you want to compare with the actual data, such as sales forecasts, revenue, expenses, profit, etc.
Now, for example, in sales forecasts, start by listing all the products or items you sell in the vertical column, along with the units and average price per unit. In the horizontal column, add the months or years you’re predicting. This setup helps you clearly organize and project your sales data.
Here’s an example of a sales forecast done for a cafe business:
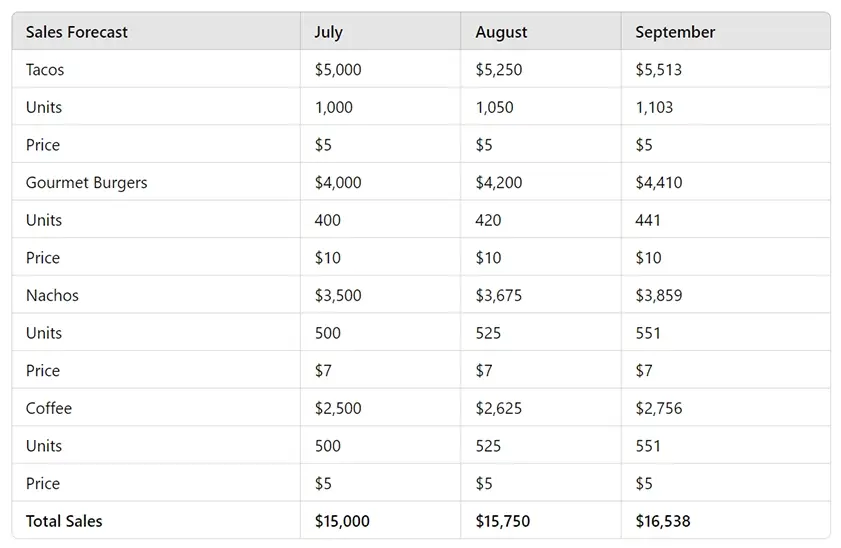 These are detailed sales forecasts stating the expected total sales of tacos, gourmet burgers, nachos, and coffee i.e. units multiplied by the price per unit.
This is just an example. You can forecast the data quarterly, monthly, yearly, or in any other manner you like.
2. Put the actual results into your spreadsheet
Now is the time to gather your actual sales data. Most accounting or bookkeeping software can export actual results directly into a spreadsheet format. This makes it easy to copy and paste the actual data from the accounting software into your pre-structured spreadsheets.
Additionally, you can use ChatGPT to properly format your data. Simply enter your actual sales data into the prompt and ask ChatGPT to organize it in the same format as your sales forecasts.
Here’s an example of the actual sales data for the same cafe business as the above example:
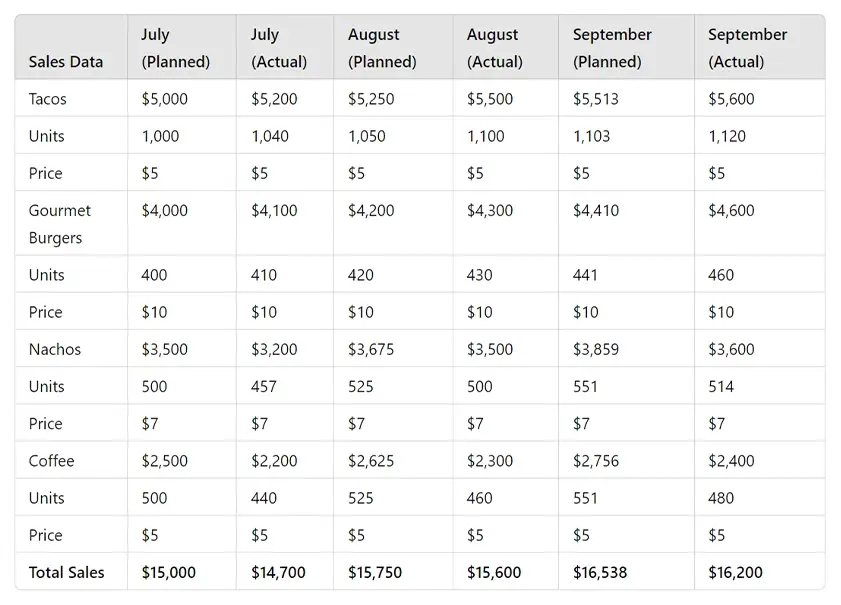
This step is prone to errors, so it’s crucial to double-check your inputs throughout the process. Proper alignment and accuracy at this stage will enhance the reliability of your plan vs. actual analysis.
Say goodbye to old-school Excel and spreadsheets
Compare your actual financial data with planned projections

3. Compare both the data
Once you’ve gathered both your forecasted and actual sales data, the next step is to compare them.
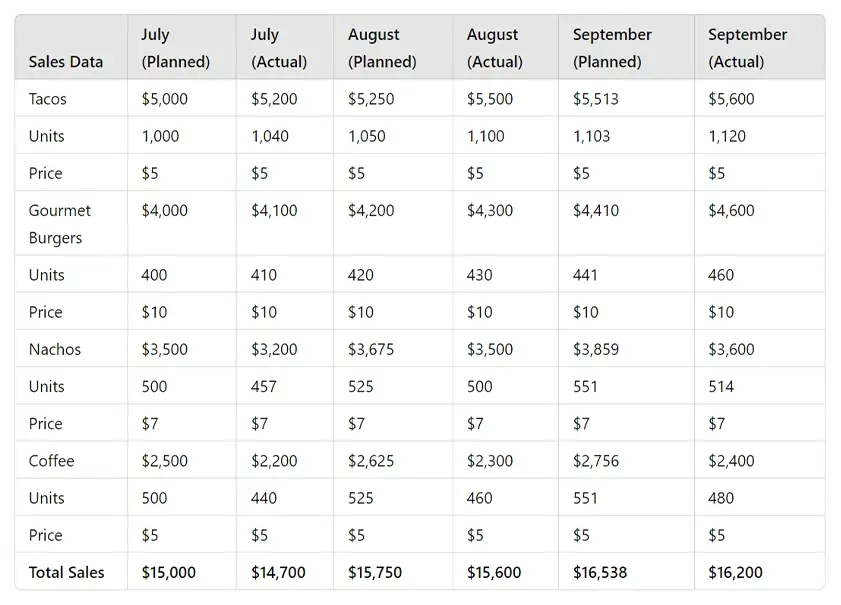
Begin by creating a table that includes both sets of data side by side for each metric over the same period. This visual representation will help you find the differences in one glance.
Here’s the example of a cafe business on the comparison of both planned vs. actual analysis:
Plan vs. actual analysis using Upmetrics
Let’s move ahead with our other method for conducting plan vs. actual analysis through Upmetrics.
Upmetrics is an AI-powered business and financial planning tool that helps entrepreneurs and teams plan, forecast, and track their plans from a single platform.
Let’s see how to use Upmetrics for plan vs. actual analysis:
1. Start with the plan
First, log in to Upmetrics and create a workspace. Answer some of your business-related questions to input data in the software. If you already have forecasts, you’ll need to add them manually.
But, if you don’t, create them using the AI financial forecasting tool. For that, you’ll need to go to finance forecasting option as shown below:
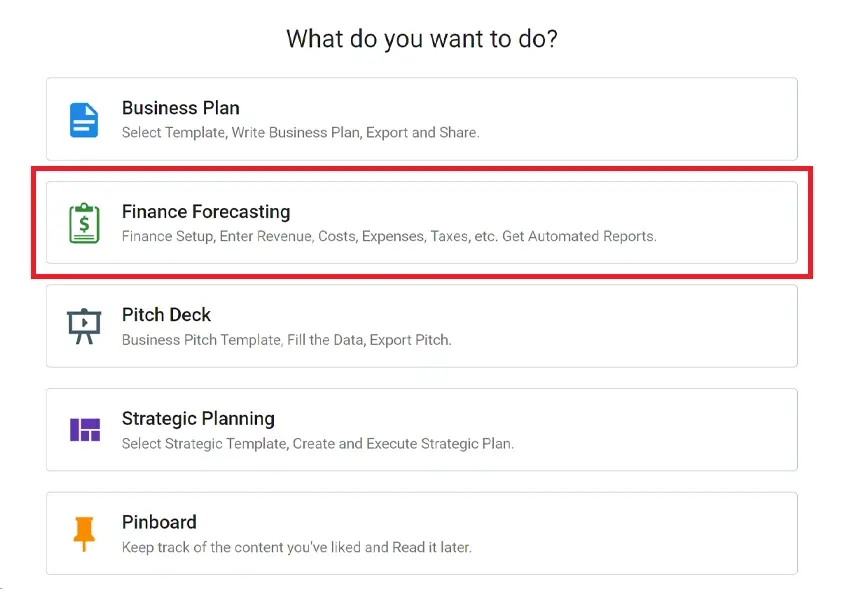
Then, within the financial forecasting module, under all financial streams (revenue, expenses, etc.) you will get the option to create a financial stream using AI.
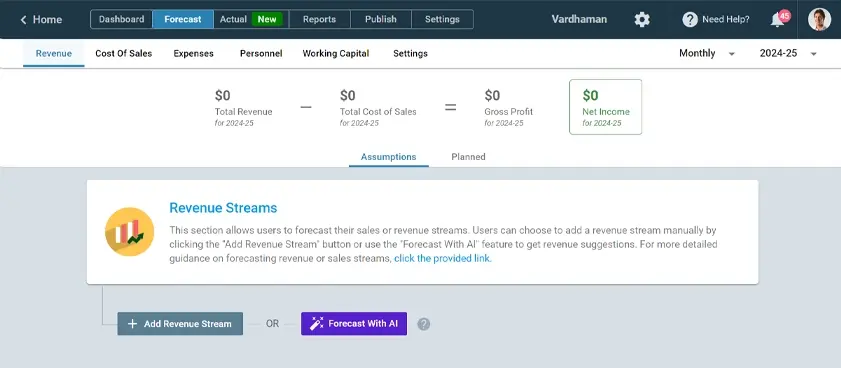
Select the Forecast with AI button, and a table from the right side will pop up. There you will have the option to generate streams that AI thinks are best considering your business type.
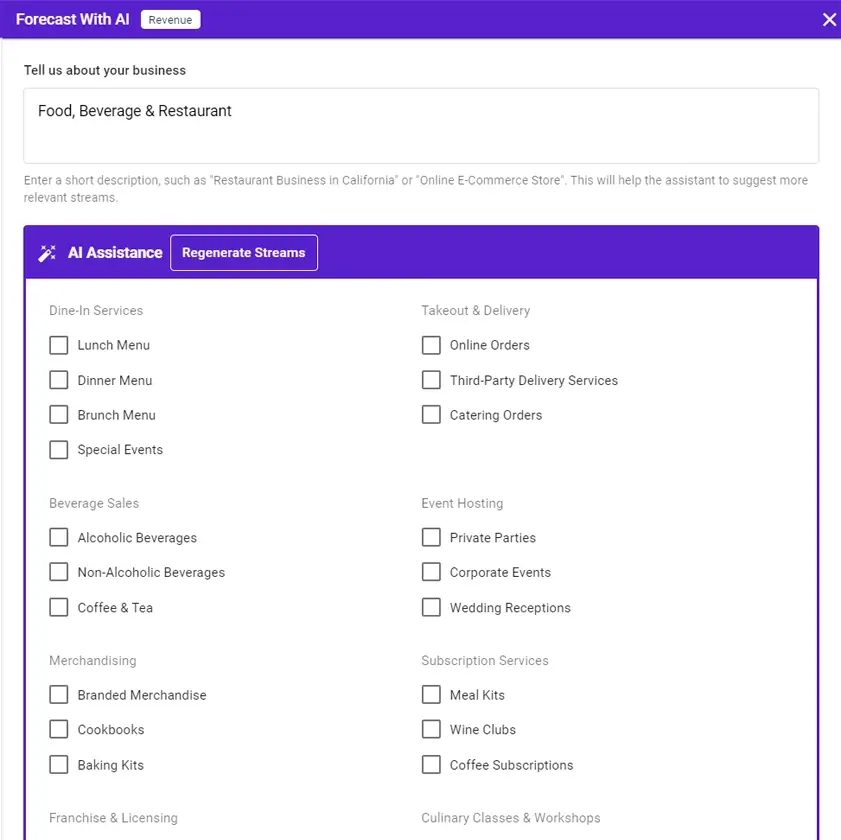
Select the streams that are useful for you. Then, click the complete forecasts section, and you will get the whole forecast form below, where you can fill up all the data.
This includes basic details like finance item name, amount details, percentage change over time, and more.
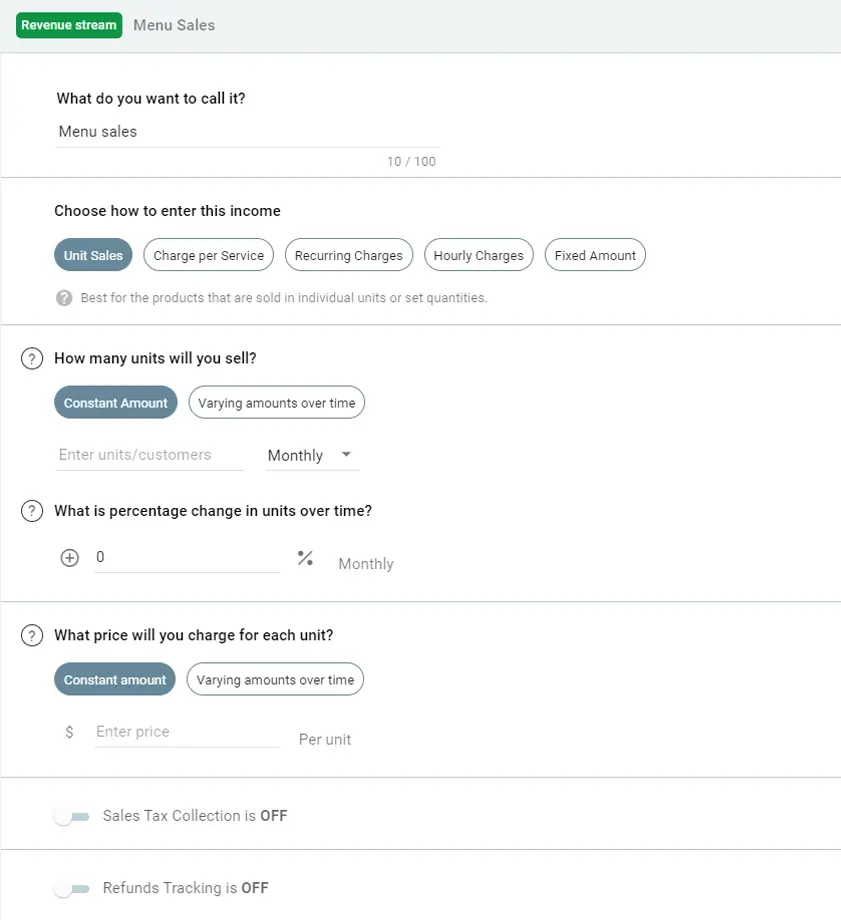
Once you fill in all the details, a forecasted sheet will appear which you can further edit and modify.
Finally! Your forecasts are ready. You can save and alter it at any time.
Compare your actual financial data with planned projections

2. Put the actual data and compare both
Now that forecasts are ready, go to the actual tab from the top-left menu to get the actual data.
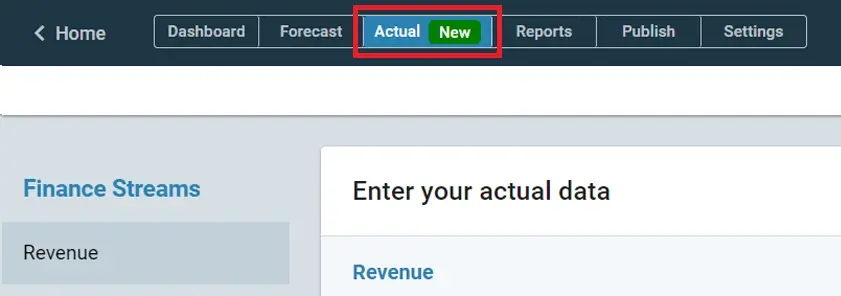
For importing the actual data, you will get 3 options:
Though there are three methods, for both the integrations Xero and QuickBooks the process works similarly. Let’s see how:
Integration with Xero or QuickBooks
Integrating Xero or QuickBooks with Upmetrics enables automatic financial data transfer, allowing for immediate comparison with your forecasts to achieve a clear view of your financial performance. Let’s connect Xero and how it works.
(We’re using “XERO” to explain the process here. It’s the same for Quickbooks as well.)
Go to the Xero website and create an account if you don’t already have one. After signing up, input your business details, set your accounting preferences, and link Upmetrics to Xero for automatic data synchronization.
Further, for comparison, you need to log in to Xero from Upmetrics by clicking on “Connect to Xero”.
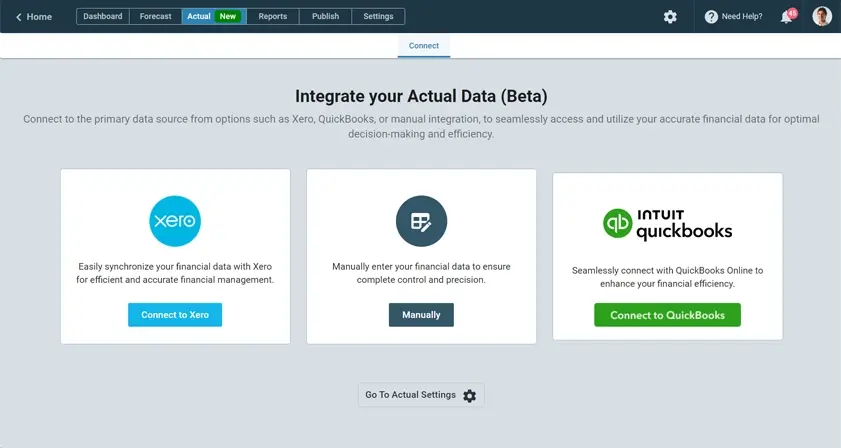
This will take you to the login page of Xero, once you add the credentials—allow access to Upmetrics to import the actual data directly.
Once you’re logged in with Xero you’ll get all the charts of accounts prepared in Xero on the left-hand side, as shown in the below picture:
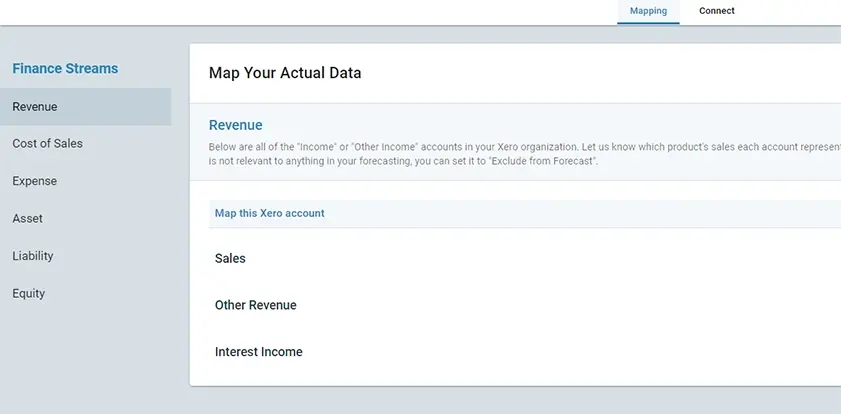
Then, click on any charts of accounts you want to work on. We’re taking an example of the revenue stream here.
First, you need to map the unmapped revenue streams with corresponding Upmetrics forecast categories like this in the below picture:
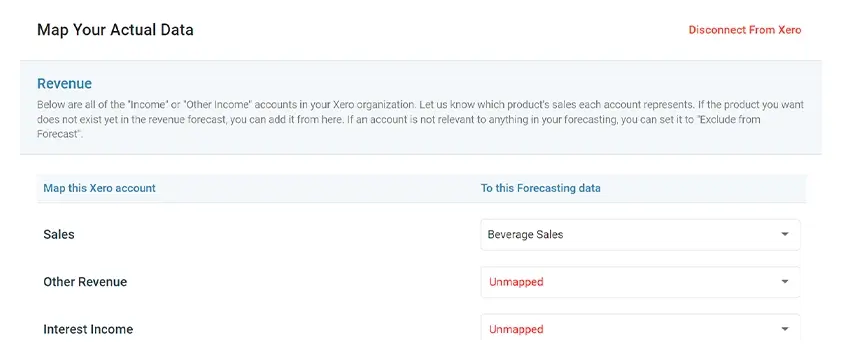
To select the corresponding Upmetrics forecast category, just select the drop-down and select the relevant category like below:
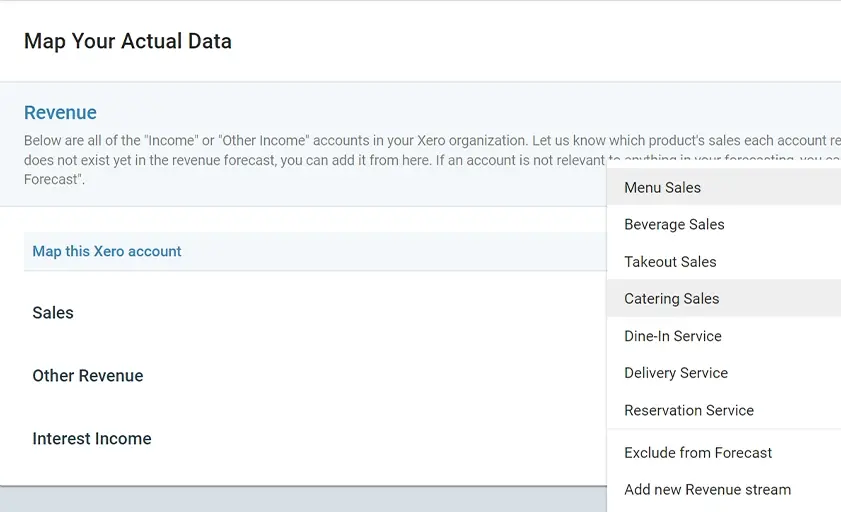
You can even add a new revenue stream here for the mapping. From the same drop-down, you can even exclude a particular category from the forecast.
Once the categories are mapped, you can see the comparison of actual and forecasted data from the reports section of the top left corner. The comparison table will look like the picture below:
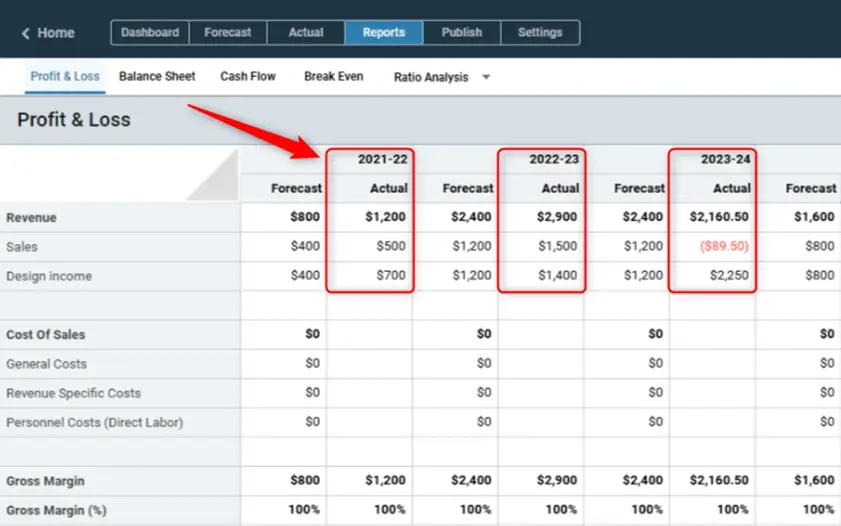
The negative variances will be highlighted in red so you can identify the areas of improvement for your business with a glance.
Visualize the data with the Upmetrics dashboard
While your plan vs. analysis report should be ready following the above steps, visual reports are crucial to better understand and present your financial health.
Upmetrics’ visual dashboard helps you turn complex financial reports into easy-to-understand visuals, allowing you to track and compare critical financial metrics easily.
Here’s how you can visualize the data through our dashboard:
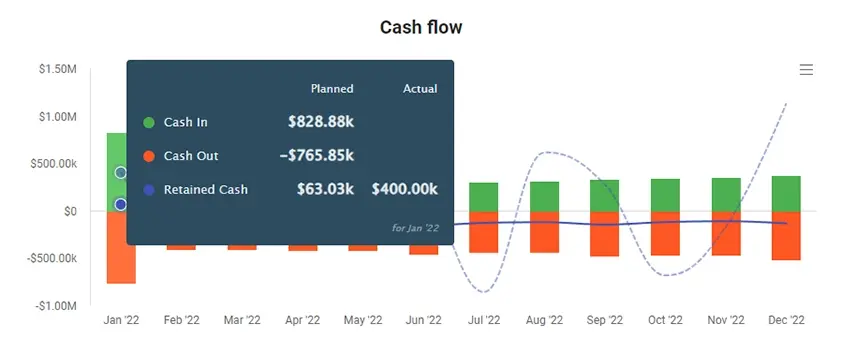
Cash flow is shown with green bars for income, red bars for expenses, and a blue line for retained cash, highlighting surplus or deficit months.
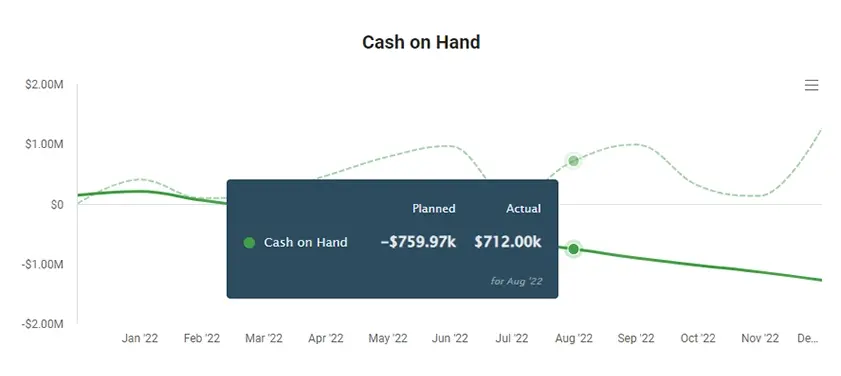
Cash on hand offers insight into long-term profitability and liquidity, letting you compare actual vs. forecasted data at a glance.
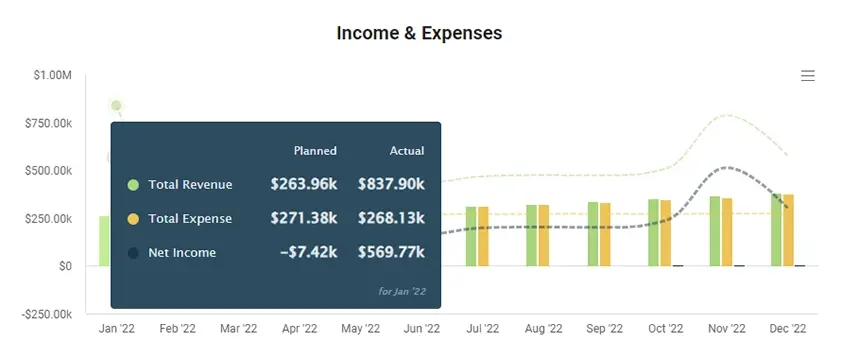
The income & expenses chart uses colors to display revenue, expenses, and net income, making it easy to track profits or losses.
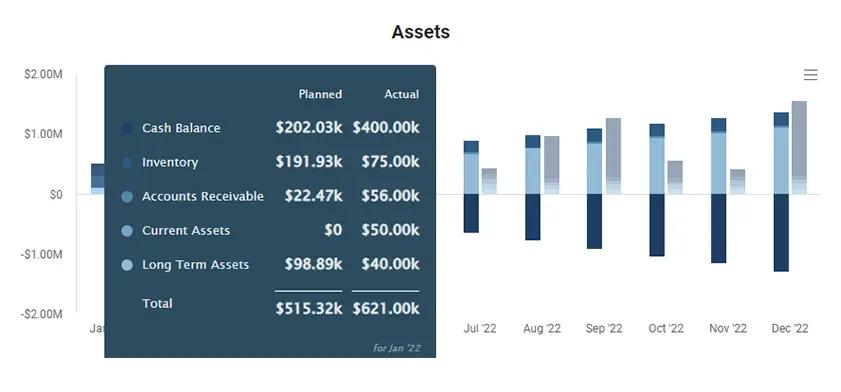
Asset charts present the value and distribution of your business’s assets over time, helping you track growth or depreciation by comparing actual and forecasted data.
Variances
It is the basic difference between planned and actual data. The table below shows the variances for 2 months (due to space constraints) with the percentage of change.
The formula to calculate variance is: Variance = Actual−Planned
The formula for variance percentage is: Variance % = (Actual−Planned/Planned)×100
Though you don’t need the formula, accounting software or ChatGPT will do that for you.
Let’s see an example to better understand variances:
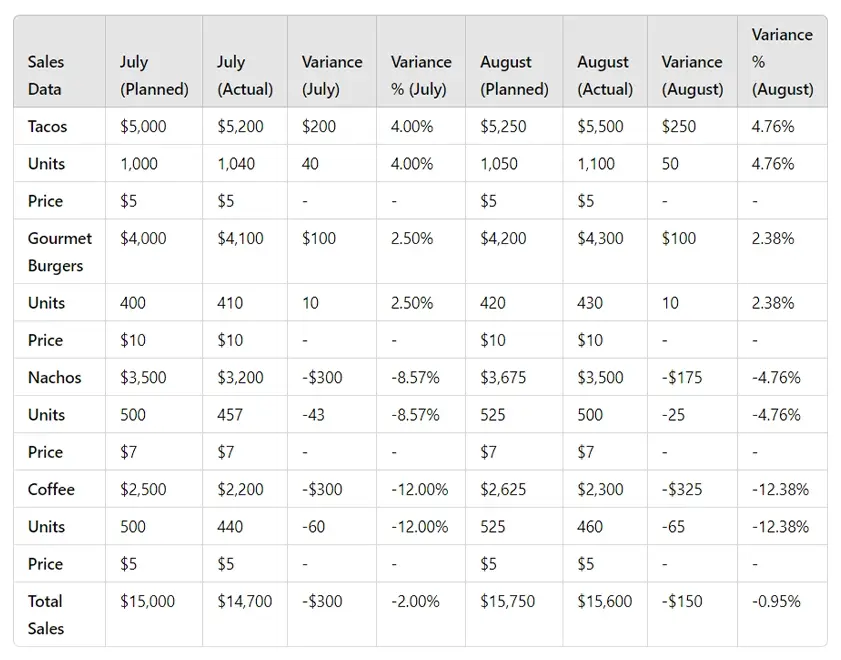 From the above example, the positive variances are:
- Tacos: Actual sales exceeded planned sales each month, with variances of $200 (4.00%) in July and $250 (4.76%) in August.
- Gourmet Burgers: Actual sales were consistently higher than planned, with variances of $100 (2.50%) in July and $100 (2.38%) in August.
The negative variances are:
- Nachos: Actual sales fell short of planned sales each month, with variances of -$300 (-8.57%) in July and -$175 (-4.76%) in August.
- Coffee: Actual sales were consistently lower than planned, with variances of -$300 (-12.00%) in July and -$325 (-12.38%) in August.
Remember, this example focuses on sales, so we considered negative variances bad for the business. However, if the metrics involve expenses, negative variances would be good for the business (who doesn’t love expenses going down?).
So, you need to scan and understand the context of variances before concluding any results. In conversation with Matt Little—Founder and Managing Director of Festoon House, an e-commerce company—he emphasized the importance of understanding the context.
He stated, “Simply comparing figures isn’t enough; you need to understand the underlying factors. Did a promotional campaign align with a sales spike? Was there a holiday affecting buying behavior? Identifying the context helps explain discrepancies and improves forecasts.”
Why conduct a plan vs. actual analysis
Plan vs. actual analysis is not only for variances but for a better understanding of the performance of your business. Let’s see why it’s necessary to conduct this analysis:
Identify variances
A plan vs. actual analysis helps to identify differences between planned and actual performance, highlighting areas of overperformance or underperformance. Understanding these variances allows businesses to investigate the underlying reasons and make necessary adjustments.
Improve forecasting accuracy
By analyzing past variances, businesses can refine their future forecasts and make more accurate projections. This historical data provides valuable insights, helping businesses understand trends and improve their forecasting models.
Enhance decision-making
Accurate variance analysis enables business leaders to make informed, data-driven decisions. It helps identify areas where strategic adjustments are needed, ensuring the business stays aligned with its goals and objectives.
Even ChatGPT can help you understand the impact of the variances on your business resulting in effective decision-making.
Financial control and accountability
Regular plan vs. actual analysis provides ongoing monitoring of financial performance, ensuring that the business remains on track with its budget. This analysis holds different departments or teams accountable for their performance, fostering a culture of accountability and continuous improvement.
Adjusting business strategies
The analysis enables businesses to adjust their strategies in response to market changes or unforeseen events, maintaining agility and flexibility. Regular reviews ensure that the business’s strategies are aligned with actual performance and can be adapted as needed.
The bottom line
We’ve covered all the essential steps for conducting a plan vs. actual analysis in this guide. However, our ultimate goal is to ensure you successfully implement this analysis for your business.
Even though the spreadsheet approach can help you, Upmetrics makes it easier and less time-consuming with its powerful financial forecasting feature and integrations.
Just input your data, and let Upmetrics handle the heavy lifting so you can do effective management using the data.
So why wait? Try Upmetrics today!


