Data from CB Insights shows that 29% of startup failures can be attributed to one thing: Running out of cash.
And it rarely comes as a surprise. At least, not to those watching the right numbers.
Cash burn rate is one of those numbers. It measures how quickly your company is spending cash before it becomes profitable, and it serves as a guide for founders on how long they can operate before making a crucial decision, such as raising capital, cutting expenses, or scaling faster.
That’s why tracking your cash burn rate isn’t optional.
In this blog, let me explain what cash burn rate is, how to calculate it, and how to keep it from becoming the reason your business ends up in that 29%.
What is cash burn rate?
Cash burn rate is simply the speed at which your company spends its available cash. In other words, it tells you how quickly you’re using up your cash reserves to cover expenses—whether to pay bills, keep the lights on, and occasionally buy that “essential” team coffee machine upgrade.
Most founders track it monthly so they can see exactly how much runway they have left before needing new revenue or funding.
You’ll almost always see burn rate referenced in the financial section of a business plan, because it connects directly to cash flow forecasts and runway.
In pitch decks, it’s not always shown as a separate metric, but many founders include it under financials or use of funds to make clear how long the money they’re raising will last. Investors care about both: How much you’re spending, and how many months of breathing room that spending allows.
Why is knowing your burn rate so important?
The way I see it, knowing how fast you’re burning through cash gives you control. It gives you the space to make changes before the situation makes them for you.
For founders, burn rate is the early-warning light on your dashboard. It tells you when to slow down hiring, delay a product launch, or push harder on revenue-generating activities.
A founder with 12-15 months of runway can plan calmly and set milestones strategically. A founder with 4 months left, on the other hand, is negotiating with urgency and often giving up leverage, whether with investors, vendors, or even key hires.
For investors, burn rate shows how disciplined you are with capital. It’s not just about whether you’re spending too much; it’s about whether your spending matches the outcomes you claim you’ll deliver.
An investor looking at two startups with the same $500K raise will value the one that can stretch it to 18 months with clear milestones far higher than the one that burns it down in 6 months without hitting targets.
This is why burn rate shows up not only in internal dashboards but also in pitch decks and investor discussions.
And once you know that number, the next step is figuring out whether you’re seeing the whole picture or just part of it. That’s where gross and net cash burn come in.
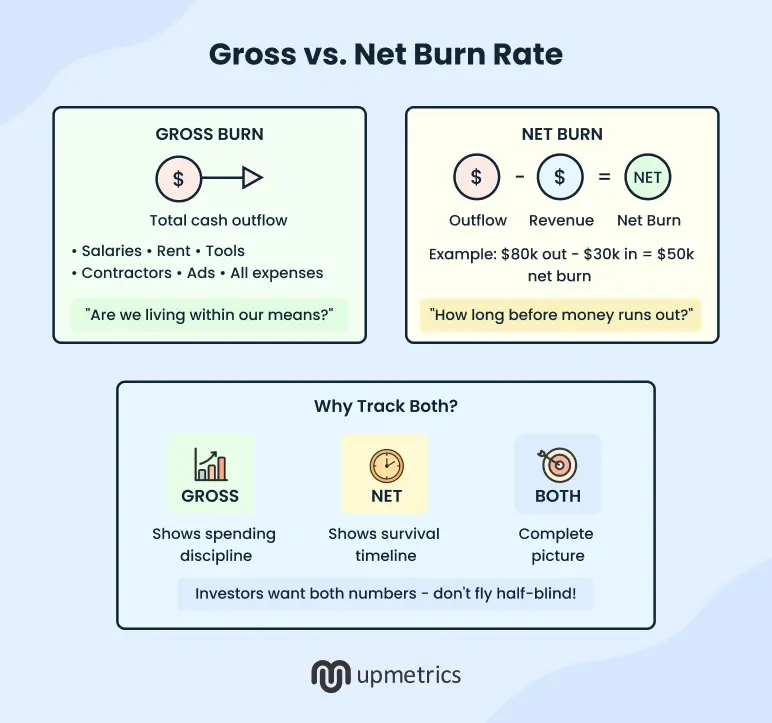
Gross vs. Net cash burn: When to rely on each?
Gross cash burn highlights the weight of your expenses. It’s the clearest way to see if your cost structure is sustainable, even in months when revenue looks good. This number is useful when you’re assessing operational discipline or preparing for funding rounds, since it shows what it costs to keep the lights on.
Net cash burn, on the other hand, shows the reality of your cash runway after revenue offsets some of those costs. It’s the figure that tells you how much time you have before needing more capital. This is the number most useful for short-term planning, like deciding when to raise your next round or when to slow spending.
Founders don’t track both just for investors; they do it to balance two perspectives: How expensive it is to run the business vs. how long they can keep running it with current revenue.
How to calculate cash burn rate (with simple formulas + examples)
The most common surprise in founder meetings isn’t about revenue; it’s when they learn their burn rate is 30-50% higher than they thought.
The culprit? Almost always, hidden expenses don’t show up in the mental math.
The good news is, calculating burn rate isn’t complicated. But accuracy depends on whether you’re factoring in real cash movements, not just accounting entries.
Building this discipline into your forecasts is part of the best cash flow forecasting practices because it prevents founders from being blindsided by expenses that don’t show up in mental math.
Like I mentioned earlier, there are two main ways to look at cash burn rate: gross and net. They give you different angles on the same story, so it’s worth knowing both.
1) Gross cash burn rate formula & example
Gross cash burn rate is the simplest way to get a quick, honest snapshot of spending. It ignores revenue entirely and focuses on one question: How much cash is leaving your business every month?
Formula:
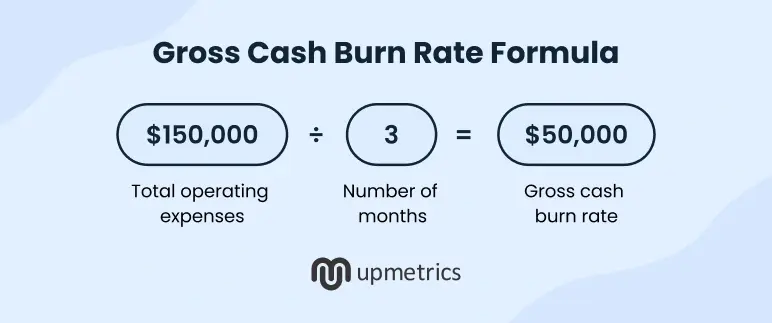
Let’s take a real-world style example:
Your expenses for the last three months total $150,000
Gross cash burn rate = $150,000 / 3 = $50,000 per month
Usually, the mistake founders make is that they pull “expenses” from their accounting system without checking if those numbers reflect actual cash outflows. Gross cash burn should only include money that has actually left your bank account, not just invoices you’ve received or expenses accrued on paper.
In practice, that means counting:
- Salaries and contractor payments (when paid, not just when processed)
- Rent and utilities
- Software subscriptions and tools
- Marketing and operational spend
Why is this distinction so important? Because your runway (how long you can operate before running out of cash) depends on actual spend.
2) Net cash burn rate formula & example
Net cash burn rate is the more realistic version because it factors in revenue. It’s especially useful if you have a steady income, like a SaaS company with paying subscribers.
This is the number investors care about when they’re assessing how far your current cash will actually take you. It tells them and you how much money is truly leaving the business each month after your income offsets some of the costs.
Formula:
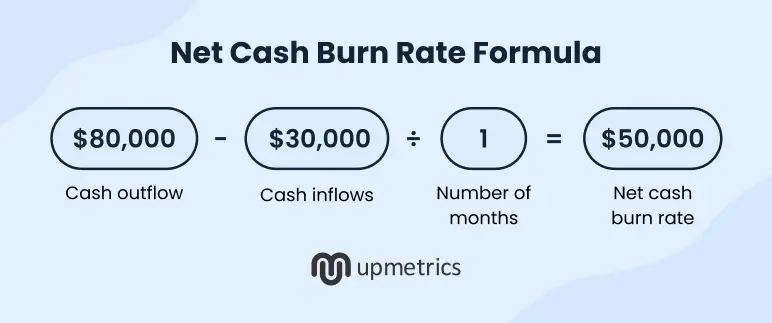
Example:
Let’s say your business spends $80,000 per month, but you bring in $30,000 in recurring revenue:
Net cash burn rate = ($80,000 – $30,000) / 1 = $50,000 per month
That’s the number you should plan around. If you have $500,000 in the bank, that’s roughly 10 months of runway, not the six months gross cash burn would suggest if you ignored income.
On its own, burn rate is just a monthly expense number. But that number doesn’t tell how much cash you have left. Spending $80,000 a month can feel risky or perfectly safe depending on whether you’ve got $200,000 or $2 million in the bank.
That’s why the next step is calculating your runway: The number of months your current cash reserves can support your burn.
Manually tracking burn rate leaves room for costly errors
Track your burn rate and runway in real time

How to estimate your runway using cash burn rate?
Runway is the amount of time your business can operate before the cash runs out. Once you know your net cash burn rate, figuring out your runway is simple.
Formula:
For example, if you have $400,000 in the bank and your net cash burn rate is $50,000 per month:
Runway = $400,000 / $50,000 = 8 months
That’s 8 months before you’ll need more revenue, more funding, or a spending change. The tricky part is that many businesses misjudge this because they overestimate future income or forget about irregular, one-off costs.
Things like annual software renewals, big equipment buys, or legal fees can hit in a single month and quietly shorten your runway. Basically, what I mean is to be conservative. Round revenue down, round expenses up. It’s far better to be pleasantly surprised than to be blindsided.
Across US small businesses, only 34.7% survive past their 10th year (BLS data), so building a conservative runway target isn’t just smart; it’s survival.
Once you know your runway, it’s easier to set priorities, focus the team, and choose the right growth pace. It tells you when to hire, when to raise funds, and when to pull back before the bank balance forces the decision for you.
How to reduce cash burn without compromising sales?
If your cash burn rate feels higher than you’d like, the math is simple: Spend less, bring in more, or both. But the real challenge is doing it without killing your growth momentum or scaring off investors.
Let’s look at some practical approaches that keep your business moving forward while easing the pressure on your bank account:
1) Increase your revenue
Instead of immediately cutting expenses, look for ways to bring in more cash.
Test upsells, add premium pricing tiers, or improve your sales process so each customer is worth more over time. Even a small bump in revenue per customer can meaningfully extend your runway.
2) Adjust payroll and hiring
Headcount is often the largest expense for startups. Delaying non-critical hires or reshaping certain roles can free up cash quickly.
The key is to do it strategically. Avoid trimming core positions that drive sales or product development, since those cuts could harm growth long-term.
3) Cut operating costs that don’t add value
Recurring costs add up fast. Review your vendor contracts, software subscriptions, and discretionary spending to identify expenses that don’t directly contribute to revenue or efficiency.
Renegotiating, consolidating tools, or cancelling unused services can make a noticeable impact without much downside.
4) Focus on profitable offerings
Not every offering delivers equal value. If some products drain resources without delivering meaningful profit, consider pausing them.
Redirecting focus to your strongest revenue drivers ensures that your cash is being invested where it creates the most return.
5) Improve cash flow discipline
Send invoices promptly, tighten payment terms, and follow up on collections to bring money in faster.
On the flip side, use supplier payment terms fully instead of paying bills earlier than necessary. Better cash flow management can reduce strain without touching your topline or growth strategy.
All of these tips sound simple, but the hard part is knowing which ones will work for your business. That’s why it helps to model out scenarios before acting. Planning tools like Upmetrics let you simulate changes to expenses, pricing, or hiring so you can reduce burn while keeping a growth story that still inspires confidence.
How to factor cash burn rate into your financial projections?
Cash burn isn’t just a figure you calculate once; it’s a number that shapes how believable your financial story looks to investors. If your projections only show topline revenue growth and profit targets but ignore cash burn, they feel incomplete.
The right way to factor it in is to show where the money is going, how long it lasts, and what it buys you in progress. That’s what investors care about..
Here’s how burn rate fits into your projections at a high level:
- In the cash flow forecast, it highlights how quickly cash is moving out of the business each month and how much runway you have left.
- In the use of funds, it explains what investor capital will specifically cover, like hiring, marketing campaigns, product launches, or operations.
- In the financial summary, it ties back to the bigger picture: how today’s spending sets you up for hitting revenue milestones or breaking even in the future.
From an investor’s perspective, a standalone burn rate can sound like a risk signal. When you anchor it to clear milestones like user acquisition, retention gains, or a product release, it reframes the conversation as a strategic use of capital.
That’s the difference between “we spend $70K a month” and “we invest $70K a month to drive 1,000 new signups and launch a beta product.”
The bottom line
A lot of founders treat burn rate like it’s just another box to tick for investors. The problem is, if that’s all you see it as, you miss its real value.
When you know exactly what’s driving your burn and how it’s tied to your milestones, you can make better calls. You’ll know when to hire, when to slow down, and when it’s worth pushing harder. That’s the kind of thinking investors want to see.
The challenge is keeping those numbers accurate and up to date. Spreadsheets can work for a while, but they’re messy, easy to break, and don’t give you quick answers when you need them most.
Upmetrics makes burn rate tracking simple; you can link it directly to your milestones, run “what-if” scenarios, and see your runway in real time. You’ll have a clear, reliable view that you can share with your team or investors anytime. It’s the kind of clarity that keeps you in control, no matter how fast things move.
Frequently Asked Questions
What is a good cash burn rate for a startup?
How do I calculate the monthly cash burn rate?
What’s the difference between burn rate and runway?
Is burn rate the same as net loss?
Can the cash burn rate be positive?
Upmetrics
Upmetrics is the #1 business planning software that helps entrepreneurs and business owners create investment-ready business plans using AI. We regularly share business planning insights on our blog. Check out the Upmetrics blog for such interesting reads. Read more