There is no single “best” sales forecasting method. If there were, every founder would use it, every sales team would hit target, and spreadsheets would stop causing panic on Monday mornings.
The answer depends on how your business actually sells.
A startup with no sales history needs to test demand first. A B2B company with a CRM uses opportunity stages. A SaaS business splits new sales from renewals. An established business starts with past sales, then adjusts for seasonality, pricing changes, and market shifts.
Sales forecasting is the process of estimating future sales revenue for a specific period using data like past sales, pipeline value, lead volume, close rates, deal size, and market conditions.
This guide focuses on the sales side of forecasting. It compares 8 methods, walks you through the math, and helps you pick the one that fits.
What is sales forecasting?
Sales forecasting is how you estimate future revenue, usually over the next 1, 3, 6, or 12 months. Not to be confused with demand forecasting, which is about how many customers want to buy in the market overall.
If you have an established business, you can lean on your own track record to forecast. And if you’re new, you work with what you can find. It could be conducting a small test launch, measuring how many leads are coming in, looking for industry numbers from places like IBISWorld, or economic stuff like interest rates and consumer confidence.
Types of sales forecasting methods
Here are the methods I have been using over the years, both for my own business and the founders I’ve worked with.
Quick note before we dive into the methods: Every method gives you a different kind of. Before we get into each one, here’s a table to help you narrow it down.
| Sales forecasting method | Best for | Data needed | Accuracy | When to avoid |
| Length of sales cycle forecasting | Short-cycle B2B sales with a consistent process | Average sales cycle length and first-touch date | Moderate | Avoid when sales cycles vary by more than 50% from deal to deal. |
| Lead-driven forecasting | Businesses that track leads by source | Leads per month, close rate by source, and average sale value | Moderate | Avoid when lead sources change often or lead quality is inconsistent. |
| Opportunity stage forecasting | Sales teams using a CRM with defined pipeline stages | Pipeline value and win rate by stage | Moderate to high | Avoid when stages are subjective or reps do not update the CRM regularly. |
| Intuitive forecasting | New businesses or teams with limited sales history | Sales rep judgment, buyer conversations, and deal context | Low | Avoid when reps are overly optimistic or there is no review process. |
| Test-market analysis forecasting | Pre-launch products, new markets, or pricing tests | Pilot conversion rate, average revenue per user, and test-market size | Moderate | Avoid when the test audience does not match your real target market. |
| Historical forecasting | Established businesses with at least 24 months of sales data | Past sales, growth rate, churn, and seasonality | Moderate | Avoid in volatile markets or after major pricing, product, or channel changes. |
| Multivariable analysis forecasting | Data-mature teams with complex sales cycles | Deal size, stage probability, rep history, lead source, sales cycle, and seasonality | High | Avoid when you lack clean data or analytics support. |
| AI or predictive forecasting | Teams with clean CRM data and enough sales history | CRM data, engagement signals, past close rates, and market or seasonal patterns | High | Avoid when CRM data is incomplete, outdated, or too thin to train the model. |
Length of sales cycle forecasting
Length of sales cycle forecasting figures out when a deal will close based on how long similar deals took in the past.
It works something like this. You examine your last 6-12 months of closed deals and figure out how long it takes from someone first reaching out to actually signing. Apply that same number to the deals you have open right now.
Expected close date = First contact date + Average sales cycle length
If most of your customers move through your process at roughly the same pace, the average will hold. But if your sales cycle varies wildly (say, 10 days to 6 months depending on whether the customer needs budget approval), the average is mostly noise. Use this as a rough timing check on top of another method instead.
Lead-driven forecasting
Lead-driven forecasting estimates your revenue based on how many leads come in and how many of those usually turn into customers.
Expected revenue = Number of leads × Average sale value × Close rate
Say you got 200 leads last month, your average sale is $1,200, and you close 8% of leads. The math works out to: 200 × $1,200 × 0.08 = $19,200
If your sales cycle is longer than a month, those 200 leads aren’t all going to close next month. Shift the forecast into the months they’re actually going to close in.
This method works only when your lead tracking is solid and your channels are fairly steady. If you scale up ads, raise prices, or hire more reps, the old close rate doesn’t apply anymore.
Opportunity stage forecasting
Opportunity stage forecasting estimates revenue based on where each open deal sits in your sales pipeline. Instead of treating every deal equally, it weights them by their likelihood of closing.
A deal in discovery has maybe a 10% chance of closing. One in negotiation, more like 75%. The closer the buyer is to deciding, the more that deal counts toward your forecast.
Expected revenue = Deal value × Probability of closing
The probabilities should come from your own history, not some generic template. If 50 deals hit Proposal last year and 25 closed, that’s 50% for Proposal.
Here’s what calibrated stage probabilities tend to look like:
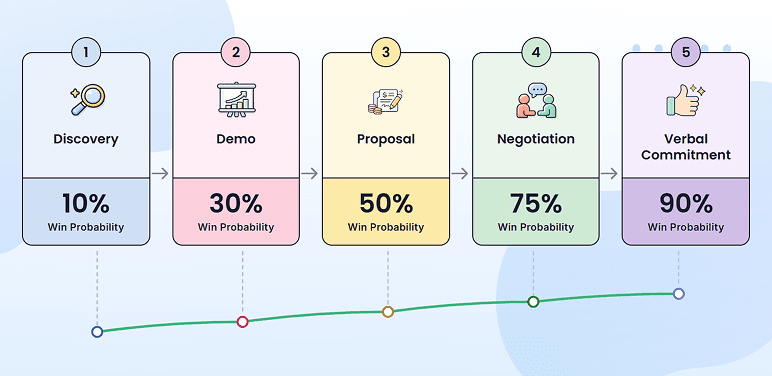
For this to work, you need a CRM that handles win probabilities per stage. Most of the popular ones do, including Salesforce, HubSpot, Pipedrive, and Close.
The catch is that stages have to mean something. If your reps move deals to “Proposal” just because they had a good call, the forecast inflates fast.
Intuitive forecasting
Intuitive forecasting is when your sales reps look at each deal they’re working on and predict which ones will close, based on what they’ve picked up from talking to the buyer. They literally use their intuition, which is where the name comes from.
The reason this works at all is that reps actually know things the data doesn’t. They can tell you whether the budget’s real, whether the buyer is serious, whether a competitor is sniffing around. That stuff doesn’t show up in a CRM.
But you don’t just take their word for it. Make them show you the receipts:
- Last contact date
- Confirmed decision-maker
- Confirmed budget
- Competitor mentions
- Timeline to buy
- How the deal has moved between stages
If they’ve got those, fine, the forecast will hold up to scrutiny. This method, however, works if you’re early-stage, your sales team is new, or you just don’t have a year of solid data yet.
Test-market analysis forecasting
In the test-market analysis method, you run your product, pricing, or sales approach on a small scale before launching it broadly, and use that data to forecast the bigger picture.
It works something like this. You pick a slice of your eventual market: one city, one customer segment, one beta group, one sales channel, and launch your product/service there for a couple of months and track:
- What converts
- What people spend on average
- Who sticks around
- What they say about it
Then you take those numbers and figure out what the whole market would probably do.
Expected revenue = Total target market × Conversion rate × Average revenue per customer
Say a SaaS company runs an 8-week test in Austin. The conversion rate comes in at 4%, and the average revenue per customer is $1,200. The broader market has 50,000 prospects. So the expected revenue would be: 50,000 × 0.04 × $1,200 = $2.4 million
The thing is, that number only holds if Austin actually looks like the rest of the market. Sometimes the city you picked is younger, richer, or has fewer competitors than the country at large, and the forecast comes in much rosier than reality.
Historical forecasting
If your business has been running steadily for a couple of years, historical forecasting is the best way to estimate your future sales.
Based on your past revenue, you have to figure out how fast or slow your company is growing, or if at all it’s growing. Once you have figured that out, account for the things that change month to month. It usually involves churned customers, seasonality, price changes, basically anything that shifts in your market.
Then, you can calculate the estimated revenue for the next month
Forecasted revenue = (Last period revenue × (1 + growth rate)) − (Last period revenue × churn rate)
And if it’s a subscription-based business, you can do the same thing with Monthly Recurring Revenue (MRR) instead of total revenue.
The catch is that historical forecasting only works when your past actually predicts your future. If you’ve just changed prices, launched a new product line, lost a major customer, or the market is shifting fast, the trend you’ve been on isn’t the trend you’re about to be on.
Multivariable analysis forecasting
When you combine multiple factors like your rep’s track record, deal size, lead source, etc., to make a sales forecast, that approach gives you a multivariable analysis forecasting.
Some of the relevant factors you can choose for this approach include
- Pipeline stage probability
- Rep close history
- Deal size band
- Sales cycle length
- Lead source
- Seasonality
- Past forecast accuracy
Once you have decided on the factors, you have to calculate the weighted probability. It is just the combined chance of a deal closing once you’ve taken all your chosen factors into account.
Weighted probability = average of all relevant probabilities (or a weighted average if some factors are stronger predictors)
The simplest way is to average the close rates for each factor. If you know one factor is more reliable than the others (rep close history usually is), you give that one more weight. Now, for the forecasted revenue,
Forecasted revenue = Deal value(the total dollar amount you’d earn if this specific deal closes) × Weighted probability
AI / predictive forecasting
This process is just multivariable analysis, except that forecasting software does it for you. Basically, AI does the work. It combines all the sales factors and recalculates the forecast as deals progress, just much faster and continuously.
It’s looking at the same things a sales leader would: deal stage, lead source, deal size, how long deals usually take, who’s selling them, what emails got opened, who showed up to the demo. The difference is the software is doing this every time something in your CRM updates, not once a week when you sit down to review.
This works when you already have clean data in your CRM and at least a year of sales behind you. Some enterprise CRMs ship with AI forecasting built in, so if you’ve got one, check what’s already available before paying for an add-on.
If your business is brand new, skip this for now. There’s no past data for the AI to learn from, so the forecast it gives you is just a guess with a fancy interface. Start with test-market analysis, intuitive forecasting, or lead-driven forecasting until you’ve got enough history.
AI saves you time and spots patterns you’d probably miss on your own. What it can’t do is fix sloppy CRM habits.
How to choose the right sales forecasting method
By now, you probably have an idea of which method fits your business to predict sales. In case you’re still unsure, you can think in the direction that answers questions like:
- What am I actually forecasting for? Cash flow, hiring, fundraising?
- How much sales data do I actually have right now?
- How long does it take my customers to buy?
- How much time can I realistically spend keeping this updated?
Those four questions are the right starting point. Work through them in order:
#1. Your objective could be cash flow, hiring, inventory, fundraising, or product launch. Different goals lean on different methods. A fundraising forecast needs to defend itself in front of an investor. A monthly cash flow forecast just needs to be roughly right.
#2. Your data could be none, a few months, or two-plus years of clean records. The honest answer to this question rules out half the methods immediately.
#3. Your sales cycle is either short or long. Customers who decide in a day vs. customers who take six months and three approvals are fundamentally different forecasting problems.
#4. Your team’s capacity decides what you can realistically maintain. A method nobody updates is worse than a simpler method everyone uses. Be honest about what you’ll actually keep up with.
Once you’ve thought through those, here’s a rough mapping of the data situation to the method:
- If you have no sales history, start with test-market or intuitive forecasting.
- If you track leads or deals coming in, lead-driven or opportunity stage forecasting will fit best.
- If you have some data but your CRM is messy, use intuitive forecasting as a cross-check on opportunity stage numbers until the data is trustworthy.
- If you have 24+ months of sales data, historical forecasting is your strongest option.
- If you have clean CRM data and the analytics capacity to handle it, multivariable or AI forecasting is where you’d land.
It’s not the only way to decide, though. When the stakes are higher (fundraising, big hiring decisions, board meetings), you can run two methods side by side: one numbers-based, one judgment-based.
If they land in the same direction, you will have a forecast worth defending.
One last thing before you start running numbers. If you sell a one-time product or service, you can skip the next section. If you run a subscription or SaaS business, there’s one more split worth making.
Run every forecasting method on autopilot with AI

New business vs. renewals (B2B SaaS only)
If you run a SaaS or subscription business, by now you’re probably thinking if you can use the same way to forecast renewals, or if you should just lump them into one number, or how to account for customers who are about to leave.
You can’t forecast renewals using the new-business methods you just learned (lead-driven, opportunity stage, all of those). Renewals and new business behave nothing alike, so they need their own track.
New business depends on
- pipeline
- demos
- close rates
- deal size
- sales cycle length
And renewals depend on
- customer health
- product usage
- contract terms
- churn risk.
So you forecast them on separate tracks, then add the two together:
New business forecast = pipeline value × close probability
Renewal forecast = renewal base × expected retention rate
How accurate is your forecast? (A quick reliability check)
Your forecast doesn’t need to be exact; just close enough that you can make decisions on top of it. The simplest way is to compare what you forecasted against what actually happened, month over month.
Forecast variance = (Forecasted sales − Actual sales) ÷ Actual sales × 100
Say you forecasted $100,000, and actual sales came in at $90,000. Your variance is 11.1%, which means the forecast is too optimistic.
For most small businesses, keeping variance within 10-15% is a fair target. But the bigger question is the pattern. Are you off by 5% one month and 20% the next, or are you consistently coming in too high?
If you’re consistently too high, it could be an inflated close rate, or you’re counting deals that aren’t really in play yet. If you’re consistently too low, you might be missing renewals, repeat purchases, referrals, or seasonal demand.
It’s more than enough to check the accuracy of the sales forecast if you run a simple monthly report by answering questions like
- Did the forecast and actual sales land in a reasonable range?
- Are we consistently over or under?
- Is the CRM updated before we run this?
- Are we separating new sales from renewals where it matters?
- Are we updating monthly, or only when we remember to?
You don’t need MAPE (Mean Absolute Percentage Error) or RMSE (Root Mean Square Error) for any of this. A simple variance check tells you whether the forecast is doing its job or whether your assumptions need rework.
Sales forecasting examples
Here are three worked examples, each using a different method on a different kind of small business. Pick the one closest to your business and follow the math through.
Example 1: A small consulting firm forecasting from its pipeline
Say you run a 3-person B2B consulting firm. You have three live deals in your pipeline this month. To forecast next month’s revenue, you’d use opportunity stage forecasting (method 3) because you can track each deal’s progress and assign a closing probability based on stage.
| Opportunity | Deal value | Closing probability | Forecasted revenue |
| Phone call | $2,000 | 30% | $600 |
| Pitch | $3,000 | 40% | $1,200 |
| Offer sent | $2,400 | 70% | $1,680 |
Total forecasted revenue: ($2,000 × 0.30) + ($3,000 × 0.40) + ($2,400 × 0.70) = $3,480
Even though your full pipeline value is $7,400, your forecasted revenue is $3,480 because not every deal is equally likely to close. The $7,400 is what your pipeline is worth on paper. The $3,480 is what it’s actually worth this month.
Example 2: A digital agency forecasting from incoming leads
A small digital marketing agency gets leads from three different channels: referrals, paid ads, and a free template download. The quality varies a lot across channels. To forecast revenue, the agency uses lead-driven forecasting (method 2) segmented by lead quality, because close rates and deal values vary too much to treat all leads the same way.
| Lead group | Number of leads | Close rate | Average deal value | Forecasted revenue |
| Group A: High-fit leads | 20 | 40% | $5,000 | $40,000 |
| Group B: Mid-fit leads | 50 | 20% | $3,000 | $30,000 |
| Group C: Low-fit leads | 100 | 5% | $2,000 | $10,000 |
Total forecasted revenue: $80,000
Twenty strong leads (Group A) are worth four times more than a hundred weak leads (Group C). That’s the whole point of segmenting. A blended close rate would have hidden the gap and overstated the low-fit channel.
Example 3: An established e-commerce store forecasting next month from history
An established e-commerce store has three years of monthly revenue data and no real sales cycle. Customers buy direct, so there’s no pipeline to model. The store uses historical forecasting (method 6) because past revenue is the strongest signal for what comes next.
Last month, the store made $300,000. Trailing monthly growth is 3%, and the expected return rate (the e-commerce equivalent of churn) is 1%.
Forecasted revenue: ($300,000 × 1.03) − ($300,000 × 0.01) = $306,000
The forecast for next month is $306,000. Notice how small the adjustment from $300k looks. That’s because steady businesses don’t grow in dramatic leaps. Historical forecasting works best for exactly this kind of incremental projection.
If you want a step-by-step operational walkthrough rather than worked numbers, see our guide to how to forecast sales for your business.
Want a faster start? Download our free sales forecast template and drop your own numbers into the same structure used in these three examples.
Build your financial forecasts with Upmetrics
You have the methods, the formulas, and three worked examples. Now run the math on your own pipeline, leads, or sales history.
If you want to skip the spreadsheet setup, Upmetrics can help you build sales and financial forecasts in one guided workflow. You can plug in your own assumptions, run multiple scenarios side by side, and connect the sales forecast directly to your cash flow, expense, and full financial projections.
Pick the method that fits, plug in your numbers, and build the forecast in Upmetrics.
The Quickest Way to turn a Business Idea into a Business Plan
Fill-in-the-blanks and automatic financials make it easy.
Frequently Asked Questions
Which sales forecasting method is most accurate?
What's the difference between a sales forecast and a sales target?
What's the difference between top-down and bottom-up sales forecasting?
Is sales forecasting the same as financial forecasting?

Vinay Kevadia
Vinay Kevadiya is the founder and CEO of Upmetrics, the #1 business planning software. His ultimate goal with Upmetrics is to revolutionize how entrepreneurs create, manage, and execute their business plans. He enjoys sharing his insights on business planning and other relevant topics through his articles and blog posts. Read more