As a VC analyst, whenever I’m reading a business plan in a new industry or a company expanding into a fresh segment—the first question I ask is:
How big is the market?
TAM, SAM, and SOM are the acronyms that answer it.
They’re the standard market size metrics investors and VCs rely on to separate broad potential from realistic opportunity.
In this guide, I’ll break down exactly what TAM, SAM, and SOM mean, how to calculate them, and how some of the world’s most successful companies used these numbers in their early pitches.
By the end, you’ll know how to turn three confusing acronyms into one powerful market story.
What do TAM, SAM, and SOM actually stand for?
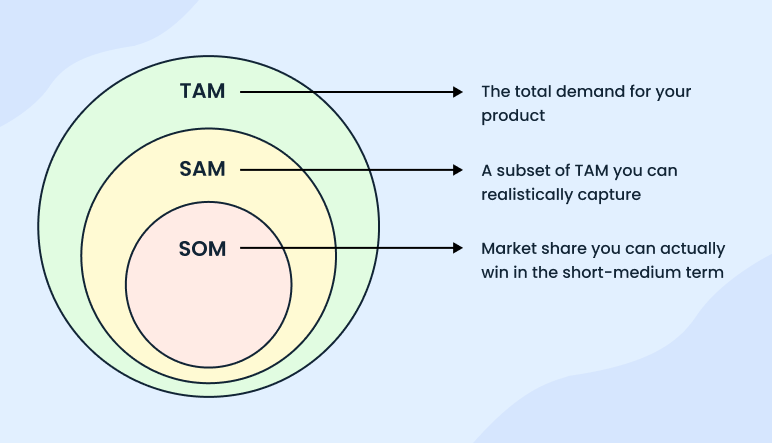
TAM, SAM, and SOM are fundamental market sizing components that help represent the market your organization operates in. They’re acronyms for Total Addressable Market (TAM), Serviceable Addressable Market (SAM), and Serviceable Obtainable Market (SOM).
These sizing components coexist and are often used by investors to gauge the lucrativeness and growth potential of your business idea.
Think of TAM, SAM, and SOM as a funnel that helps you zoom from the broadest possible market view down to your realistic, achievable market share.
Without these metrics in your business plan, you’re essentially telling investors:
“Trust me, people need our solution.”
But with these key metrics, you back your claims, telling exactly how big your business opportunity is, where you fit, and what you can realistically capture.
TAM SAM SOM: Definitions
TAM, SAM, and SOM build on each other like an interconnected VENN diagram.
While TAM shows the maximum potential of your entire market, SAM removes the segments you can’t realistically serve. SOM, however, accounts for the competition and resources and gives you a market share you can actually achieve.
Let’s now understand each of these key metrics in detail while referring to Airbnb’s market sizing components from its pitch deck:
1) TAM (Total Addressable Market)
TAM is the total available revenue opportunity for your product or service. That is, how much could your business theoretically achieve if every single person who could potentially use your product actually bought it.
TAM doesn’t account for real-world constraints such as geography, competition, or resource scarcity. It simply represents the maximum possible market size in an ideal scenario.
Now, every VC that I know of pays extra attention to TAM numbers. They favor businesses with a large TAM as those generally have enough upside potential. A realistic TAM (non-inflated) confirms that you have validated a thriving market opportunity with untouched segments worth serving.
Example
In Airbnb’s pitch deck, they mentioned TAM as 2 billion+ trips booked annually worldwide. Included every hotel stay, vacation rental, and accommodation booking that could theoretically use Airbnb instead of traditional options.
2) SAM (Serviceable Addressable Market)
SAM is the portion of the TAM that your business can realistically capture.
To get to SAM, you apply filters to your TAM based on the limits of your niche, business model, and geographic reach.
Here, you acknowledge that no product or service, however great, can serve an entire market. So, you pick a segment of customers or market, you can actually reach and serve with your current setup.
For investors, SAM matters because it reflects market maturity and competition. They’ll look at companies chasing the same pie (as you) and decide whether your business has a clear way to stand out.
Your SAM numbers have to reflect scalability potential. It’s only then that the investors would find themselves drawn towards your idea.
Example
Initially, Airbnb focused on budget-conscious travelers who booked their trips online. This segment(aka SAM) represented 532 million trips annually—a slice of TAM they could potentially serve with their services.
In their calculation of SAM, they included all those people who were willing to try alternative accommodations and were comfortable booking through digital platforms.
3) SOM (Serviceable Obtainable Market)
SOM is the size of your SAM; you can actually convert.
Generally, SOM becomes most relevant when you enter the market. However, investors still need these numbers (rough estimations) to understand what you can achieve in the short term.
So, create hypothetical scenarios that can help you back your SOM numbers. It’s based on the SOM that investors will gauge your ability to scale and adapt within a competitive marketspace.
Think of SOM as your most honest market assessment. It accounts for all those real-world constraints that we ignored while calculating TAM, i.e., team size, marketing budget, operational capacity, and direct competition.
Example
In their early pitch, Airbnb projected capturing 10.6 million trips annually. This number reflected what they could realistically achieve with their existing host network, platform capacity, and marketing reach.
How to calculate TAM, SAM, and SOM (practical guide)
As I said earlier, knowing the definitions isn’t enough. It’s equally important to know how to realistically calculate TAM, SAM, and SOM for your business.
1. Define and calculate TAM (Total Addressable Market)
As someone who evaluates business plans daily for venture capital firms, when entrepreneurs ask me what investors scrutinize first, the answer is always market opportunity.
Investors want your TAM upfront because it determines whether your business operates in a market worth their attention and capital.
A well-calculated TAM in your business plan signals that you understand your market landscape and can articulate the size of the opportunity you’re chasing.
Now, there are 2 approaches to calculating your TAM:
Top-down approach
The top-down approach starts with broad market research. Here, you dig into industry reports and secondary published research to get a fair overview of your total market size. You then take the total market size and narrow it down to your specific segment.
Now, keep 3 things in mind when you choose this method:
- Make sure that the report you choose is published by a reputable firm, i.e., Gartner, IBIS World, or Marketresearch.com
- Choose a report that’s published not more than 2 years ago
- Make it easier for your investors and always link to the original data source
- Ensure that the report aligns closely with the market you’re operating in
For instance, if you’re building a SaaS tool for dental practices but rely on a “global healthcare software” market sizing report, your TAM will be unrealistically inflated.
The broader healthcare software market includes everything from hospital management systems to pharmaceutical research tools—none of which relate to your actual addressable market.
Bottom-up approach
In this approach, you build your TAM using previous sales data and pricing. In case yours is a startup with no revenue data, you can use a competitor’s data as a benchmark. If not, you can build fair assumptions based on preliminary surveys and market research.
Here’s the formula to calculate TAM:
TAM = Total Number of Potential Customers × Annual Value per Customer
Considering the same dental practice example, let’s say you would be selling your SaaS software at $500 annually to dental clinics in North America. 430,000 dental clinics are operating throughout the United States, which is your market size.
Using the formula, your TAM for dental practice software would be $2.15 billion.
2. Narrow to SAM (Serviceable Available Market)
To calculate your SAM, understand the core constraints that will limit your reach from the total addressable market (TAM).
These restrictions could be:
- Geographical: Maybe you don’t have the means to serve globally or even the entire country. So you choose a region and focus your efforts there initially.
- Business model restrictions: Maybe your model is more suited for specific segments of customers based on size, budget, or operational complexity
- Regulatory barriers: Maybe you don’t have permission to operate in specific jurisdictions due to licensing requirements or compliance standards
Run this filter to determine a market size that’s a good fit for your product or service. Ignore the competition.
Here’s the formula to calculate SAM:
SAM = Segment of TAM× Annual Value per Customer
Let’s say your dental SaaS software is specifically designed for single dental practitioners. Your research reveals that there are nearly 300,000 solo dental practitioners in your target regions who fit your ideal customer profile.
Using the formula, your SAM for a dental SaaS solution would be $150 million.
Now, remember, investors invest in markets that can maximize their revenue potential. So, try to demonstrate a SAM with a scaling potential.
For instance, mention if you eventually plan to accommodate your dental SaaS software for dermats, ortho, and multi-specialty hospitals.
3. Estimate SOM (Serviceable Obtainable Market)
Now, if your startup is already generating revenue, you can simply use this formula to calculate your SOM.
Here’s the formula to calculate SOM:
SOM = Last year market share× SAM (current year)
But for pre-revenue startups, you will have to layer assumptions step by step. That is,
- Get a benchmark figure: Research your closest competitors and analyze their market share. You can look at their published financial statements, reports, or even track some website data
- Factor in your resources: Evaluate your production capabilities, team size, working funds, marketing budget, and distribution reach to know how much of the SAM you can capture within the operational realm
- Validate with a bottom-up approach: How many target customers would potentially pay for your product/ service? Consider their brand loyalty, pain points, motivations to change, and willingness to try new solutions over established alternatives
Continuing our dental SaaS solution, let’s say there’s only 1 prominent player in the market. With your entry strategy and marketing plan, you can easily capture 120,000 customers in the first year.
That gives you a SOM of $60 Million (120,000* $500).
4. Sanity-check with top-down vs bottom-up
Your calculations of these market metrics should align closely using both the top-down and bottom-up approaches. You see, markets are complex, and different methodologies capture different nuances.
However, if your top-down TAM shows $500 million while your bottom-up calculation shows $50 million, you’ve got a problem. Either your market research is off, or your customer assumptions need serious revision.
So what do you do when there are major differences between these methods:
- Re-examine your data sources: Are you using outdated industry reports? Have you misinterpreted market segments in your top-down approach?
- Validate customer assumptions: In bottom-up calculations, double-check your customer count and spending estimates. Are you being too optimistic about willingness to pay?
- Check geographic alignment: Make sure both methods cover the same geographic markets and customer segments.
At this stage, also look out for the discrepancies between TAM, SAM, and SOM.
- If the gap between your TAM and SAM is extremely high, it can indicate that the market is saturated, and the cost to acquire new customers would be expensive.
- Is your TAM rightly sized? Extremely high TAM figures make investors skeptical about your market understanding, while extremely low TAM suggests limited growth potential and may not justify their investment
- You don’t want to claim 40% SOM if you can’t back it with substantial evidence of competitive advantage or unique market positioning.
Align the expectations and fix your assumptions before presenting these numbers in your strategic business plan.
5. Present clearly in your business plan
Now, present these market size metrics in the market analysis section of your business plan or a pitch deck.
You can use layered Venn diagrams to show these figures. But don’t overcrowd the slides with details. Interlink the source data or add footnotes for investors to refer to.
Keep it neat and simple. And that’s pretty much how you give investors the key market size insights without overwhelming them.
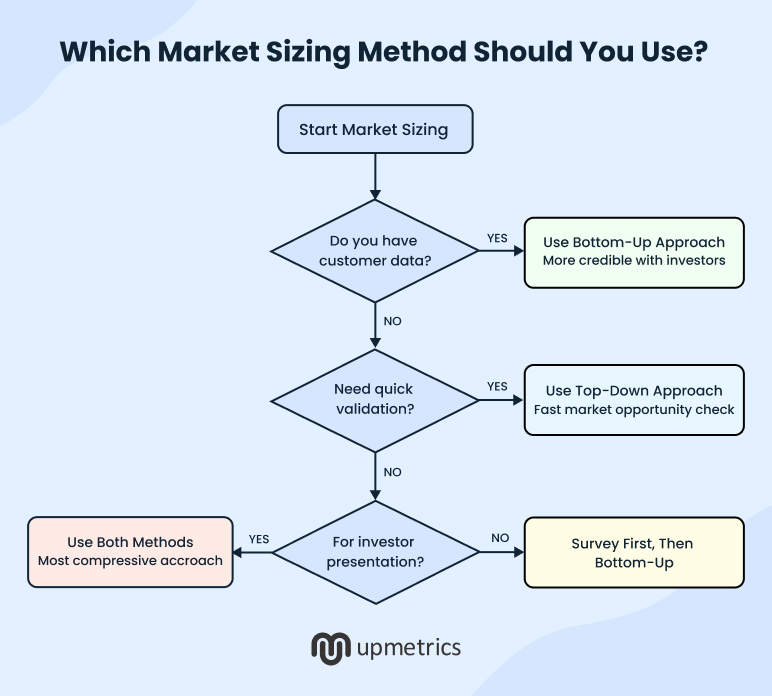
Top down vs. bottom up: What is the right approach?
Top-down is saying, “The global SaaS market is $195B, so capturing 0.5% gives us a $975M opportunity.”
Bottom-up is saying, “We can realistically acquire 50,000 subscribers paying $1,000/year. So our market opportunity is $50M.”
Between these methods, most founders resort to the top-down approach to calculate their TAM. And I get it—in my years as a VC analyst, I’ve seen this pattern repeatedly.
But that’s not what you need. You need realistic estimates, and only bottom-up can force you to think granularly about your customers. It makes you dig into real customer needs, spending patterns, and your actual capacity to serve them.
You may get conservative figures with the bottom-up approach, but it would be credible and executable. Additionally, when building a pitch deck or a business plan for investors, they will trust figures captured using a bottom-up approach rather than a top-down approach.
I always recommend using both approaches together. While a bottom-up approach will ground your assumptions in reality, the top-down method will ensure that you don’t miss any major opportunities in your calculations.
The combination of these two extreme methods will make your numbers far more defensible.
Here’s a quick overview showing you how top-down differs from bottom-up:
| Aspect | Top-down | Bottom-up |
|---|---|---|
| Starting point | Industry reports and market research | Individual customer analysis |
| Data sources | Third-party research, government data | Primary research, competitor analysis |
| Accuracy | Broad inflated estimates | Realistic conservative assumptions |
| Time investment | Quick to calculate | Requires you to run surveys and gather preliminary data |
| Investor perception | Shows the scale of the market opportunity | Demonstrates market understanding |
| Best used for | Initial market validation | Detailed business planning |
TAM, SAM, SOM examples
Here are a couple of examples to strengthen your understanding of TAM, SAM, and SOM even further:
Coffee shop example (top-down approach)
Imagine you’re opening a specialty coffee shop in New York and you want to convince investors that your business idea has solid growth potential.
Here’s how you would approach TAM, SAM, and SOM:
- TAM (Total Addressable Market): The U.S. coffee market is worth around $50 billion. This includes every coffee outlet nationwide, including big chains like Starbucks
- SAM (Serviceable Addressable Market): Since you’re opening a single café, you narrow it to the specialty coffee segment in New York City, valued at about $1 billion. This reflects the niche and geography you can realistically serve
- SOM (Serviceable Obtainable Market): With one location in Brooklyn, your shop might aim to capture $2 million in sales annually. That’s the realistic share you can obtain from your immediate neighborhood.
Project management SaaS example (bottom-up approach)
Imagine you’re launching a project management SaaS for remote startups with fewer than 50 employees.
Here’s how you would approach TAM, SAM, and SOM:
- TAM (Total Addressable Market): Research shows there are about 200,000 remote-first startups worldwide that need a project management solution. You expect to earn an average of $2,000 per customer per year. So, if each of those startups subscribes to your business, your TAM would be $400 million
- SAM (Serviceable Addressable Market): After applying filters like geography, budgets, and adoption readiness, you narrow down to 50,000 startups you can realistically serve, making your SAM about $100 million.
- SOM (Serviceable Obtainable Market): Considering your current resources, you project signing up 5,000 startups in the short term. That gives you a SOM of $10 million.
Skincare ecommerce brand
Now imagine you’re launching an eco-friendly skincare e-commerce brand.
Here’s how you would approach TAM, SAM, and SOM:
- TAM (Total Addressable Market): The global skincare market is worth around $150 billion. That’s every skincare product in every region
- SAM (Serviceable Addressable Market): You narrow it to the eco-friendly skincare segment in North America, valued at $12 billion. This focuses on your niche and geography
- SOM (Serviceable Obtainable Market): With your current marketing budget and supply chain, you might realistically capture $5 million in sales in the early years
Remember: These are overly simplified examples, so you can understand what aspects to factor in during your calculations.
Market sizing mistakes that kill your funding chances
In my six years as a venture capital analyst, I’ve identified some common patterns across thousands of submissions. If I had to put a number to it, I’d say 7 out of 10 decks on my desk make at least one of these blunders.
And trust me, when you get TAM, SAM, and SOM wrong, it immediately raises red flags. Investors start wondering: “If this basic assumption is shaky, what else is off in this plan?”
So, let me save you from that awkward moment by walking you through the most common traps:
1. Inflating TAM & ignoring SAM/SOM
Your TAM should match your actual value proposition. I can’t tell you how many times I’ve seen founders slap the global CRM market size into their deck—when their actual product is a niche tool for dental clinics in the U.S. Sure, the number looks big and fancy, but it’s also a dead giveaway that you don’t understand (or respect) your true market. Investors notice, and it instantly dents your credibility.
And please—don’t stop at TAM. Lay out TAM, SAM, and SOM clearly, ideally with a visual diagram. If you leave it to me to do the decoding, I’ll already be skeptical.
2. Mixing geographic scopes
This one drives me nuts. One minute you’re showing a U.S. SOM, the next slide throws in global market figures. Which is it?
Are you building a local business with room to scale, or are you chasing global from day one? Be consistent. Otherwise, your resource requirements and growth assumptions look like guesswork. Mixed geographic scopes make it impossible to evaluate your growth assumptions or resource requirements.
3. Overestimating SOM with unrealistic assumptions
I get it—optimism is part of the founder’s DNA. But when I see pre-revenue companies claiming they’ll grab 10% of the market in year one, my first reaction is skepticism.
What about brand recognition? Distribution limits? Customer hesitancy? Unless you’ve got solid research and evidence to justify that kind of leap, it just feels like wishful thinking.
4. Using outdated data without citation
This is most often the case when founders use a top-down approach to size their TAM. They cite the first data from a Google search without accounting for their niche, study methodology, or geography. It weakens your entire argument.
Remember, even a credible McKinsey report won’t save your boat if the report is half a decade old.
5. Misaligning SOM with revenue projections
Investors would seek alignment between your claims in the market opportunity section and your financial projections. That is, if you claim to achieve 10 million SOM in the first year, it should reflect in your revenue projections as well.
If not, investors would catch your half-baked unpreparedness.
The bottom line
TAM, SAM, and SOM are the guiding blocks that influence every strategic business decision you make for your business. Be it pricing your services, expanding into new markets, or rolling out a new feature—these metrics reinforce your understanding of the market.
With Upmetrics, you get a ready market analysis framework that will help you present your market research in an investor-ready format. With it, you can model TAM, SAM, and SOM directly inside your business plan and align those numbers with the financial projections.
You don’t have to worry about figuring out the structure, positioning, or placement of these key metrics. Simply sign up and get a guided roadmap to build comprehensive business planning documents from scratch.
Frequently Asked Questions
Which method (top-down vs bottom-up) is more reliable?
How do I estimate TAM/SAM/SOM on a tight budget or with limited data?
Is it okay to rely on a single data source?
How do investors use these numbers in pitch decks?

Chad Stephens
Chad Stephens is a Venture Capital Analyst with expertise in startup investing and institutional finance. He specializes in reviewing business plans and financial models with a strong focus on accuracy and investor alignment. With over six years of experience, he writes about private equity, venture capital, and market trends to share insights with the business community. Read more