The construction market is not moving the same way across every sector. The headline numbers say the market is growing. But the growth is uneven.
Some categories are moving faster. Infrastructure, manufacturing, energy, and data-center projects are creating new demand. Other parts of the market are facing labor shortages, higher input costs, safety pressure, and tighter margins. Technology is also changing how projects get planned and delivered.
So broad construction numbers won’t be enough if you’re studying the market, writing a business plan, preparing a pitch, or sizing a new service area.
You need to know where money is going, what costs are rising, and how risks could affect project work.
These latest construction industry statistics help you understand where the market stands, which sectors are growing, and where to position your business in the upcoming years.
Key takeaways
- The US construction market size is expected to reach $2.25 trillion in 2026 and $2.89 trillion by 2035. (Source)
- US construction spending reached a seasonally adjusted annual rate of $2.17 trillion in April 2026. (Source)
- The industry needs roughly 349,000 extra workers in 2026, and 456,000 in 2027. (Source)
- Construction employment reached about 8.34 million workers in May 2026. And the average hourly earnings rose to $41.20 per hour. (Source)
- Construction input prices were 7.0% higher year over year in April 2026, with nonresidential up 7.4%. (Source)
- Contractor backlog sat at 8.8 months in April 2026, but data-center contractors had 10.6 months of backlog. (Source)
- AI use or planned investment jumped from 44% to 61% of construction firms in one year. (Source)
- Contractors are most optimistic about data centers (+57%) and power projects (+34%) in 2026. (Source)
Global construction industry statistics
The global construction market is still growing, but the growth isn’t evenly spread. Some regions are surging while others stall. And US contractors feel that gap through their supply chains.
Global demand for steel, copper, lumber, equipment, and skilled labor sets the prices you pay and how long it takes for materials to show up.
- The global construction market was valued at $16.46 trillion in 2025. It is expected to reach $21.74 trillion by 2030, with a 5.9% annual growth rate. (Source)
- The global construction market is expected to grow about 2.9% in 2026 after a weaker 2025. (Source)
- Together, China and India will account for about 40% of global construction growth this decade (2020-2030). China is projected to drive 26.1%. India ranks second at 14.1%, ahead of the United States at 11.1%. (Source)
- Globally, Infrastructure is the fastest-growing segment, with a 5.1% CAGR from 2020 to 2025. India’s infrastructure market is moving even faster at roughly 8% annually. (Source)
- Global data-center construction is set to reach $3 trillion in spending over the next five years. This is the single largest demand surge any construction segment has seen this decade. (Source)
US construction industry — Market size & spending
US construction spending remains large, but the important question is where that money is going.
The numbers below show you how much work is moving through the market. They also reflect which parts of the market are carrying demand, from public projects and infrastructure to residential and private nonresidential construction.
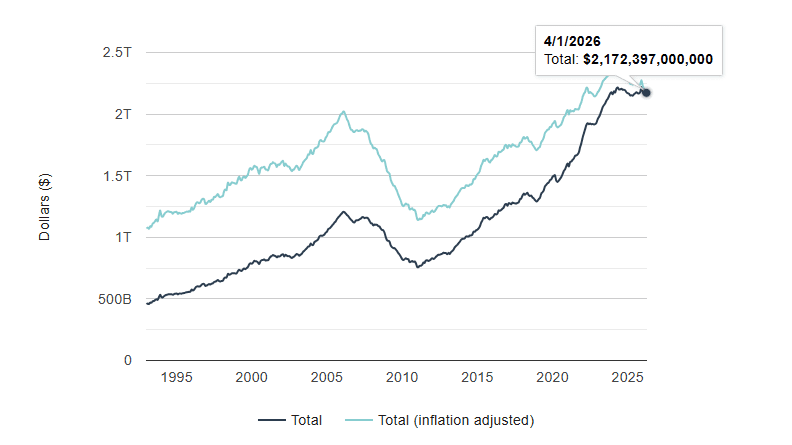
- The US construction market size was valued at $2.17 trillion in 2025, and is projected to reach $2.25 trillion by the end of 2026. (Source)
- US construction spending reached an annual rate of $2.17 trillion in April 2026. This was higher than March (0.4%) and April 2025 (0.9%). (Source)
- Total construction starts rose 9.0% in April 2026 to a seasonally adjusted annual rate of $1.33 trillion. Nonresidential building starts grew 18.6%, while residential starts slipped 0.7%. (Source)
- Private construction projects made up about 75% of total spending. In April, private spending reached $1.64 trillion. Public projects spending was valued at $532.7 billion. (Source)
- Private residential construction spending reached $909.9 billion in April 2026, up 0.8% from March. (Source)
- Private nonresidential spending dropped to $729.8 billion in April. (Source)
- Manufacturing construction spending fell for the 14th month in a row, dropping 1.2% month-over-month and 18% year-over-year. (Source)
- Highway and education projects are the biggest parts of public construction. Highway spending reached $149.6 billion, and educational construction reached $113.7 billion in April 2026. (Source)
- US data-center construction spending reached an annualized $50.7 billion in April 2026. (Source)
- Housing starts fell 15.4% in May 2026 to an annual rate of 1.18 million units, with residential permits down 0.7% to 1.41 million. (Source)
- Nonresidential planning slowed at the start of 2026. The Dodge Momentum Index fell 6.3% in January, with commercial planning down 7.2% and institutional planning down 4.4%. (Source)
- Texas recorded $89.7 billion in annual commercial construction spending, more than double that of any other state. Arizona ranked first for per-capita commercial construction spending. (Source)
US construction employment, labor, wages, and hiring shortage
Labor is the biggest constraint on construction in recent years. Spending is healthy, and demand is real, but contractors are short of workers across nearly every trade. The numbers below show where the labor pressure is coming from:
Workforce size and hiring rate
- The US construction industry employed about 8.34 million workers in May 2026, with roughly 6 million in production and nonsupervisory roles. (Source)
- Industry employment was up 68,000 jobs over the past year. The construction market added 17,000 jobs in May 2026. (Source)
Here’s the breakdown of where jobs are growing and where hiring has softened.
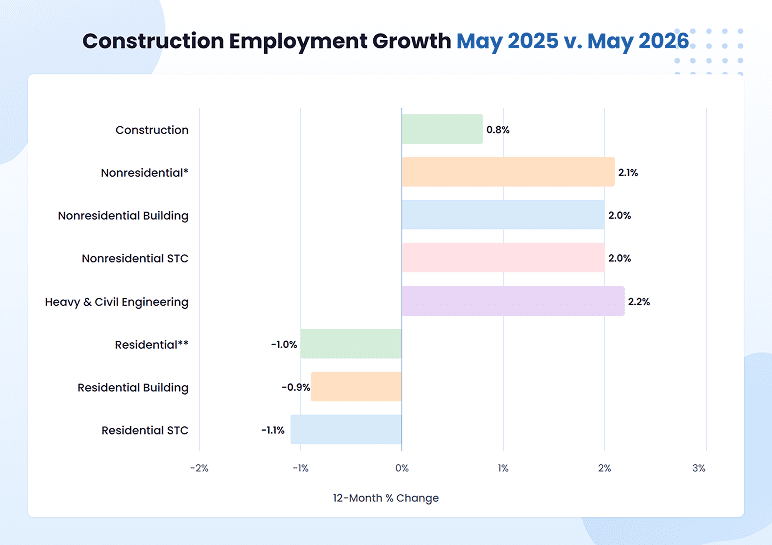
- Construction job openings fell to 202,000 in February 2026, compared with 255,000 a year earlier. Hires also dropped to 274,000. (Source)
Workforce demographics and the retirement wave
- About 22% of construction workers were age 55 or older in 2025. It means more than 1 in 5 workers are close to retirement age. (Source)
- Around 41% of the current construction workforce could retire by 2031. This adds more pressure to the industry’s labor shortage. (Source)
- The industry needs 349,000 net new workers in 2026 and 456,000 in 2027 just to keep up with demand. Most of that need will come from retirements, not new construction growth. (Source)
- Immigrant workers made up a record 26.3% of the U.S. construction workforce in 2024. In construction trades, the share was even higher, at about one in three workers. (Source)
- Some states depend more on immigrant construction labor. Their share was highest in California (42.1%), Florida (40.6%), Texas (39%), and Nevada (38.6%). (Source)
Hiring difficulty and project impact
- More than 4 in 5 construction firms are struggling to hire. About 82% of firms had difficulty filling hourly craft positions, while 80% had difficulty filling salaried roles. (Source)
- 45% of firms reported labor shortages caused project delays in the past year. This makes labor the #1 reason projects fall behind, ahead of materials, financing, and weather. (Source)
Wages and compensation
- Average hourly earnings in construction hit $41.20 in May 2026, up 4.2% from a year earlier. This is the strongest wage growth of any major private industry. (Source)
- Construction wages change a lot by role. In 2025, construction managers averaged $124,360 a year, while construction laborers averaged $52,030. (Source)
The table below shows how pay differs across a few common construction roles.
| Occupation | Hourly pay | Annual pay |
| Construction managers | $59.79 | $124,360 |
| Electricians | $34.37 | $71,490 |
| Carpenters | $31.55 | $65,630 |
| Heating, air conditioning, and refrigeration mechanics and installers | $31.14 | $64,780 |
| Construction laborers | $25.02 | $52,030 |
- Union workers across all industries earned a median of $1,404 a week in 2025, vs. $1,174 for nonunion workers, a 20% gap. The gap is typically wider in construction, where union pay tends to run well above the nonunion average. (Source)
Construction backlog, contractor sentiment, & sector demand
High construction spending doesn’t mean every contractor is busy. Backlog and contractor sentiment show how much work firms actually have lined up, how confident they feel, and which project types are picking up speed in recent years.
- The average contractor has 8.8 months of signed work waiting in their pipeline as of April 2026. It’s the second month in a row backlog has grown, after hitting a four-year low in January. (Source)
- Data-center work is creating a stronger pipeline for some contractors. Around 15% of member contractors working on data centers had 10.6 months of backlog, compared with 8.3 months for contractors not working on data centers. (Source)
- Backlog was weaker for the smallest contractors, falling to 5.8 months. Heavy industrial backlog rose to 8.8 months, while infrastructure backlog reached 9.8 months. (Source)
- The biggest worry on every contractor’s mind right now is the economy. 62% of firms say a recession or slowdown is their top concern. Materials costs come second at 53%, with labor concerns also high on the list. (Source)
- Even with that worry, 63% of firms still expect to add headcount in the current year, while only 15% plan to cut. Contractors are cautious about the economy but are still preparing for steady demand. (Source)
- Healthcare and infrastructure follow with moderate optimism: non-hospital healthcare (clinics and medical labs) at +24%, hospitals at +20%, water and sewer at +16%, and manufacturing at +15%. (Source)
- Some sectors are growing fast. Others are shrinking. Data centers are the clear leader, with 57% more contractors expecting more data center work than less. This is a 15-point jump from last year. Power projects come in second at 34%. (Source)
- Commercial real estate is the weakest part of the market. More contractors expect retail (-18%), office (-14%), and lodging (-7%) work to drop than grow. Even K-12 schools (-1%) and higher ed (-5%) turned slightly negative for the first time since 2021. (Source)
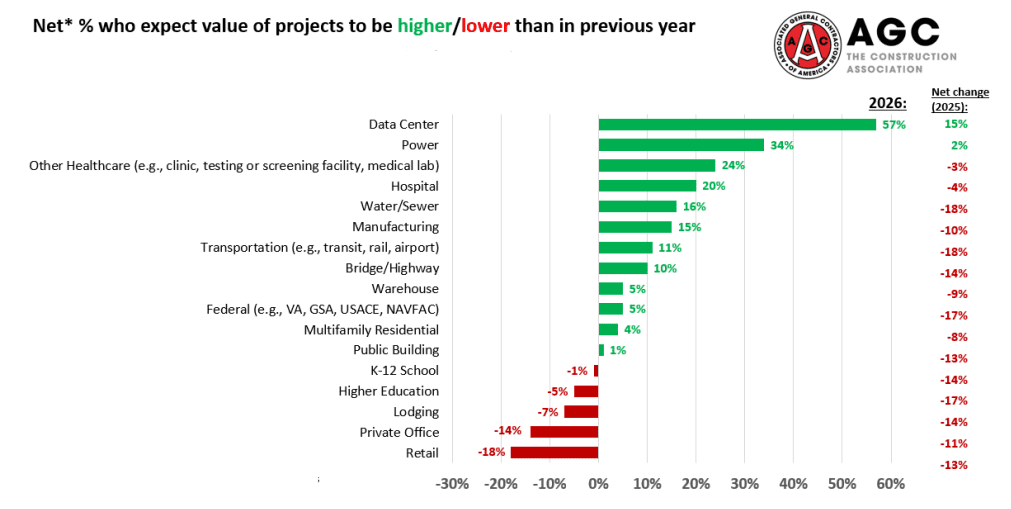
- Out of 17 sectors AGC tracks, 12 are still growing, down from 15 last year (As seen in the above chart). The overall demand picture is +9% positive, the lowest reading in three years, but not yet negative. (Source)
Building material costs, tariffs, and input-price inflation
Materials are the second-biggest cost in construction after labor. They’re getting harder to plan around because tariffs, fuel costs, and supply issues keep piling up. Together, these can quietly shrink margins on a project after the bid is already locked in.
- Construction material prices were 7% higher in April 2026 than a year earlier. Nonresidential prices were up 7.4%. Prices jumped 1.7% in April alone, after three years of relatively stable costs. (Source)
- Prices went up more in the first four months of 2026 (6.2%) than they did over the previous few years. (Source)
- The producer price index for crude petroleum prices rose 20.2% in March 2026 alone, while natural gas prices fell 51.7%. This monthly surge is due to oil market disruption from the U.S.-Iran conflict. (Source)
- The producer price indexes for aluminum mill shapes and steel mill products are up by 33% and 20.7%, respectively, from January 2025. (Source)
- Not every material is going up. Softwood lumber is barely positive (+1.1% YoY) after months of decline. Particleboard and fiberboard are down 12%. Softwood plywood is down 1.7%. (Source)
- The effective tariff rate on US construction imports has surged to 27.7%. That was up from 19.2% in May 2025 and just 0.9% before President Trump’s second term began. (Source)
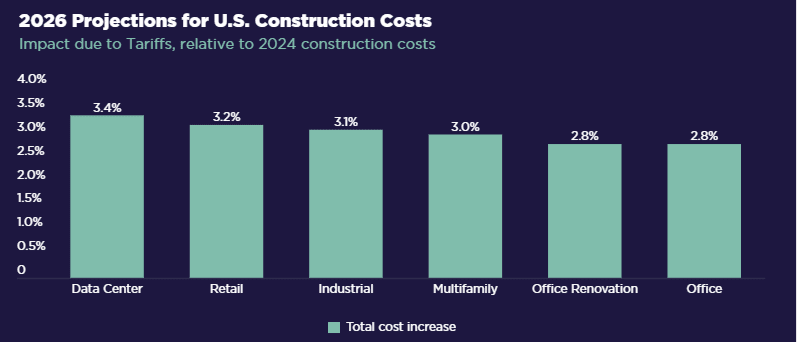
- Tariff rates as of April 7, 2026, could increase U.S. CRE construction materials costs by 6% and total project costs by 3%. (Source)
- At peak tariff rates in summer 2025, commercial real estate construction materials costs were projected to rise 9% above 2024 levels. Current rates are lower, but cost pressure remains. (Source)
- Early in 2025, NAHB reported that builders expected tariffs to add $7,500 to $10,000 to the cost of an average new single-family home. (Source)
- But in its April 2025 survey, builders estimated the tariff cost effect at $10,900 per home. (Source)
- Around 24% of contractors said they had not been affected by tariffs. But 40% of firms have raised their bid prices, 35% are passing tariff costs directly to clients, and 32% are buying materials early to avoid paying prospective tariffs. (Source)
Construction safety & productivity
Construction is still one of the most dangerous industries to work in. Safety problems also affect productivity because injuries, downtime, rework, and poor site coordination can slow projects and raise costs.
Safety
- The construction industry recorded 1,064 workplace fatalities in 2024, down from 1,099 in 2023. (Source)
- Construction had a 2.2 total recordable case rate in 2024, measured per 100 full-time workers. Cases involving days away from work, job restrictions, or job transfers had a rate of 1.3. (Source)
- Of those injuries, 0.9 per 100 workers were serious enough that the worker missed days on the job. A serious injury doesn’t just affect the worker. But it can also affect schedules, crews, insurance, and project delivery. (Source)
- Among construction and extraction workers, fatal falls, slips, and trips decreased by 7.5% from 400 deaths in 2023 to 370 in 2024. (Source)
The following table shows the leading fatal safety risks in construction:
| Cause | Percentage/Deaths |
| Falls, slips, and trips | 38% (389 fatalities) |
| Falls to a lower level | 95.9% of falls |
| Transportation incidents | ~24% (244 deaths) |
| Exposure to harmful substances/environments | 187 deaths |
| Contact with objects/equipment | 161 deaths |
| Violent acts | 46 deaths |
| Explosions or fires | 5 deaths |
(Source)
- Construction’s nonfatal injury rate is now slightly below the U.S. private-industry average. In 2024, the industry recorded 2.2 injuries per 100 full-time workers, vs. 2.3 across all private industries. (Source)
Productivity
- Global construction productivity grew only about 0.4% a year from 2000 to 2022, while the total economy grew about 2% a year. Construction is producing work more slowly than most other sectors. (Source)
- U.S. construction productivity has actually gone backward over the long run. Since 1965, it’s declined about 0.6% a year, while the rest of the economy grew about 1.6% annually. (Source)
- Construction labor productivity rose 2%, and output grew 3.6% in 2024. It does not solve the long-term gaps, but it is a positive sign. (Source)
- Around 32% of contractors saw productivity rise over the past year. Whereas 41% saw no change, and 24% said it declined. (Source)
Construction technology & AI adoption
Construction has been slower than most industries to adopt new tech. But this is changing nowadays. AI is helping with estimating and admin work. Drones are mapping job sites. Digital workflows are replacing paperwork.
The shift isn’t about replacing workers. It’s about practical tools that save time on the work you’re already doing.
- Off-site construction, where parts (prefab) or entire rooms (modular) are built in a factory and assembled on-site, can cut project time by 20 to 50% and reduce waste by 15 to 20% compared to traditional builds. (Source)
- Digital workflows, building information modeling (BIM), 3D printing, and digital twins can shorten project timelines by up to 20% when used well. (Source)
- Drones are becoming standard on bigger job sites. The global construction drone market was valued at $7.22 billion in 2025, and is projected to grow from $8.06 billion in 2026 to $14.09 billion by 2031. (Source)
- 61% of contractors say they’re using AI or planning to increase AI investments in 2026, up from 44% just a year earlier. (Source)
- Most contractors are using AI for back-office work. 45% deploy it for office and admin tasks, 23% for estimating, 20% for design and preconstruction, and 16% for HR work like recruiting and training. (Source)
- 86% of large contractors believe AI will give them a competitive advantage, compared to 69% of small and mid-sized firms. (Source)
- 47% of contractors report difficulty filling AI specialist roles in 2026. As more firms invest in tech, finding qualified workers can be a bit harder. (Source)
Construction industry environmental and sustainability statistics
Construction has a massive environmental footprint due to energy use, materials, demolition waste, and jobsite practices.
For contractors, sustainability isn’t about marketing anymore. It’s about practical choices: reducing waste, using lower-impact materials, improving energy performance, and meeting client requirements that include green standards.
- The buildings and construction sector accounts for about 37% of global CO2 emissions and uses nearly 50% of all material extracted from the earth. It also consumes 28% of global energy. This matters because projects include waste, energy, and green-building requirements. (Source)
- US construction and demolition activity generates roughly 600 million tons of debris a year, more than twice the country’s regular municipal waste, per the EPA. (Source)
- About 145 million tons of debris still end up in landfills, while the rest gets recycled or reused. (Source)
- Demolition accounts for more than 90% of total construction and demolition debris, while new construction represents less than 10%. (Source)
- The US green building market hit $116 billion in 2025 and is projected to reach $270 billion by 2035, with an 8.8% annual growth rate. (Source)
Construction disputes & project risk
Even profitable projects can lose money fast when things go wrong. Disputes, delays, and claims have grown more common today as labor pressures, tariffs, and tight schedules squeeze project budgets.
For a small contractor, one bad project can wipe out the margin from three good ones. The next few stats explain why risk control matters before a project starts.
- The average construction dispute in North America is now valued at $60.1 million. (Source)
- The average time to resolve construction disputes in North America fell to 12.5 months in 2024. (Source)
- On distressed projects, the amount in dispute is huge. HKA’s report (covering 2,200+ projects worth $2.43 trillion globally) found that disputed costs average about one-third of the total contract budget on distressed projects. (Source)
- Around 98% of construction projects in North America face delays, with the average project running 37% longer than originally planned. (Source)
- For megaprojects, that’s even worse: nearly 8 out of 10 finish at least 40% behind schedule. (Source)
- The most common cause of disputes isn’t fraud or bad faith. It’s “failing to understand or comply with contractual obligations.” Most disputes start with a misunderstanding. It means a clearer contract often prevents the problem. (Source)
- Globally, construction inefficiencies cost about $1.6 trillion a year. Cost overruns remain a major part of the problem, often ranging from 20% to 45%. (Source)
- 63% of American construction firms had at least one project canceled, delayed, or scaled back in the past six months. (Source)
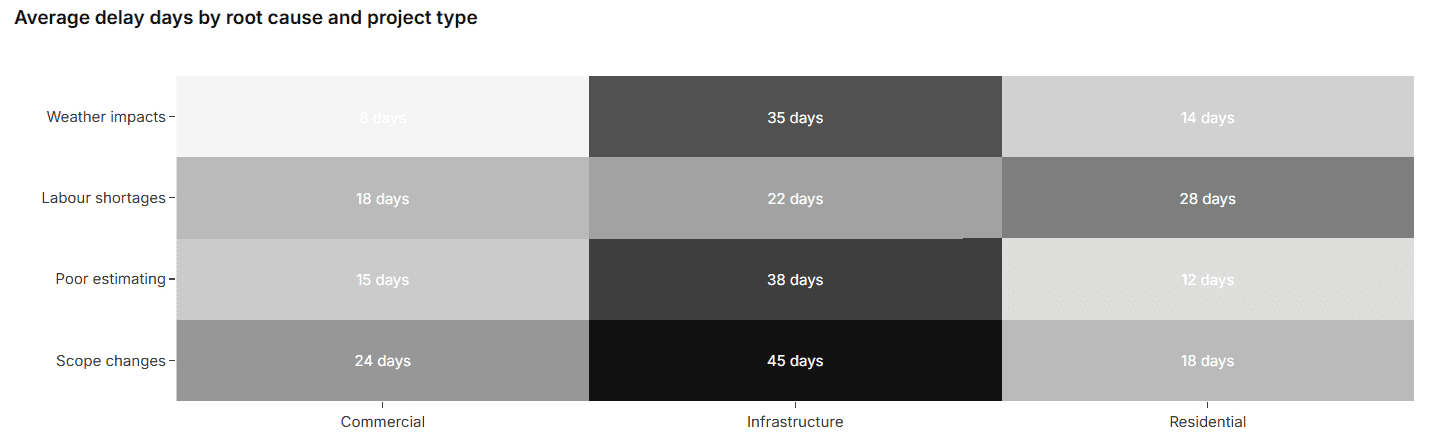
The chart below shows which issues add the most delay across different project types:
Conclusion
Construction demand is still there. But in 2026 and beyond, demand alone won’t be enough to build a healthy business.
The numbers show a market where opportunity and pressure are moving together. Some project types are growing. But contractors are also dealing with tighter labor, higher costs, safety risks, project delays, and thinner margins.
That means contractors will need to be more careful about the projects they take on. A full pipeline can still create problems if labor is short, materials move faster than expected, or cash flow gets stretched.
So use these statistics as planning inputs, not just market facts. They can help you choose better projects, price work with current assumptions, and grow at a pace your team can actually support.
The Quickest Way to turn a Business Idea into a Business Plan
Fill-in-the-blanks and automatic financials make it easy.
Frequently Asked Questions
Why is the US construction industry facing a labor shortage?
Which construction sectors are growing fastest in 2026?
Will AI replace construction workers?
How are tariffs affecting construction material prices?
Upmetrics
Upmetrics is the #1 business planning software that helps entrepreneurs and business owners create investment-ready business plans using AI. We regularly share business planning insights on our blog. Check out the Upmetrics blog for such interesting reads. Read more