Financial projections are where your business idea meets reality.
It’s easy to say the business will grow. It’s harder to show how many customers you need, what they’ll pay, what it will cost to serve them, when you’ll need staff, and how much cash you’ll need before the business starts paying for itself.
That’s what projections help you figure out. They turn your business assumptions into a 3 to 5-year financial view, so you can see whether the numbers actually work.
And it’s exactly why I put this guide together. But first,
What are financial projections (in business planning context)
Financial projections are forward-looking estimates of your revenue, expenses, cash flow, and financial position, usually built for 3 to 5 years.
They show how the business is expected to perform if your assumptions about pricing, sales volume, costs, hiring, funding, and growth hold. They do not predict the future perfectly. They show whether your business model makes financial sense on paper.
Lenders use projections to assess repayment ability. Investors use them to review growth, margins, runway, and funding needs. As a founder, you should use them to test whether your pricing, spending, and cash reserves are realistic before you commit real money.
The SBA lists financial projections as a common section in a traditional business plan, and if you’re applying for a small business loan, it recommends preparing financial projections for the next five years.
Financial projections vs. financial plan
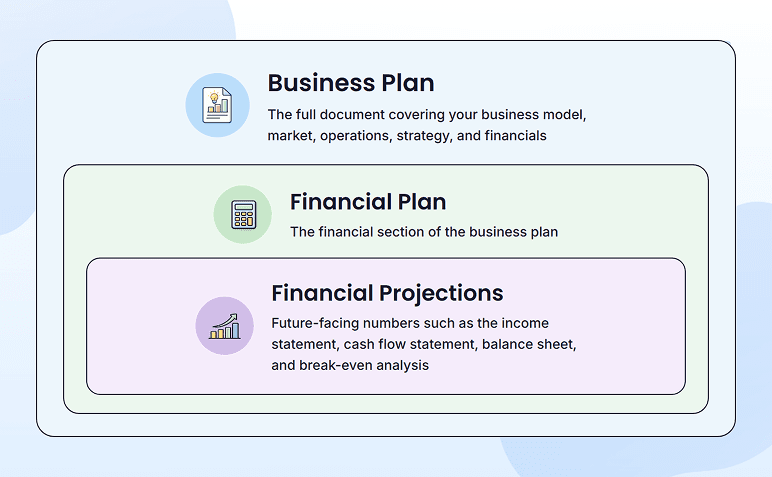
A financial plan is the full financial section of your business plan. It can include your funding needs, startup costs, revenue model, expense structure, financial strategy, and financial projections.
Financial projections are one part of that plan. They are the forward-looking numbers: projected income statement, cash flow statement, balance sheet, and break-even analysis.
Quick note on terminology while we’re here. A forecast estimates what’s likely to happen over the next 12 months based on how the business runs today. A projection estimates what the numbers would look like under a specific scenario, like opening a second location, raising a round, or hiring ahead of revenue. For a business plan, you’re building projections, since you’re modeling a future that hasn’t happened yet.
Why do your financial projections matter?
Projections matter because each reader uses them to answer a different question.
For lenders, the question is repayment ability. Your cash flow projections will be used by banks, credit unions, and SBA-participating lenders to determine if your business will be able to pay the loan each month, including during slow periods.
For equity investors, the question is upside and runway. Angels, seed funds, and venture investors are more interested in what your revenue growth rate is, where your margins are at scale, how much cash is in the bank before the next round, and whether or not your scenario logic is still valid if revenue growth is slower than expected.
For you as the founder, the question is whether the business actually works on paper before it works in the real world. All pricing projections are done here.
What do your financial projections actually include? (essential statements)
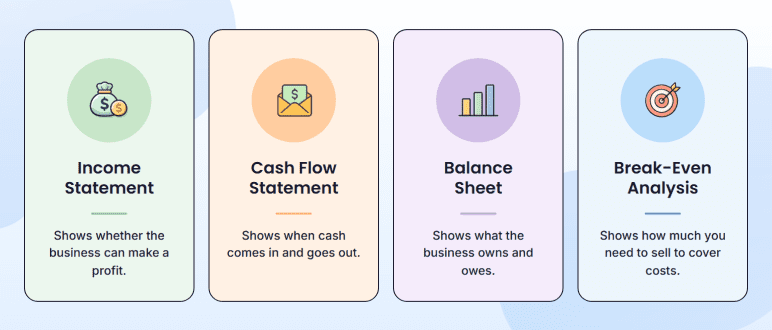
A complete financial projection usually includes four parts:
The statements are the visible layer, but the assumptions sitting underneath them are what give the numbers any meaning at all. If you change a pricing assumption, the income statement, cash flow, and balance sheet all move with it. That’s why a strong projection package always shows its assumptions alongside the statements.
1) Income statement
An income statement shows whether your business is expected to make a profit over a specific period. In financial projections, it estimates future revenue, direct costs, operating expenses, taxes, interest, and net income. Your projected income statement usually includes:
- Revenue
- Cost of goods sold
- Gross profit
- Operating expenses
- Interest and taxes
- Net income
The main question this statement answers is: Can the business earn more than it spends? Investors want to see whether revenue growth, margins, and expenses make sense together. A projection that shows fast revenue growth but ignores rising payroll, marketing, or delivery costs will not feel believable.
2) Cash flow statement
A cash flow statement shows when cash is expected to come in and when it is expected to go out. Typically, it contains the following items:
- Customer payments
- Owner investment or loan funds received
- Payroll, rent, utilities, taxes, and supplier payments
- Inventory, equipment, or asset purchases
- Loan repayments and interest payments
3) Balance sheet
A balance sheet shows what your business is expected to own, owe, and retain at a specific point in time. In financial projections, it estimates future assets, liabilities, and equity.
For a business plan, this statement helps readers understand the company’s financial position after the projected revenue, expenses, loans, purchases, and investments are accounted for.
Your projected balance sheet usually includes:
- Assets
- Liabilities
- Equity
4) Break-even analysis
A break-even analysis tells you when revenue equals expenses, the exact point at which the business stops losing money. In a projection, it gives you the sales volume the business needs to hit before it turns a profit. A business plan tells readers the minimum performance you need to be financially viable.
The simple formula is:
Break-even point = Fixed costs ÷ (Price per unit − Variable cost per unit)
For founders, this turns an abstract revenue goal into a concrete target you can plan against—how many units you need to sell each month, or how many customers you need to close, before the business actually makes money. For lenders and investors, it’s a sanity check on whether your projected sales volume is realistic given your team’s capacity, market demand, and pricing.
If your business plan is going to a lender, investor, or grant reviewer, include all four.
Let’s now move to the next important question:
How to make financial projections for your startup (step-by-step)
A first projection takes me about four to six hours of focused work for a typical small business. By the end, you should have a complete projection package: an income statement, cash flow statement, balance sheet, and break-even analysis, plus a few scenarios that show what happens if revenue lands higher or lower than planned.
Before getting into the steps, one decision worth making up front: how granular and how far out to project. The standard for most business plans is monthly projections for Year 1, then annual projections for Years 2 through 5. Year 1 needs to be monthly because that’s where early-stage cash timing actually matters, and the precision drops fast after that anyway. A banker will read annual numbers just fine for Year 2 onward. Lock that structure now so you’re not re-deciding it at every step.
The first version doesn’t need to be polished. It needs to be defensible. Every number in your projection has to come from somewhere you can point to, whether that’s last quarter’s actuals, an industry benchmark, or a clear assumption about how customers will behave.
Here’s the process I walk every founder through:
Let’s start with Step 1.
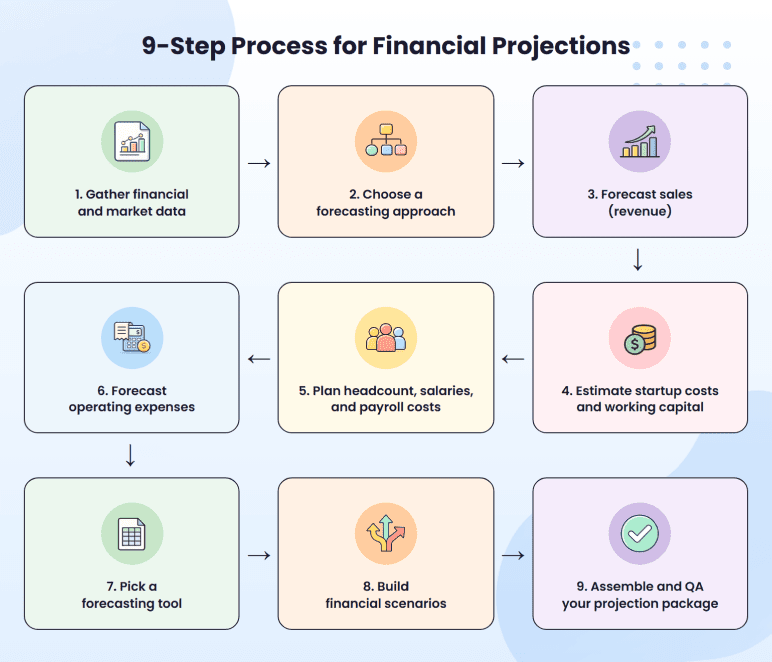
Step 1: Gather financial and market data for assumptions
There are two types of data you’re collecting:
- Internal financial records: Bank statements, sales reports, payroll records, invoices, accounting reports, past expenses
- Market data: Industry growth rates, competitor pricing, demand trends, wage benchmarks, rent ranges, supplier costs
If you already have 6 to 12 months of sales data, use it to estimate monthly revenue, average order value, customer count, direct costs, payroll, rent, taxes, loan payments, and seasonality.
What if you have no historical data? (For first-time founders)
If you’re pre-revenue, your data comes from outside the business. The sources I trust and lean on most often:
- BLS for wages and labor costs by occupation and region
- Census Business Builder for demographics and local market size
- IBISWorld for industry reports by NAICS code
- Google Trends for seasonality and demand patterns
- SBA Industry Profiles for small-business benchmarks
- Competitor websites and supplier quotes — the most overlooked source on this list, and often the most accurate
You don’t need perfect data. But every major assumption, like revenue, pricing, payroll, rent, cost of goods sold, and customer demand, needs a source you can point to. These are the numbers lenders and investors will ask about first.
We’ve got a separate guide on how to project without historical data that walks through this in depth.
Step 2: Choose a forecasting approach(top-down/bottom-up)
Once your inputs are ready, decide how you’ll build the projection: top-down or bottom-up.
Use bottom-up forecasting as your main model whenever possible. Use top-down forecasting as a sanity check to make sure your revenue target is not larger than the market can support.
That’s the rule I start with, and it covers most situations.
| Approach | Best for | How it works | Risk |
| Top-down | Pre-revenue startups or new business ideas | Starts with market size, demand, pricing, and an assumed share of the market | Founders overestimate how much of the market they can win |
| Bottom-up | Existing businesses with real sales history | Starts with actual customers, sales volume, pricing, conversion rates, and monthly expenses | Bad source data carries errors through the whole projection |
But choosing top-down or bottom-up only tells you where your projection starts. You still have to decide how the numbers move from one month to the next.
Step 3: Forecast sales
Rather than going for the big number, create a revenue forecast to see how the sales are generated.
The easiest revenue model to explain for your business is:
- SaaS/subscription: active customers × average monthly price, minus churn
- E-commerce: website traffic × conversion rate × average order value
- Retail: foot traffic × purchase rate × average ticket size
- B2B services: qualified leads × close rate × average project value
If you already have sales history, choose a base of the past 6 to 12 months. Check how many customers, their average spend, repeat purchases, close rate, seasonality, and length of sales cycle.
For a stable business, I weigh actual sales more heavily than broad industry growth rates (your own numbers beat a benchmark every time).
If you’re pre-revenue, build from smaller proof points:
- competitor pricing
- waitlist size
- early conversations
- signed letters of intent
- pilot users
- ad test results
- sales calls already booked
A forecast built on “50 leads × 20% close rate × $2,000 average project value” is far easier to defend than “we expect $20,000 in monthly revenue.”
A few things I always check before I trust a sales forecast:
- Separate volume growth from price growth. Revenue can rise because you sell to more customers, charge more per customer, increase repeat purchases, or add new revenue streams.
- Pressure-test against capacity. Whatever revenue your forecast shows, your team has to actually be able to deliver it. If the math says you’ll book more work than your headcount can serve, the projection breaks.
- Build in seasonality. If your business has slow months or peak months, make sure your projections reflect that. Retail typically spikes in Q4; B2B services often dip in July and December; tourism, tax, and landscaping swing harder.
For your first year, forecast sales monthly. It forces you to think through when revenue actually starts, how fast customers convert, and whether your team can deliver the volume you’re projecting. For the by-business-model formulas, seasonality multipliers, and worked examples that go beyond what fits here, we’ve got a full guide to sales forecasting for your business.
Projections can be created in Excel, Google Sheets, business planning software, or forecasting software. The one that is right for you will depend on the complexity of your business, your comfort level with a spreadsheet, and the frequency of changes to the numbers.
For a first draft, I’d start in a spreadsheet. But when the projection becomes harder to maintain than the business itself, a dedicated forecasting or business planning tool like Upmetrics earns its cost.
Step 4: Estimate startup costs and working capital
Once you know what your revenue looks like, the next question is what it takes to actually get the business running. This is the step where founders have this question: how much money does the business need before revenue is reliable enough to cover its own costs?
Two distinct buckets to size:
- One-time startup costs: Equipment and machinery, deposits, business licenses and permits, legal and incorporation fees, initial inventory, website build, signage, opening furniture, and any deposits on rent or services.
- Working capital: The cash buffer that covers your operating expenses during the months when revenue hasn’t caught up to costs.
For startup costs, build a line-item list and get a real number for each item. Don’t budget categories like “equipment: $20K.” Budget “industrial dough mixer: $4,200, commercial oven: $11,000, refrigeration: $3,800, prep tables: $1,800.”
For working capital, take your projected monthly operating expenses and multiply by the number of months until your cash flow turns positive. If your monthly OpEx is $30K and you don’t expect to be cash-flow positive until Month 8, you need at least $240K of working capital on top of your startup costs. That’s the gap your funding has to cover.
If startup costs plus working capital total $400K and you have $100K of your own capital, your funding need is $300K, whether that comes from an SBA loan, investor equity, a personal line of credit, or some mix. Lenders and investors will both ask, “What do you need the money for?” Your answer should be a line-item breakdown from this step.
Step 5: Plan headcount, salaries, and payroll costs
Salary is only half the cost of an employee. You also have to account for payroll taxes, benefits, insurance, tools, onboarding, raises, and sometimes recruiter or contractor costs.
The BLS tracks employer compensation as wages plus benefits, which is exactly why salary alone never shows the real cost of a hire. For most B2B SaaS startups, personnel costs end up being the single largest line in the budget. Lighter Capital’s 2025 SaaS benchmarks put median salary at around 55% of operating expenses, with top-performing companies running closer to 40%.
Start with the roles you have to fulfill to make your plan work. If you’re dependent on delivering to clients, making sales calls, providing customer support, producing or providing service hours, the number of people you have on your staff needs to reflect that capacity.
For each role, I estimate:
- Hiring month
- Monthly salary or hourly wage
- Payroll taxes and benefits
- Contractor or part-time support
- Raises or wage increases
- Software, equipment, and onboarding costs
As a rough planning rule, add 15% to 30% on top of base salary to cover payroll taxes, benefits, insurance, and related employment costs. Use local wage data, industry benchmarks, or actual quotes wherever you can get them.
Hiring touches every statement, which is what makes it easy to get wrong. Salaries cut into profit on the income statement. Payroll timing moves cash flow. Equipment, loans, or accrued payroll all show up on the balance sheet.
Step 6: Forecast operating expenses
Headcount is usually the biggest line, but everything else the business spends to operate, sell, deliver, and grow lives here too. I break operating expenses into two buckets:
- Fixed expenses: Rent, insurance, accounting, software, subscriptions, base payroll
- Variable expenses: Cost of goods sold, payment processing, shipping, packaging, sales commissions
- One-time expenses: Equipment, licenses, deposits, website setup, furniture, launch inventory
That third bucket is the one founders forget most often, and it’s the most common projection mistake I see. Then model all three monthly, not just annually. A $12,000 annual software contract looks harmless in a yearly view, but if it’s paid upfront in January, it hits your cash the moment the year starts.
One thing reviewers always check: do your expenses grow with the business? If revenue doubles, delivery costs, support needs, sales commissions, software seats, and contractor hours usually climb too. Any sales increase that is aggressive and expenses remain steady makes a lender skeptical quickly.
Generally, I would suggest you round up the initial forecast of your expenses by 10% to 20%. Fixing a plan that needs to work only if all the numbers are met is easier said than done.
This 10-20% buffer sits on top of the 15-30% salary burden from Step 4; it’s a contingency for the categories you may have missed.
Step 7: Choose a forecasting tool
Projections can be created in Excel, Google Sheets, business planning software, or forecasting software. The one that is right for you will depend on the complexity of your business, your comfort level with a spreadsheet, and the frequency of changes to the numbers.
For a first draft, I’d start in a spreadsheet. But when the projection becomes harder to maintain than the business itself, a dedicated forecasting or business planning tool like Upmetrics earns its cost.
Whatever tool you choose (Upmetrics or otherwise), look for four things: clear assumption inputs, the ability to update revenue and expense drivers without breaking the model, auto-generated core statements, and exports that an investor can actually read.
Step 8: Build financial scenarios (best/base/worst)
Your base projection is your best estimate, but I’d never let it be the only version. Real businesses rarely perform exactly as planned, and a single-scenario projection quietly assumes they will.
Build at least three:
- Base case: the most likely outcome, based on your current assumptions
- Best case: sales 20 to 30% above base, conversion improves, or costs come in lower than expected
- Worst case: sales 20 to 30% below base, costs rise, hiring slips, or funding takes longer to close
Change only the drivers that actually move the business—sales volume, pricing, customer acquisition, payroll timing, gross margin, payment delays, or one-time costs. Everything else should flow from those.
Step 9: Assemble and QA your projection package
The income statement, cash flow statement, and balance sheet have to connect, and the connections follow a predictable logic.
- Net income → retained earnings. Profit from the P&L flows down to retained earnings on the balance sheet.
- Depreciation add-back. Non-cash expenses, like depreciation, reduce profit on the income statement but are added back on the cash flow statement since they don’t actually move cash.
- Ending cash = balance sheet cash. The cash position at the bottom of your cash flow statement has to match the cash line on the balance sheet.
- Loan repayments cut both ways. They reduce cash on the cash flow statement AND lower the loan balance on the balance sheet.
When all of that is wired correctly, a change in one statement ripples through the other two on its own. When it isn’t, you get numbers that look fine alone but contradict each other on close reading, which is exactly what a sharp lender catches.
Before you share a projection with anyone, run the same QA checks every time:
- Assets equal Liabilities plus Equity
- Ending cash on the cash flow statement matches cash on the balance sheet
- Net income connects to retained earnings, after any dividends or owner distributions
- Loan balances drop when repayments are made
- Payroll, COGS, and sales assumptions match the operating plan
- Best, base, and worst-case scenarios all run off the same core assumptions
If the balance sheet doesn’t balance, don’t start over. Nine times out of ten, the culprit is retained earnings, ending cash, loan balances, or owner contributions, since that’s where a single change tends to fail to carry through the rest of the model. Check those four first.
A complete package should include your key assumptions, the three projected statements, a break-even analysis, and your best, base, and worst-case scenarios.
Build accurate financial projections w/ AI-assisted features

Sample financial projections — a 3-year walkthrough
Acme Strategy is a 3-person B2B consulting firm launching in January 2026, projecting a 3-year horizon. Pricing: $15K per project. Expected close rate: 25%. Pipeline target: 4 qualified leads per month after Month 6.
Key assumptions
| Assumption | Year 1 | Year 2 | Year 3 |
| Average project price | $15,000 | $15,000 | $15,000 |
| Projects completed | 12 | 36 | 73 |
| Revenue | $180,000 | $540,000 | $1,095,000 |
| Cost of services | 30% of revenue | 30% of revenue | 30% of revenue |
| Operating expenses | $210,000 | $330,000 | $520,000 |
Revenue grows because the firm completes more projects, not because of a vague growth percentage. Cost of services stays tied to revenue, while operating expenses rise as the business adds staff, marketing, software, insurance, and professional support.
Projected income statement
| Line item | Year 1 | Year 2 | Year 3 |
| Revenue | $180,000 | $540,000 | $1,095,000 |
| Cost of services | $54,000 | $162,000 | $328,500 |
| Gross profit | $126,000 | $378,000 | $766,500 |
| Operating expenses | $210,000 | $330,000 | $520,000 |
| Net income | -$84,000 | $48,000 | $246,500 |
The income statement shows profitability. In this example, the business loses money in Year 1, reaches a profit in Year 2, and becomes more profitable in Year 3 as revenue grows faster than operating expenses.
Cash flow projection
| Line item | Year 1 | Year 2 | Year 3 |
| Beginning cash | $100,000 | $16,000 | $64,000 |
| Net income | -$84,000 | $48,000 | $246,500 |
| Owner investment / funding | $0 | $0 | $0 |
| Ending cash | $16,000 | $64,000 | $310,500 |
The cash flow projection checks whether the business has enough cash to survive while it grows. This simplified version uses net income as the main cash movement. In a real projection, you would also account for loan payments, owner draws, equipment purchases, taxes, delayed customer payments, and any new funding.
Projected balance sheet
| Line item | Year 1 | Year 2 | Year 3 |
| Cash | $16,000 | $64,000 | $310,500 |
| Other assets | $0 | $0 | $0 |
| Total assets | $16,000 | $64,000 | $310,500 |
| Debt | $0 | $0 | $0 |
| Owner equity / retained earnings | $16,000 | $64,000 | $310,500 |
| Total liabilities + equity | $16,000 | $64,000 | $310,500 |
The balance sheet checks whether the projection holds together. In this simple example, there is no debt and no major fixed asset purchase, so ending cash flows directly into equity. In a real business plan, the balance sheet would also include equipment, inventory, receivables, payables, loans, owner contributions, and retained earnings.
The main lesson is simple: your income statement, cash flow, and balance sheet should not tell three different stories. Revenue should connect to sales assumptions. Costs should move with delivery. Cash should reflect timing. The balance sheet should prove the numbers still hold together at the end of each year.
Build your projections with a template or planning tool
A financial projections template gives you the structure, formulas, and statement layout, so you can focus on the assumptions instead of building everything from scratch. A good template should include key assumptions, monthly cash flow, an annual profit and loss statement, a projected balance sheet, break-even analysis, and best, base, and worst-case scenarios.
If you want a free starting point, SCORE offers a well-known financial projections template. That can work for a first draft. Our own template is a pre-formatted Excel file with monthly cash flow, an annual P&L, and a year-end balance sheet, all connected by built-in formulas so the three statements stay in sync as you work.
Download the Upmetrics financial projections template and use it alongside the worked example above. Start with your assumptions, then check whether your revenue, cash flow, profit, and ending balance actually hold together as one story. If you want to go beyond a spreadsheet, Upmetrics also includes forecasting features that help you build sales, expense, personnel, funding, and scenario forecasts inside your business plan.
The Quickest Way to turn a Business Idea into a Business Plan
Fill-in-the-blanks and automatic financials make it easy.
Frequently Asked Questions
How do you write financial projections in a business plan?
Do I need historical data to build financial projections?
What do investors look at vs. what do lenders look at in financial projections?
What expenses should a startup include in financial projections?

Vinay Kevadia
Vinay Kevadiya is the founder and CEO of Upmetrics, the #1 business planning software. His ultimate goal with Upmetrics is to revolutionize how entrepreneurs create, manage, and execute their business plans. He enjoys sharing his insights on business planning and other relevant topics through his articles and blog posts. Read more