Running a restaurant in 2026 is not what it used to be. The reality is that the industry is changing quickly, and most of that change is showing up in the numbers!
Costs are rising, customer expectations are shifting, and digital channels are becoming an important part of how you make money.
Delivery and online ordering are now key revenue drivers. AI is helping with day-to-day operations. At the same time, inflation is forcing smarter decisions around pricing and menus.
In this article, you’ll find 70+ latest restaurant industry statistics for 2026. It will help you understand the current state, identify growth opportunities, and assess the challenges. Skip guesses. Get numbers that move the needle!
Restaurant Industry Statistics (Top Findings)
Here are the top restaurant trends that summarize the 2026 restaurant industry.
- Dine-in habits: 42% of consumers eat out at least weekly, so steady dine-in demand continues despite budgets. (Source)
- Younger diners: About 48% of Gen Z visits full-service spots more often, seeking quality, variety, value, and customization. (Source)
- Online ordering: Off-premises (takeout/delivery) now drives most revenue; 60%+ orders more than last year. (Source)
- Labor shortage: 78% of restaurants understaffed entering 2026, with hiring tough avg. 21 days to fill and 75% turnover. But fast response times (within 24 hours) boost hires 3x. (Source)
- Marketing channels: 73% of restaurateurs use Facebook to promote their business, making it the number 1 social media site for restaurant marketing in the U.S. (Source)
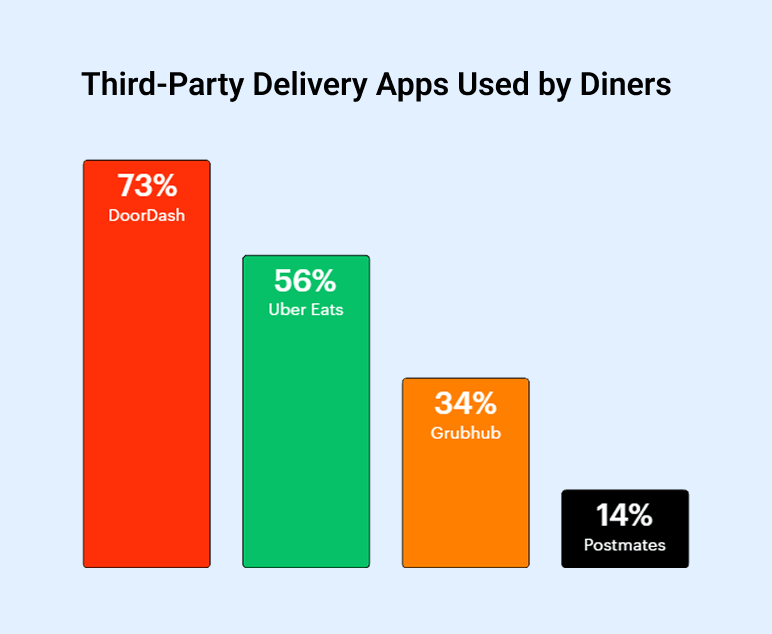
- Delivery platform: The online food delivery market is projected to reach $473.24 billion in 2026, led by major platforms including DoorDash and Uber Eats. (Source)
- Contactless payments: Over 75% of in-store restaurant transactions are now contactless (tap/mobile), up from 2025. (Source)
Restaurant Industry Overview & Economic Statistics (2026)
- The U.S. restaurant and foodservice industry is projected to reach approximately $1.55 trillion in sales in 2026, reflecting continued growth despite economic pressures. (Source)
- Industry employment will reach 15.8 million jobs in 2026 after operators add approximately 100,000 new positions this year. (Source)
- Nearly 75% of all restaurant traffic now occurs off‑premises (takeout, delivery, and drive‑thru), highlighting changing consumer behavior toward convenience. (Source)
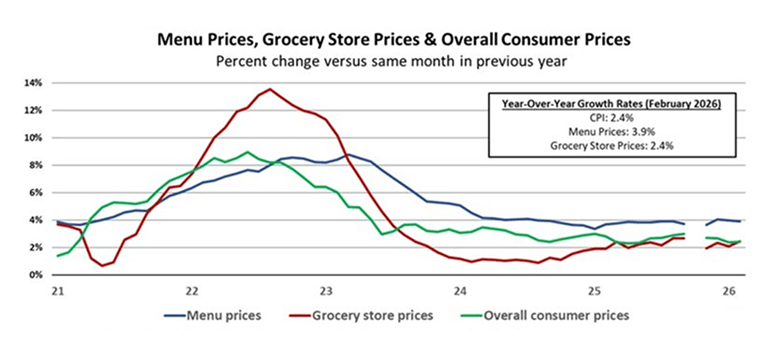
- Menu prices increased 3.9% year over year since February 2025, compared to 2.4% for grocery prices. (Source)
- Restaurants capture 53% of the U.S. household food dollar (excluding business/government spending), with eating/drinking place sales topping in Q4 2025. (Source)
- 42% of restaurants remain unprofitable entering 2026, with 60% of operators reporting worsened business conditions from 2025. (Source)
- 91% of quick-service franchise operators and 87% of full-service operators expect growth or stability in 2026, prioritizing technology investments like digital ordering and data analytics to address labor challenges. (Source)
- 98% of operators report ongoing challenges related to skilled roles such as managers and chefs, driving investment in workforce development programs and technology. (Source)
- Real sales growth is projected at 1.3% in 2026, driven primarily by higher-income consumers as overall traffic stabilizes. (Source)
Restaurant Ownership and Demographics (2026)
- Around 49% of restaurant firms are owned at least partially by women, compared to 44% of businesses in the overall private sector. (Source)
- About 36% of restaurant owners were born outside the United States, highlighting the industry’s accessibility to immigrant entrepreneurs. And 4% of restaurant businesses are veteran‑owned. (Source)
- Approximately 28% of restaurant owners are under age 45, indicating a relatively young ownership base compared with many other industries. (Source)
- Restaurant employment is more diverse than the U.S. workforce, with 51% of restaurant employees identifying as minorities (vs. 41% overall labor force). (Source)
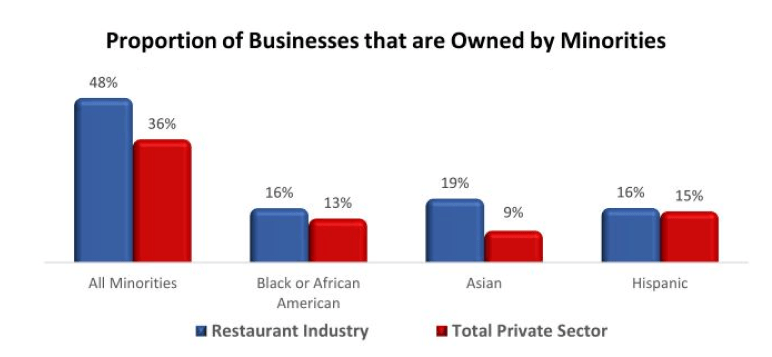
- 48% of U.S. restaurants are minority‑owned, compared with a lower minority ownership share in the overall economy. (Source)
Restaurant Menu Innovation & Pricing Trends (2026)
- 85% of restaurants keep QR menu systems in place post-pandemic, though 81% of US diners still prefer physical menus over digital. (Source)
- 41% of operators are planning to introduce limited-time digital menu offers, while others are expanding healthy options, mocktails, and comfort foods. (Source)
- 71% of restaurant operators plan to raise menu prices due to rising food and labor costs. 35% of restaurants are adding more affordable menu options to balance price increases and retain customers. (Source)
- 72% of diners associate digital menus with greater professionalism, driving 15% higher repeat bookings for tech-forward restaurants. (Source)
- Average order value increases 22% with high-quality digital menu images and interactive features like chef videos and pairing suggestions. (Source)
- Value-added menus and low-price deals, e.g., $3–$5 meals, are expanding to attract budget-conscious customers. (Source)
- 31% of operators are exploring dynamic pricing, adjusting prices based on demand, time, or season. (Source)
- Quick-service restaurants’ digital signage is expected to grow from $3.3 billion to $12.78 billion by 2034, driven by dynamic menu boards and promotions. (Source)
Restaurant Online Ordering & Delivery Trends (2026)
- The US online meal delivery market is expected to reach 196 million users by 2030, with user penetration at 53.9% in 2026. (Source)
- 66% of consumers wish to have more takeout options, while 61% want more restaurants that offer delivery and drive-thru services. (Source)
- 58% of customers prefer to use a restaurant’s own app or website for food delivery, rather than a third‑party platform. (Source)
- Drive-thru remains the top choice, with 90% of Gen Z using it weekly, while 69% still use delivery at least once a week. (Source)
- Delivery orders are costing up to 80% more than pickup. So, delivery spending has dropped by about 12%, while pickup orders have increased by 14%. (Source)
- 91% of diners say online reviews influence their restaurant choices, with 64% consulting them before placing an order on delivery platforms. (Source)
Restaurant Labor Market Trends (2026)
- 9 in 10 restaurants have fewer than 50 employees. And 63% of adults are gaining work experience in the industry. (Source)
- There were 916,000 job openings in the combined restaurants and accommodations sector, reflecting ongoing hiring demand. (Source)
- Around 70% of restaurant operators report difficulty filling positions, while 45% of restaurants still don’t have enough staff to meet demand. (Source)
- Restaurants and bars lost about 30,000 jobs in February 2026 on a seasonally adjusted basis. It’s the largest monthly drop since February 2025. (Source)
- 37% of restaurants plan to adopt automated labor management systems, while 28% explore AI-driven staffing solutions for efficiency. (Source)
- The shrinking 16-24-year-old population poses long-term labor force challenges, necessitating workforce development and immigration reform. (Source)
- Average hourly earnings in the U.S. food service industry reached $21.57/hour as of January 2026, continuing an upward trend. (Source)
| Data series | Oct 2025 | Nov 2025 | Dec 2025 | Jan 2026 |
|---|---|---|---|---|
| Average hourly earnings | $21.37 | $21.48 | $21.80 | $21.57 |
| Average weekly hours | 25.2 | 25.2 | 25.0 | 24.3 |
Restaurant Marketing Strategies & Promotions in 2026
- Around 55% of restaurant owners are now using AI to create marketing content, reducing workload while improving communication and personalization. (Source)
- 90% of restaurants say social media is very/extremely important to their digital marketing strategy, driving 9.9% average B2C revenue growth. (Source)
- 73% of Millennials and Gen Z say social media is the top driver for trying new restaurants. 55% choose based on positive online feedback, while 29% refer to discounts or promotions. (Source)
- Nearly 44% of diners turn to social media for restaurant recommendations, compared to 39% who rely on review sites like Google and Yelp. (Source)
- Acquiring a new customer costs 5–7 times more than retaining an existing one, driving a shift to retention-first marketing. (Source)
- 58% of guests feel that AI-driven platforms can effectively anticipate their needs and provide personalized recommendations. (Source)
Restaurant Consumer Behavior & Dining Trends (2026)
- 61% of Americans say dining out in 2026 feels more like a special occasion than an everyday activity, reflecting how consumers value experiences beyond the meal itself. (Source)
- 85% of consumers are holding back on spending because they are either very concerned about personal finances or taking a wait-and-see approach. (Source)
- More than 7 in 10 consumers say they would eat out more often if they had more disposable income, especially Gen Z and millennials. (Source)
- Millennials are the most frequent restaurant‑goers in 2026, planning to dine out 14 times per month on average. (Source)
- 49% of consumers want more spontaneous dining experiences (e.g., last‑minute reservations or walk‑ins) in 2026, indicating a shift in how diners plan their restaurant visits. (Source)
- Happy hour dining (4:00-4:59 PM) increased 13% year-over-year, as diners look for more value when eating out. (Source)
- 68% of U.S. consumers say they are cutting back on restaurant dining in 2026 due to inflation and value prioritization. Consumers’ average weekly spend on restaurants dropped to about $90—$25 less than in June 2025. (Source)
- 73% of Gen Z say food quality is a top reason for disappointment, compared to 57% of all diners. (Source)
Restaurant Industry Sales & Financial Projections (2026)
- 60% of leaders prioritize sales performance as top 2026 focus, followed by cost control (17%) and guest experience (15%). (Source)
- Real GDP growth for the restaurant industry is at 2.7%, up from 2.3% in 2025. (Source)
- Technomic Data firm forecasts that the nominal foodservice sales growth of 5.1% in this year, compared to 3.1% in 2024. (Source)
- 42% of restaurant operators were not profitable in 2025, due to rising costs and uneven customer traffic continuing to impact margins. (Source)
- 46% of operators plan to open new locations: 22% one site, 19% 2-5 sites, 5% six or more. (Source)
- Full-service restaurants saw the biggest uptick in off-premise traffic, reaching 30% for full-service restaurants and 83% for limited-service restaurants, up from 2019 sales levels. (Source)
Restaurant Payment Methods & Technology Trends (2026)
- Contactless ordering and payment options have grown from 22% before 2020 to over 75% today across restaurants. (Source)
- Cash is now used for only 16% of restaurant payments, down from 31% in 2017. Credit cards make up about 32% of payments, while most customers now prefer cashless options like contactless cards or mobile payments. (Source)
- 53% US consumers prefer contactless for in-store payments. Gen Z Apple Pay holds the top position with tap-to-pay cards (36%) outpacing mobile wallets (14%). (Source)
- 92% of QSRs use contactless technology, with mobile ordering (87%) and self-service kiosks (63%) as the most common. (Source)
- 84% of casual dining restaurants offer contactless options, mainly QR code menus (79%) and tableside payments (64%). While 67% of fine dining restaurants use contactless tools for reservations and pre-ordering. (Source)
Restaurant Food Trends & Sustainability in 2026
- 73% of consumers are very likely to try new restaurants offering small plates or sharing formats. (Source)
- 46% of consumers say food quality is the most important factor when choosing a restaurant to dine in. Also, 39% say they return to a restaurant mainly because the food quality stays consistent. (Source)
- Experiential dining trends are growing, with restaurant experiences (pop‑ups, chef’s tables, collaborations) increasing 46% year over year as diners seek memorable food experiences. (Source)
- Nearly 50% of US restaurants offer plant-based options, a 62% increase over recent years, emphasizing health-forward innovation. (Source)
- 64% of consumers perceive global instability, increasing demand for transparent, sustainable restaurant choices. (Source)
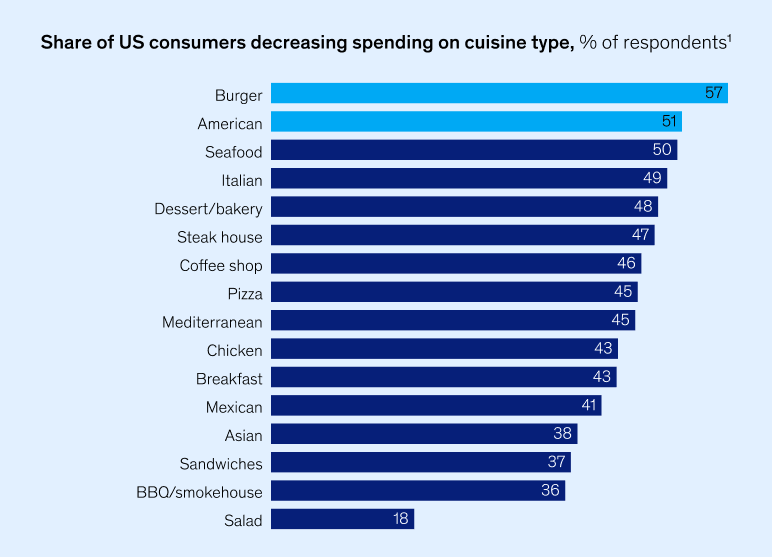
- 57% of diners plan to cut back on burgers, versus just 18% for salads, signaling health investments. (Source)
Restaurant AI Adoption & Trends (2026)
- 69% of US restaurants are actively adopting AI tools to improve profit margins and enhance guest retention strategies. (Source)
- Nearly 26% of restaurant operators are currently using AI across operations, with 60% matching tech adoption to competitors. (Source)
- 82% of restaurant executives plan significant increases in AI technology investments throughout 2026. (Source)
- About 55% of fast-casual restaurants use kitchen automation tools such as AI kitchen display systems, smart ovens, and robotics. These tools help reduce cooking time by about 30% and cut order mistakes by around 50%. (Source)
- 97% of restaurants are focusing on guest experience improvements through various AI-driven personalization tools. (Source)
- AI-powered personalization (recommendation engines) boost average order values by 18-26% in restaurants that have successfully implemented the technology. (Source)
Most Popular & Profitable Restaurant Types (2026)
Restaurants revolve around different concepts and types. Considering current industry trends, quick‑service restaurants (QSRs), followed by cafes, food trucks, and ghost kitchens, are increasingly on the rise.
Here are the most popular restaurant types in 2026.
Quick-Service Restaurants (QSR)
Fast-food restaurants usually earn 6–9% profit. They make money through high sales volume, simple menus, and fewer staff, which keeps costs lower.
Fine Dining Restaurants
Fine dining restaurants earn about 2–5% profit. They charge higher prices, but expensive ingredients, skilled chefs, and premium dining environments increase costs, which lowers profit margins.
Cafes and Fast-Casual Restaurants
Cafes and fast-casual restaurants usually earn 12-18% profit. They often have lower operating costs and slightly higher pricing, which helps improve profitability.
Full-Service Restaurants
Full-service restaurants typically earn 2–6% profit. They offer table service and more complex meals, which increases labor and operating costs.
Food Trucks
Food trucks can earn 7–15% profit because they do not pay rent for a permanent location and have lower overhead costs.
Bars
Bars usually earn 10–15% profit. Alcohol has very high markups, which helps bars generate higher profits compared to most restaurants.
Let AI draft your restaurant business plan in minutes

Top 10: Popular Restaurant Franchises
Here are the top-rated restaurant franchise picks in the USA to choose the best option for your restaurant idea.
| Franchise | Customer Satisfaction Index Score |
|---|---|
| Chick‑fil‑A | 83 |
| Starbucks | 80 |
| Panda Express | 80 |
| Arby’s | 79 |
| Panera Bread | 79 |
| Papa John’s | 79 |
| Domino’s | 78 |
| Dunkin’ | 78 |
| Chipotle Mexican Grill | 75 |
| Subway | 75 |
Source: American Customer Satisfaction Index (ACSI) 2025 Restaurant and Food Delivery Rankings.
Top 10: Popular Chain Restaurants
Here are the top chain restaurants in the USA and their penetration in the market.
| Restaurant chain | No. of outlets (2026) |
|---|---|
| Subway | 20,118 |
| Starbucks | 16,935 |
| McDonald’s | 13,794 |
| Hunt Brothers Pizza | 10,489 |
| Dunkin’ | 9,990 |
| Taco Bell | 8,243 |
| Domino’s | 7,173 |
| Pizza Hut | 6,739 |
| Burger King | 6,604 |
| Wendy’s | 5,830 |
Source: ScrapeHero
How These Stats Impact Restaurants
These statistics provide restaurateurs with detailed insights and clarity about what to do. To conclude this post, here are some key takeaways for you:
- Go digital or get left behind. Online orders/delivery now drive more sales. So use user-friendly platforms to capture this revenue now.
- Tech = profit protection. Businesses adopt AI for seamless operations and push contactless payments. Implement real-time analytics to cut waste and boost satisfaction instantly.
- Smart menu curation is essential to stop the rising inventory prices from eating away at your profit margins. Test digital menus for demand-based pricing.
- Train to retain amid 70% shortages. Invest in cross-training and workforce development to keep quality staff and retain them longer.
- Social media for free traffic. 55% try restaurants from positive reviews (vs 29% discounts). Post daily, create buzz, and reply fast.
- Win Gen Z with experiences. Add personal touches via apps/data for repeat visits and higher checks.
We hope these statistics guide you in the right direction to make essential changes in your restaurant operations.
Frequently Asked Questions
What kind of people work in restaurants?
Is the restaurant industry growing or shrinking?
What is the growth rate of the restaurant industry in 2026?
What is the fastest-growing category in the restaurant business?
What percentage of restaurants are profitable?

Kruti Shah
Kruti is a passionate and skilled writer with a knack for business management. She loves to talk and write about small business, startups, business growth, and planning. Besides writing, she loves to read and explore the world. Read more