A full-service restaurant costs more to open than most small businesses, and a lender will want to see how the dining room pays that money back. Two numbers decide most of the answer: how many guests the seats can serve each day, and how much of each check is left after food and labor. A useful plan ties both to the menu, the staff schedule, and the lease.
This sample follows Heritage Kitchen, a fictional 62-seat farm-to-table bistro opening in Brightwater, Colorado, with a $375,000 SBA loan request. It shows how a seasonal menu keeps food cost at 30%, how the staff schedule follows each day’s guest count, and why returning guests drive most of the growth. It also shows an honest Year 1 loss and the cash reserve set aside to cover it.
Executive Summary
Brightwater has plenty of places to grab a burger or a grain bowl. Residents who want a chef-cooked seasonal dinner with real table service still drive about 20 minutes into Denver for it. The town’s medical and office park has the same gap at lunch, where workers who want to sit down and be served have few choices nearby.
Heritage Kitchen, LLC will fill both gaps with a 62-seat farm-to-table bistro in the retail center next to the park. Our menu changes with Colorado’s growing seasons, and we’ll run three services from one kitchen:
- Lunch, Tuesday through Sunday: Quick, sit-down plates for office and medical staff who have about an hour
- Dinner, Tuesday through Sunday: Full table service, a 12-seat bar and chef’s counter, and a short list of Colorado beer, wine, and cocktails
- Private dining: A 14-seat room for birthdays, rehearsal dinners, and business meals
Chef Daniel Lewis and general manager Erin Caldwell own the business equally. They bring more than 25 years of combined experience from busy Denver kitchens and dining rooms.
Our mission is to serve Brightwater seasonal, Colorado-grown food with warm, attentive service at a price neighbors can enjoy every few weeks.
Our advantage is the middle ground we hold. The chain grill nearby is cheaper and faster, and Denver’s best kitchens are more ambitious, but neither gives a local family a chef’s cooking and a ten-minute drive home.
We expect steady growth as regular guests come back more often:
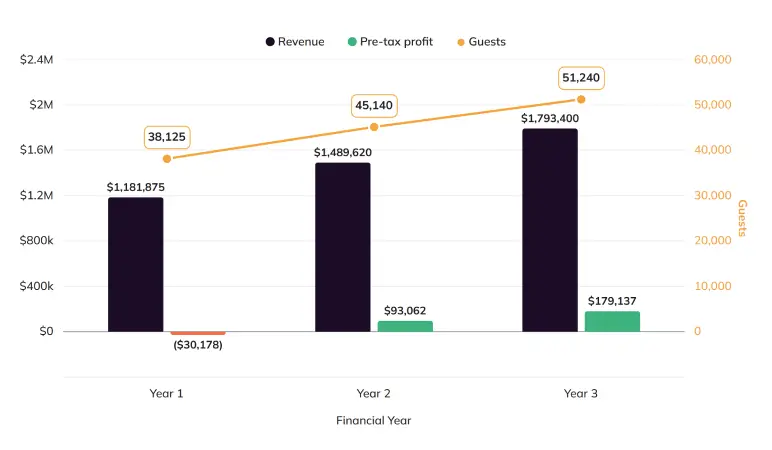
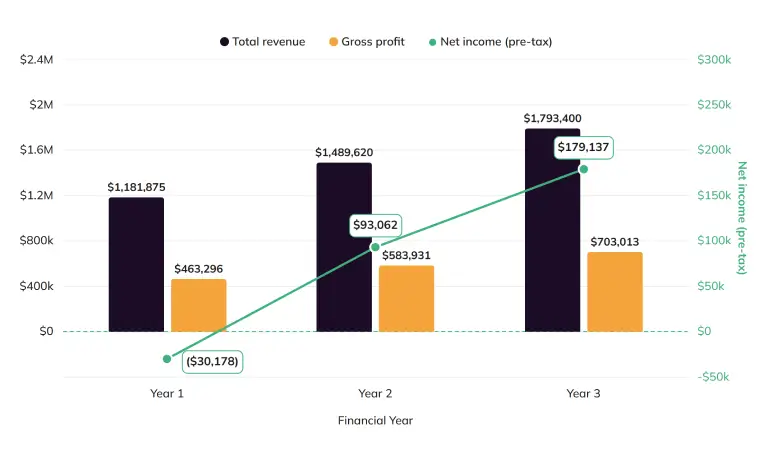
- Year 1: 38,125 guests and $1,181,875 in revenue, with a pre-tax loss of $30,178 that comes mostly from one-time opening costs
- Year 2: 45,140 guests, $1,489,620 in revenue, and $93,062 in pre-tax profit
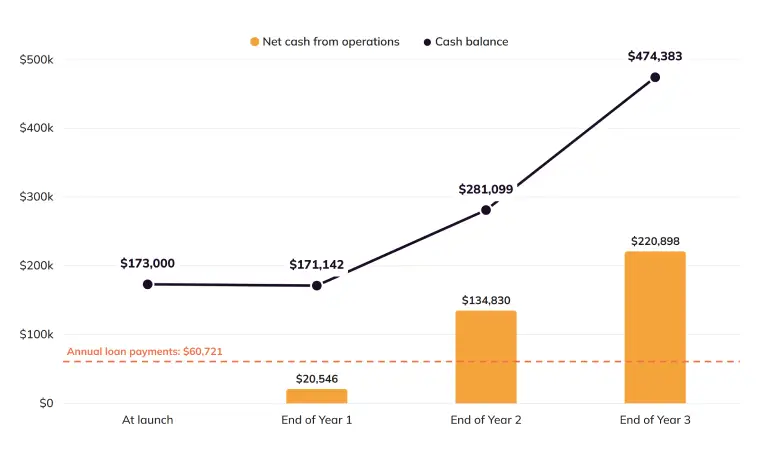
- Year 3: 51,240 guests, $1,793,400 in revenue, $179,137 in pre-tax profit, and $474,383 in the bank
We’re requesting a $375,000 SBA 7(a) loan from Summit Peak Bank, and the owners are adding $150,000 of their own money. The $525,000 will pay for the kitchen, the buildout, the dining room, and opening costs, and it keeps a $143,000 working-capital reserve in the bank. Cash from operations stays positive in all three years, and by Year 2 our operating earnings cover the loan payments 2.8 times.

Company Overview
Heritage Kitchen started with something Daniel and Erin heard again and again in Denver. Many of their regular guests drove in from the same southern suburbs where the two of them live. Those guests often asked why nobody served this kind of food closer to home. This question led Daniel and Erin to Brightwater and to a menu built around food raised within a few hours of the kitchen.
Legal Structure & Ownership
Heritage Kitchen is a Colorado member-managed limited liability company based at 2480 Meadowlark Parkway, Suite 110, Brightwater, CO 80134. Daniel Lewis and Erin Caldwell each own 50%, and each contributed $75,000 in cash.
We chose an LLC because it protects our personal assets and passes profits through to our own tax returns. This is also why our projections are shown before income tax.
Vision & Goals
Our vision is to become the place Brightwater families choose for Friday dinners, birthdays, and weekday lunches alike. In time, we want to run it well enough to open a second Front Range location.
To get there, we’ve set goals we can check against our monthly reports:
- Open for lunch and dinner in spring 2027, with the liquor license approved before the first service
- Keep prime cost, which is food, beverage, and hourly labor combined, within one point of 61% of sales from the first full quarter
- Earn a Google rating of 4.6 stars or better from at least 300 reviews by the end of Year 1
- Promote our lead line cook to sous chef in Year 2, so Daniel can step back from some lunch shifts
- Buy at least 40% of our food from Colorado farms and ranches, measured every quarter
- Host four farm dinners a year with partner growers, starting in our first summer
Market Analysis
Heritage Kitchen depends on guests who live or work a short drive away. We look briefly at U.S. and Colorado spending, then focus on Douglas County, where Brightwater sits south of Denver.
Restaurant Spending Near Denver
The National Restaurant Association expects U.S. restaurant and foodservice sales to reach $1.55 trillion in 2026. Real growth after higher menu prices is only 1.3%. This means a new restaurant grows mainly by winning guests from other places to eat.
Colorado is a hard market to win those guests in. Colorado Department of Labor and Employment data show the state lost 498 eating and drinking places between the first quarter of 2024 and the first quarter of 2025, while Colorado menu prices run about 5.1% above the national average in 2026. A new opening needs a clear reason for guests to choose it.
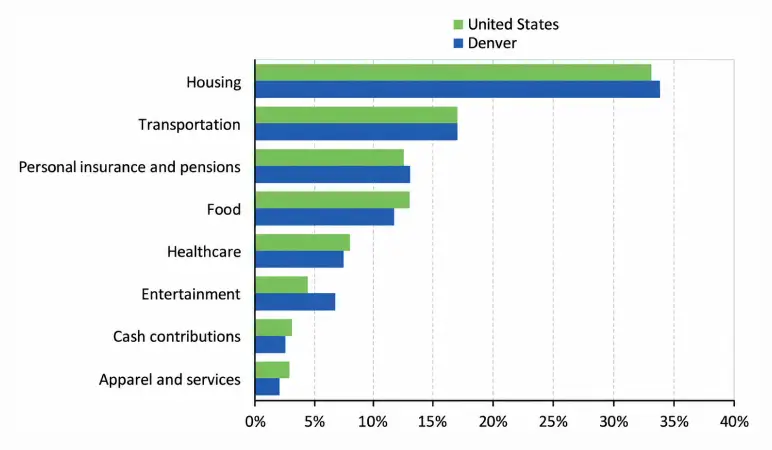
Spending in the Denver area is strong enough to support that choice. Households in the Denver metro spend $4,903 a year on food away from home.
Douglas County Diners
Zooming into Douglas County, the opportunity becomes clearer. The county had 399,396 residents in July 2025, and its population has grown 11.6% since 2020, which keeps demand for local dining growing.
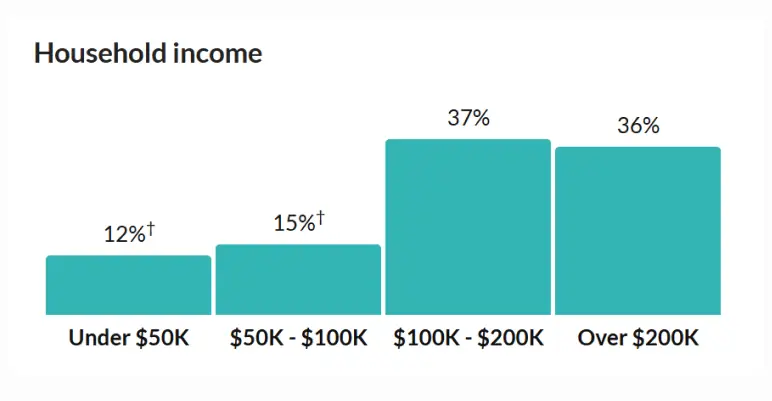
These households can afford to eat out often. Douglas County’s median household income is $151,659, and 118,700 of its 147,825 households, or 80.3%, earn $75,000 or more.
We only need a small share of this spending. A couple who has dinner with us four times a year spends about $288. This is under 6% of the $4,903 a year that Denver-area households spend eating out, as noted above.
Dining Trends
Three trends matter most to a seasonal, full-service restaurant like ours:
- Restaurant prices are rising faster than grocery prices. Full-service meal prices rose 3.5% in the 12 months to August 2026, compared with 2.2% for food at home. Guests notice the gap, and this keeps them looking for good value at a mid-range check.
- Local sourcing is in demand. Local sourcing ranks as the top trend in the National Restaurant Association’s 2026 culinary forecast, which supports a menu built around Colorado farms.
- Diners want to eat out more often. More than 7 in 10 consumers say they would use restaurants more frequently if they had more disposable income, according to the National Restaurant Association’s 2026 report. Douglas County’s high household incomes mean more of its residents can act on that.
Target Guests
We’ll serve three groups, and each one fills a different part of the week:
- Brightwater households: Couples and families, mostly ages 30 to 55, who make up most of our dinner guests. They book Thursday through Saturday, often online, and come back when the menu changes.
- Weekday lunch guests: Doctors, nurses, and office staff from the park next door. They have 45 to 60 minutes, order a main and a drink, and return every week if service is quick and reliable.
- Occasion groups: Birthday parties, rehearsal dinners, and business meals in the private room. They help us keep Sunday evenings, early-week nights, and the slower winter months busy.
Dinner makes up 64% of our Year 1 covers, and lunch makes up the rest.
Competitors
We first decided what Heritage Kitchen would do better than anyone nearby. Then we looked at who already serves the same guests and where each of them is stronger:
| Competitor | Type | Average check | Seats | Strengths | Weaknesses |
| Copper Ridge Grill | Regional casual-dining chain, one mile away | $24 | 180 | Brand recognition, fast service, large parking lot, busy happy hour, and a big marketing budget | Same menu all year, no local sourcing, and no private room |
| Juniper & Ash | Chef-driven restaurant in central Denver | $62 | 85 | Strong reputation, creative menu, and the first choice for many anniversaries | A 20-minute drive each way, paid parking, and reservations booked weeks ahead |
| The Lantern Tap House | Local pub in Brightwater | $22 | 90 | Late hours, sports on TV, and a loyal crowd of regulars | Bar food and few families at dinner |
| Greenleaf Kitchen Co. | Fast-casual bowl and salad shop inside the office park | $15 | 30 | Five-minute pickup, online ordering, and low prices | No table service, no alcohol, and closed at dinner |
Copper Ridge is our strongest rival for family dinners, and Greenleaf will keep many workers who are in a hurry at lunch. Juniper & Ash wins most big celebrations, but every booking there means a long evening away from home.
Indirect competitors include delivery apps, supermarket prepared foods, and home cooking, which compete mainly for weeknight dinners.
Competitive Advantage
Heritage Kitchen won’t beat Copper Ridge on price or speed, and it won’t match Juniper & Ash for ambition. Our advantage is Daniel’s seasonal, Colorado-sourced cooking with full table service at a $31 check, ten minutes from home. This gives a Brightwater couple a reason to stay local on a Friday night. It also gives the office park a sit-down lunch that a fast-casual counter can’t offer.
Menu & Pricing
Heritage Kitchen’s menu has two jobs. It needs to give Brightwater guests a reason to come back each season, and it needs to keep food and beverage cost at 30% of sales. Daniel keeps it simple, with about 22 items at dinner. This helps a small team cook every dish well on a busy Saturday.
Sample Menu
Each part of the menu has its own price range and food-cost target:
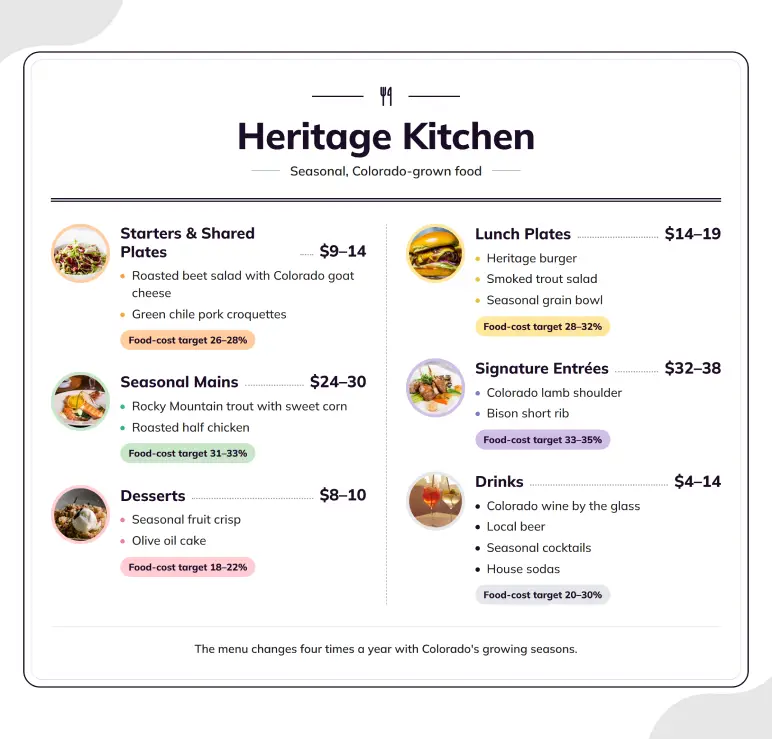
At these prices, we expect lunch guests to spend about $22 and dinner guests about $36 in Year 1. Together, they give us a $31 average check, which is what each guest spends on average.
Dish Pricing
Daniel prices every dish from its plate cost, which is what the ingredients on one plate cost us. Here’s how six sample items work out:
| Item | Plate cost | Menu price | Food cost | Left per plate |
| Roasted beet salad | $3.40 | $13 | 26.2% | $9.60 |
| Heritage burger | $5.80 | $18 | 32.2% | $12.20 |
| Rocky Mountain trout | $9.10 | $28 | 32.5% | $18.90 |
| Colorado lamb shoulder | $12.20 | $34 | 35.9% | $21.80 |
| Seasonal fruit crisp | $1.80 | $9 | 20.0% | $7.20 |
| Seasonal cocktail | $2.90 | $13 | 22.3% | $10.10 |
The lamb shoulder will likely be a bestseller, but at 35.9% it’s above our 35% limit for any single plate. Before we open, Daniel will cut the portion from 10 to 8 ounces and add a farro side. This brings the plate cost to about $11.00, or 32% of the price.
Desserts, drinks, and starters stay below 30%, which helps us balance the higher-cost mains. Changing the menu four times a year also helps us manage cost. We buy what local farms have plenty of, when prices are lowest.
Private Dining & Farm Dinners
Beyond the regular menu, we’ll offer:
- Private room menus: Three-course set menus from $45 per guest for groups of 10 to 14, booked with a deposit
- Farm dinners: Ticketed five-course dinners on four Sunday evenings a year, cooked with produce and meat from one partner farm
- Gift cards: Sold in the restaurant and online, with a holiday push in November and December
We count these guests in our regular dinner numbers.
What We Don’t Offer
A few things are left out on purpose:
- Third-party delivery, because app commissions would push the cost of each order well past our 30% target
- Breakfast and late-night service, which would need a third shift
- A long spirits list, since the bar keeps to Colorado beer and wine and six seasonal cocktails
Operations Plan
Heritage Kitchen runs lunch and dinner from one kitchen. Our schedules and prep have to match the number of guests we expect each day.
Location & Facility
We’ll lease a 2,600-square-foot end unit in a neighborhood retail center on Brightwater’s main east-west road. The medical and office park shares the center’s parking lot, which has about 180 spaces. Our unit has signage facing the road and room for a patio along its side wall.
The 10-year lease keeps rent at $9,000 a month, or $108,000 a year, for the full term. We’ve paid $24,000 upfront as a security deposit and prepaid rent.
The space includes:
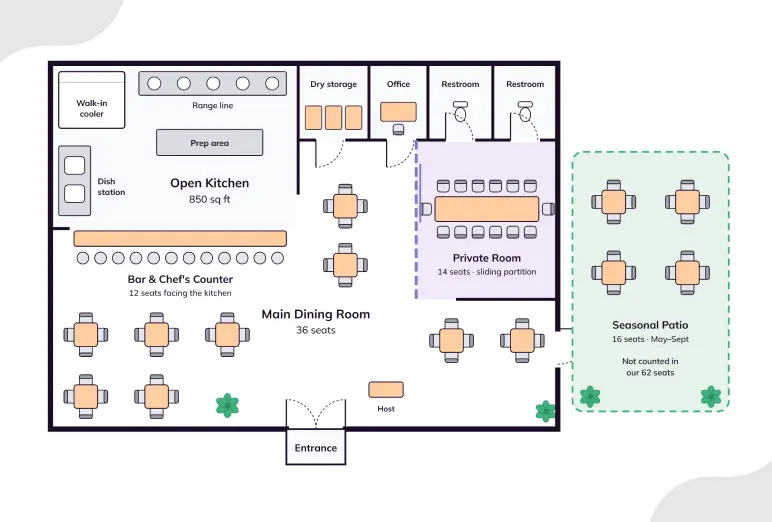
- A 36-seat main dining room plus a 14-seat private room that closes off with a sliding partition
- A 12-seat bar and chef’s counter facing the open kitchen
- An 850-square-foot kitchen with a walk-in cooler, a prep area, and a dish station
- Two restrooms, a small office, and dry storage
A 16-seat patio will open from May through September. We don’t count it in our 62 seats or our guest projections, so summer patio sales are extra.
Hours of Operation
We’re open six days a week:
- Tuesday – Thursday and Sunday: Lunch 11:00 AM – 2:30 PM, dinner 5:00 PM – 9:30 PM
- Friday – Saturday: Lunch 11:00 AM – 2:30 PM, dinner 5:00 PM – 10:00 PM
- Monday: Closed for deep cleaning, inventory counts, and testing new dishes
After seven holidays, this gives us 305 operating days a year.
Daily Workflow
A typical service day follows the same steps:
- 7:30 AM: The prep cook checks produce and meat deliveries against the invoices and starts stocks, sauces, and butchery.
- 10:30 AM: Lunch setup and a five-minute team meeting on specials and reservations.
- 11:00 AM – 2:30 PM: Lunch service, with tickets timed so office guests can finish in under 50 minutes.
- 2:30 PM – 4:30 PM: The kitchen resets, the team eats a staff meal, and dinner prep begins.
- 5:00 PM to close: Dinner service, with Daniel checking every plate before it leaves the kitchen and Erin running the floor.
- After close: Cleaning, then Erin’s review of the nightly sales and labor report.
Seating & Capacity
Here’s how we expect covers, the restaurant word for guests served, to fall across a typical week:
| Day | Year 1 lunch | Year 1 dinner | Year 3 lunch | Year 3 dinner |
| Tuesday | 40 | 60 | 60 | 85 |
| Wednesday | 45 | 65 | 65 | 90 |
| Thursday | 45 | 75 | 65 | 105 |
| Friday | 50 | 105 | 70 | 140 |
| Saturday | 40 | 110 | 55 | 145 |
| Sunday | 50 | 65 | 63 | 65 |
| Weekly total | 270 | 480 | 378 | 630 |
Saturday dinner already uses every seat almost twice in Year 1. By Year 3 it reaches 145 guests, close to the most a 62-seat room can serve in five hours once couples sit at four-person tables.
This means most of our growth has to come from Tuesday through Thursday and from lunch, when we have open seats. Our promotion budget and loyalty offers focus on those slower days.
Suppliers
We’ll work with a small group of vendors, all on Net-15 payment terms:
- Kestrel Farm Collective: Seasonal produce, eggs, and dairy from Front Range farms, ordered weekly around the current menu
- Elk Meadow Ranch: Lamb, beef, and pork, delivered twice a week
- Blue Spruce Trout Co.: Colorado rainbow trout, delivered twice a week
- Highline Provisions: Dry goods, oils, paper products, and cleaning supplies, plus backup produce and meat
- Mile Marker Beverage: Colorado beer and wine, with spirits from a licensed wholesaler
Highline’s backup supply matters more than it first seems. When a farm has a short harvest, the kitchen changes one special and keeps the rest of the menu the same.
Licenses, Permits & Insurance
Before we open, Heritage Kitchen needs these approvals:
- LLC registration with the Colorado Secretary of State, a federal EIN, and a state sales tax license
- Building permits for the buildout, a fire inspection, and a certificate of occupancy
- A plan review and retail food license from the Douglas County Health Department, under the state’s retail food rules
- A certified food protection manager on site during all hours of operation, which Colorado has required since March 1, 2025
- A hotel and restaurant liquor license, approved first by the local licensing authority and then by the state Liquor Enforcement Division
- Workers’ compensation, unemployment insurance, and Colorado FAMLI premiums for every employee
Our $14,000 Year 1 insurance budget covers general liability, liquor liability, property, business interruption, and key-person life policies on both owners. We’ll file for the liquor license as soon as the lease is signed, since it takes the longest to approve.
Promotion & Loyalty
Heritage Kitchen grows from 125 guests a day in Year 1 to 168 by Year 3, and most of that growth comes from the same guests returning more often. Our promotion has two parts: a launch that gets Brightwater in the door, and a loyalty program that helps turn a first visit into a habit.
Opening Launch
The $12,000 launch budget in our startup costs pays for:
- Branding, a website with online reservations, and food photography ($6,500)
- Three preview dinners for neighbors, office-park staff, and local business owners before we open ($3,500)
- Opening-month outreach to local media, schools, community groups, and neighborhood social media pages ($2,000)
Promotion Channels
Our ongoing promotion budget is $24,000 in Year 1, $30,000 in Year 2, and $36,000 in Year 3. In Year 1, we’ll spend it this way:
| Channel | What it does | Year 1 budget |
| Google Business Profile and local search ads | Reaches people searching for “restaurants near me” and sends them to online reservations | $6,000 |
| Instagram and Facebook | Shows each new seasonal menu and weekly special to households within a 10-minute drive | $5,400 |
| Loyalty rewards | Pays for points redemptions and birthday offers | $4,000 |
| Office and medical park lunch program | Tasting drop-offs, a lunch punch card, and a standing table for team lunches | $3,600 |
| Farm dinners and community events | Quarterly farm dinners and sponsorships of local schools and youth teams | $3,000 |
| Local partnerships and print | Chamber membership, hotel concierge cards, and seasonal mailers | $2,000 |
| Total | $24,000 |
Instagram and Facebook get a large share because a seasonal menu gives us something new to show every few weeks. Search ads and the lunch program help us reach people who are deciding where to eat today.
Loyalty & Repeat Visits
Repeat visits get more of our attention than new guests do. We’ll run a points program through our POS system from opening day, and members earn a free starter or dessert after every fifth visit.
We’ll keep guests coming back through:
- Reservation notes that record allergies, favorite tables, and anniversaries, so a second visit feels personal
- A monthly email with the new menu, farm dinner dates, and one midweek offer for members
- A Tuesday-to-Thursday neighbor night, with a free shared plate for tables of four
- The same dishes cooked the same way every night, with one of the owners on the floor at every dinner
If our regular households move from one visit every six weeks to one every four, we’ll reach our Year 2 and Year 3 guest counts without a much larger ad budget.
Management & Staffing
Heritage Kitchen’s two owners split the business by what each of them knows best. Both will work every dinner service in the first year.
Owners
Daniel Lewis, chef and co-owner, runs the kitchen, the menu, purchasing, and food cost. He has cooked professionally for 15 years, the last six as chef de cuisine of a 140-seat farm-to-table restaurant in Denver with about $3.2 million in yearly sales. There, he kept food cost between 29% and 31% while changing the menu every season.
Erin Caldwell, general manager and co-owner, leads the dining room, hiring, bookkeeping, lender reporting, and marketing. She spent ten years in front-of-house jobs and then three years as director of operations for a group of three Denver restaurants. In that role, she built the labor schedules, reviewed the monthly profit and loss statements, and helped open two locations.
Together, they cover two places where new restaurants often lose money. Daniel makes sure the kitchen stays on its food-cost target, and Erin makes sure the dining room is never staffed for a busier night than it gets.
Staffing Plan
We’ll hire 18 hourly employees in Year 1, most of them part-time. Here’s our Year 1 team:
| Role | Staff | Hours per week | Year 1 pay per hour | Denver metro average (May 2025) |
| Lead line cook | 1 | 40 | $22.00 | $20.94 (restaurant cooks) |
| Line cooks | 2 | 70 | $21.00 | $20.94 |
| Prep cook | 1 | 30 | $19.50 | $19.46 |
| Dishwashers | 2 | 64 | $18.50 | $18.79 |
| Servers | 7 | 120 | $12.69 plus tips | $24.94 including tips |
| Bartender | 1 | 30 | $12.69 plus tips | $24.96 including tips |
| Hosts and bussers | 4 | 36 | $16.00 plus a tip share | $18.97 (hosts) |
Our cooks earn at or above the Bureau of Labor Statistics averages for the Denver metro. Keeping good cooks costs less than training new ones. Servers and the bartender earn Colorado’s 2027 tipped minimum wage of $12.69 plus tips. Brightwater follows the state minimum wage of $15.71, which is well below Denver’s city rate.
We’ll schedule labor by the day and the service. A quiet Tuesday dinner runs with two servers and one dishwasher, while Friday and Saturday dinners use four servers, two dishwashers, and a busser. As guest counts grow, we’ll promote the lead line cook to sous chef in Year 2. By Year 3, we’ll have about 20 hourly employees, and hourly labor will stay near 28% of sales.
Risks & Mitigation
Restaurants do close often, though far less often than the old claim that 90% fail in their first year. An Ohio State University study of Columbus restaurants, published in 2003, found that 59% closed within three years. About 26% closed in the first year, 19% in the second, and 14% in the third. Most of the risks behind those closures are ones we can plan for and manage.
1) Food costs rise faster than menu prices. Beef, eggs, and produce can jump in price within a single season. We cost every dish before it reaches the menu, change the menu four times a year, and cap any single plate at 35%. Our average check also includes price increases of about 6% a year.
2) Hiring and keeping cooks. Good line cooks have plenty of choices across the Denver area. We’ll keep our cooks’ pay at or above the metro average, cross-train prep and line cooks, and post schedules a week ahead to keep hours steady.
3) A slower start. If guests come in more slowly than 125 a day, the $143,000 reserve helps us stay steady while we adjust the menu, hours, or promotion. In Year 1, the dining room turns about twice a day, well below what it can seat on a Saturday.
4) Quieter winter months. Traffic at suburban restaurants usually dips from January through March. Private-room bookings, December group dinners, and heartier winter menus help keep tables busy.
5) Less lunch traffic from the park. If fewer park workers come in, we’ll shift lunch promotion toward residents, retirees, and Sunday families.
6) Loan payments. Our payments total $60,721 a year. In Year 1, operating earnings of $49,568 cover them only 0.82 times, so we’ll pay the $11,153 difference from our $143,000 working-capital reserve. In Year 2, operating earnings cover the payments 2.8 times, and in Year 3, they cover them 4.2 times.
7) Owner dependence. If Daniel or Erin is out for several weeks, the lead line cook can run the kitchen, and a trained shift lead can close the floor. Key-person insurance helps with the cost of extra help.
We also tested a weaker first year. If Year 1 guests came in 10% below our projection, the restaurant would still cover its operating costs, and the pre-tax loss would grow to about $76,500. We’d still end the year with about $125,000 in cash, and if Year 2 also came in 10% light, operating earnings would still cover the loan payments 1.8 times.
Financial Plan
Heritage Kitchen’s financials follow directly from the decisions in the sections above. Revenue comes from daily guests multiplied by the average check. The menu keeps food and beverage cost at 30% of sales, the staffing plan keeps hourly labor at 28%, and the lease sets rent at $108,000 a year. The startup budget is funded by $150,000 from the owners and a 10-year, $375,000 SBA 7(a) loan at a 10.5% fixed rate.
Our Year 1 loss of $30,178 is close to the $30,000 we spend once on launch marketing, licenses, and professional fees. Without those costs, Year 1 would break even after depreciation and interest, and our cash reserve covers the difference. From Year 2, the restaurant earns a steady profit.
Startup Costs
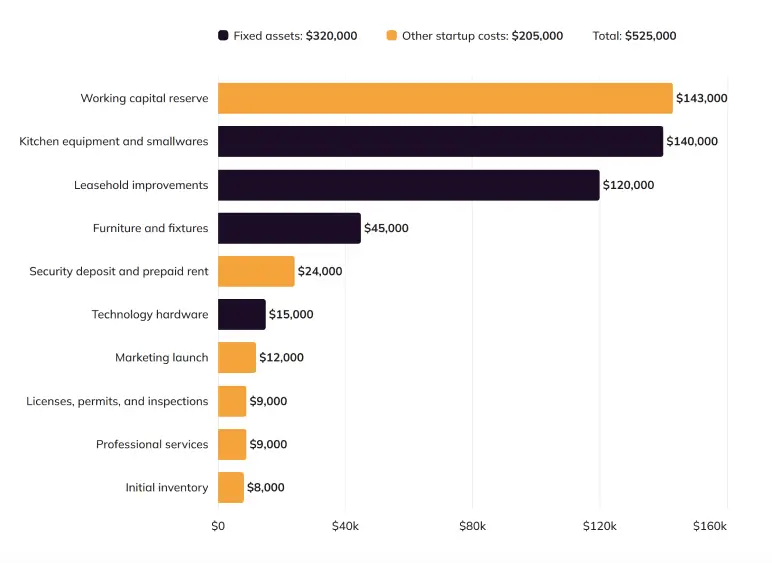
| Category | Amount |
| Fixed Assets | |
| Kitchen equipment and smallwares | $140,000 |
| Leasehold improvements | $120,000 |
| Furniture and fixtures | $45,000 |
| Technology hardware | $15,000 |
| Total fixed assets | $320,000 |
| Other Startup Costs | |
| Initial inventory | $8,000 |
| Security deposit and prepaid rent | $24,000 |
| Marketing launch | $12,000 |
| Licenses, permits, and inspections | $9,000 |
| Professional services | $9,000 |
| Working capital reserve | $143,000 |
| Total other startup costs | $205,000 |
| Total startup costs | $525,000 |
Sources of Funds
| Category | Amount |
| SBA 7(a) term loan (Summit Peak Bank) | $375,000 |
| Owner equity (Lewis and Caldwell) | $150,000 |
| Total startup capital | $525,000 |
Key Financial Assumptions
| Assumption | Year 1 | Year 2 | Year 3 |
| Covers per operating day | 125 | 148 | 168 |
| Operating days | 305 | 305 | 305 |
| Annual covers | 38,125 | 45,140 | 51,240 |
| Average check per guest | $31.00 | $33.00 | $35.00 |
| Revenue growth | – | 26.0% | 20.4% |
| Food and beverage cost (% of revenue) | 30.0% | 30.0% | 30.0% |
| Direct labor (% of revenue) | 28.0% | 28.0% | 28.0% |
| Payroll taxes (% of direct labor) | 10.0% | 10.0% | 10.0% |
| Prime cost (% of revenue) | 60.8% | 60.8% | 60.8% |
| Owner salaries | $135,000 | $145,000 | $160,000 |
| Payroll taxes (% of owner salaries) | 7.65% | 7.65% | 7.65% |
| Rent | $108,000 | $108,000 | $108,000 |
| Loan interest | $38,317 | $35,848 | $33,107 |
| Loan principal repaid | $22,404 | $24,873 | $27,614 |
Loan & Payment Terms
| Assumption | Details |
| Lender | Summit Peak Bank, SBA 7(a) program |
| Loan amount | $375,000 |
| Term and rate | 10 years at 10.5% fixed |
| Loan payment | $5,060 a month ($60,721 a year) |
| Accounts receivable | 2 days of revenue (card settlement) |
| Accounts payable | 15 days of food and beverage cost |
| Inventory on hand | 7 days of food and beverage cost |
| Security deposit and prepaid rent | $24,000, held constant |
| Income tax | Pass-through LLC, so projections are shown before income tax |
Depreciation Schedule
| Category | Cost | Useful life | Annual depreciation | Book value Year 1 | Book value Year 2 | Book value Year 3 |
| Kitchen equipment and smallwares | $140,000 | 7 years | $20,000 | $120,000 | $100,000 | $80,000 |
| Leasehold improvements | $120,000 | 10 years | $12,000 | $108,000 | $96,000 | $84,000 |
| Furniture and fixtures | $45,000 | 7 years | $6,429 | $38,571 | $32,142 | $25,713 |
| Technology hardware | $15,000 | 5 years | $3,000 | $12,000 | $9,000 | $6,000 |
| Total | $320,000 | $41,429 | $278,571 | $237,142 | $195,713 |
Profit & Loss Forecast
| Category | Year 1 | Year 2 | Year 3 |
| Revenue | |||
| Total revenue | $1,181,875 | $1,489,620 | $1,793,400 |
| Cost of Goods Sold | |||
| Food and beverage | $354,562 | $446,886 | $538,020 |
| Direct labor | $330,925 | $417,094 | $502,152 |
| Payroll taxes on direct labor | $33,092 | $41,709 | $50,215 |
| Total cost of goods sold | $718,579 | $905,689 | $1,090,387 |
| Gross profit | $463,296 | $583,931 | $703,013 |
| Gross margin | 39.2% | 39.2% | 39.2% |
| Operating Expenses | |||
| Owner salaries | $135,000 | $145,000 | $160,000 |
| Owner payroll taxes | $10,328 | $11,093 | $12,240 |
| Rent | $108,000 | $108,000 | $108,000 |
| Insurance | $14,000 | $14,500 | $15,000 |
| Accounting and bookkeeping | $9,000 | $9,000 | $9,500 |
| Phone and internet | $6,000 | $6,000 | $6,000 |
| Ongoing marketing | $24,000 | $30,000 | $36,000 |
| Utilities | $42,000 | $48,000 | $54,000 |
| Supplies | $18,000 | $22,000 | $26,000 |
| Repairs and maintenance | $9,000 | $11,000 | $13,000 |
| Technology subscriptions | $8,400 | $9,000 | $9,600 |
| Marketing launch (one-time) | $12,000 | $0 | $0 |
| Licenses and permits (one-time) | $9,000 | $0 | $0 |
| Professional services (one-time) | $9,000 | $0 | $0 |
| Total operating expenses | $413,728 | $413,592 | $449,340 |
| EBITDA | $49,568 | $170,339 | $253,673 |
| Depreciation | $41,429 | $41,429 | $41,429 |
| Operating income (EBIT) | $8,139 | $128,910 | $212,244 |
| Interest expense | $38,317 | $35,848 | $33,107 |
| Net income (pre-tax) | ($30,178) | $93,062 | $179,137 |
Cash Flow Forecast
| Category | Year 1 | Year 2 | Year 3 |
| Beginning cash | $173,000 | $171,142 | $281,099 |
| Operating Activities | |||
| Net income (pre-tax) | ($30,178) | $93,062 | $179,137 |
| Depreciation | $41,429 | $41,429 | $41,429 |
| Change in accounts receivable | ($6,476) | ($1,686) | ($1,665) |
| Change in inventory | $1,200 | ($1,770) | ($1,748) |
| Change in accounts payable | $14,571 | $3,794 | $3,745 |
| Rounding | $0 | $1 | $0 |
| Net cash from operations | $20,546 | $134,830 | $220,898 |
| Financing Activities | |||
| Loan principal repayment | ($22,404) | ($24,873) | ($27,614) |
| Net cash from financing | ($22,404) | ($24,873) | ($27,614) |
| Net change in cash | ($1,858) | $109,957 | $193,284 |
| Ending cash | $171,142 | $281,099 | $474,383 |
Opening Balance Sheet
| Category | At launch |
| Assets | |
| Cash | $173,000 |
| Inventory | $8,000 |
| Security deposit and prepaid rent | $24,000 |
| Fixed assets | $320,000 |
| Total assets | $525,000 |
| Liabilities | |
| Term loan | $375,000 |
| Total liabilities | $375,000 |
| Equity | |
| Members’ capital | $150,000 |
| Total members’ capital | $150,000 |
| Total liabilities & equity | $525,000 |
Projected Balance Sheet
| Category | Year 1 | Year 2 | Year 3 |
| Assets | |||
| Cash | $171,142 | $281,099 | $474,383 |
| Accounts receivable | $6,476 | $8,162 | $9,827 |
| Inventory | $6,800 | $8,570 | $10,318 |
| Security deposit and prepaid rent | $24,000 | $24,000 | $24,000 |
| Net fixed assets | $278,571 | $237,142 | $195,713 |
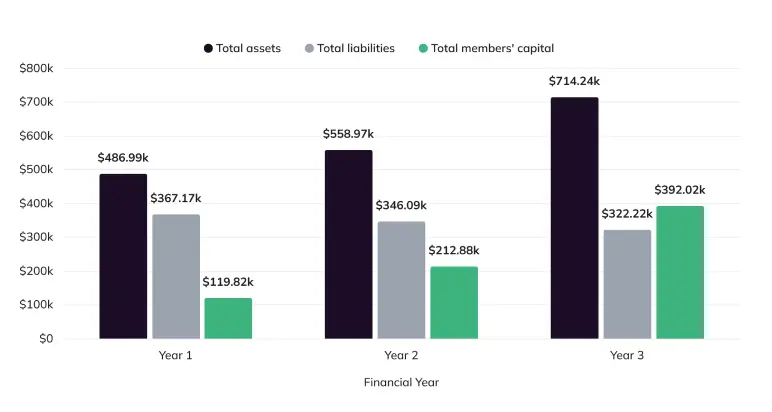
| Total assets | $486,989 | $558,973 | $714,241 |
| Liabilities | |||
| Accounts payable | $14,571 | $18,365 | $22,110 |
| Term loan | $352,596 | $327,724 | $300,110 |
| Total liabilities | $367,167 | $346,089 | $322,220 |
| Equity | |||
| Paid-in capital | $150,000 | $150,000 | $150,000 |
| Retained earnings | ($30,178) | $62,884 | $242,021 |
| Total members’ capital | $119,822 | $212,884 | $392,021 |
| Total liabilities & equity | $486,989 | $558,973 | $714,241 |
Break-Even Analysis
| Metric | Value |
| Average check per guest (Year 2) | $33.00 |
| Variable cost per guest (food, labor, and payroll taxes) | $20.06 |
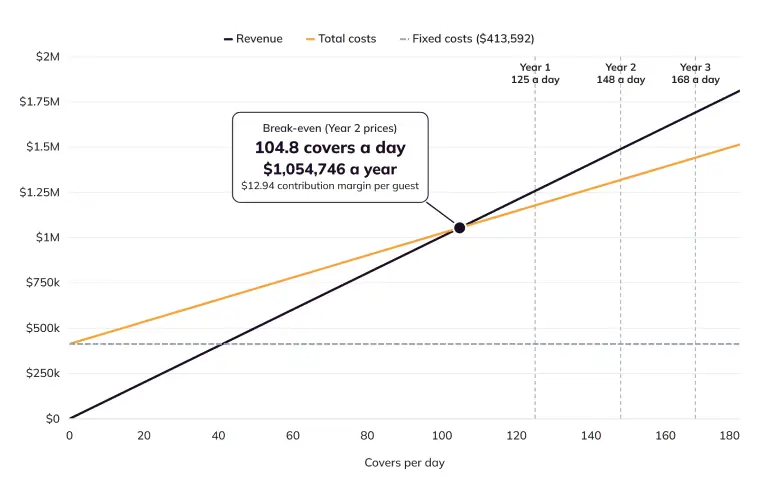
| Contribution margin per guest | $12.94 |
| Contribution margin | 39.2% |
| Monthly fixed costs (Year 2) | $34,466 |
| Break-even revenue per month | $87,896 |
| Break-even revenue per year | $1,054,746 |
| Break-even covers per day (Year 2) | 104.8 |
| Break-even covers per day (Year 1) | 111.6 |
| Operating break-even (before depreciation and interest) | Year 1, at 125 covers a day |
The Quickest Way to turn a Business Idea into a Business Plan
Fill-in-the-blanks and automatic financials make it easy.

Frequently Asked Questions
What sections should a restaurant business plan include?
How long should my restaurant business plan be?
How do I research my target market?
How often should I update my business plan?

Vinay Kevadia
Vinay Kevadiya is the founder and CEO of Upmetrics, the #1 business planning software. His ultimate goal with Upmetrics is to revolutionize how entrepreneurs create, manage, and execute their business plans. He enjoys sharing his insights on business planning and other relevant topics through his articles and blog posts. Read more