Executive Summary
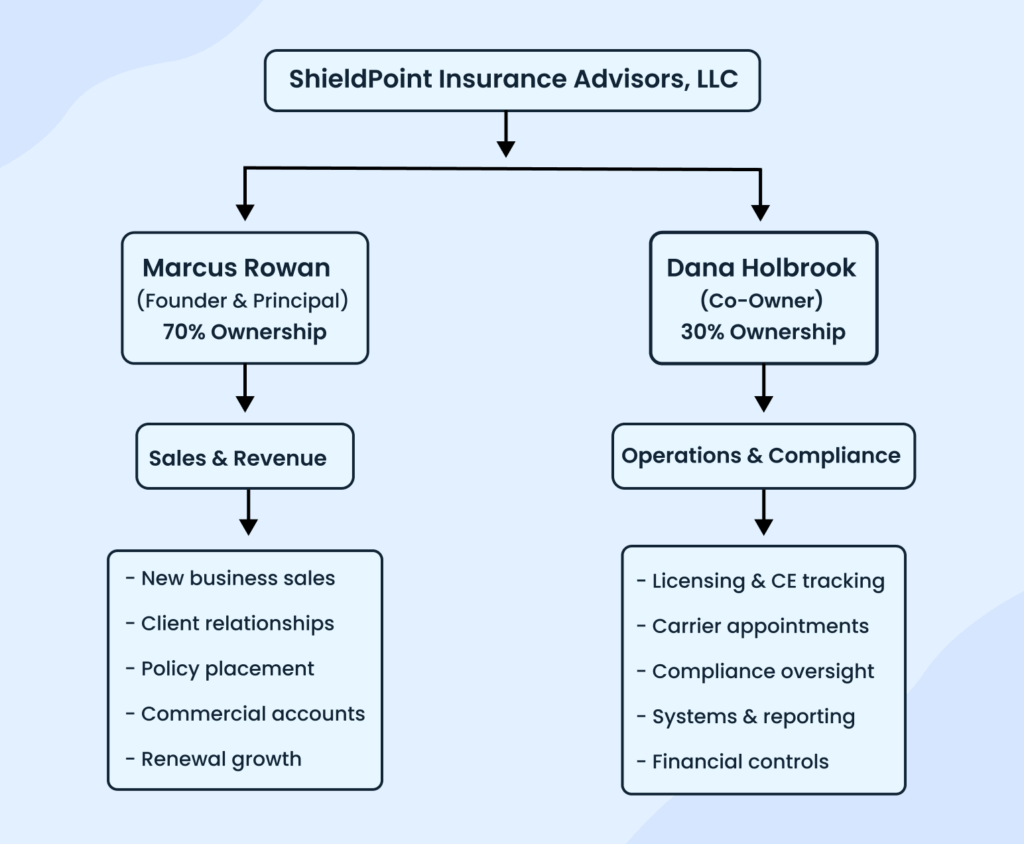
ShieldPoint Insurance Advisors, LLC requests $255,000 in total credit: a $180,000 term loan and a $75,000 working capital line of credit. We will launch an independent multiline insurance agency serving personal and commercial insurance customers in Atlanta, Georgia. Owner Marcus Rowan contributes $65,000 in documented capital and will provide personal guarantees. Dana Holbrook, our second owner, is the operations and compliance lead.
Marcus Rowan spent 10 years as a senior agent at a national carrier, managing over 1,800 active policies. Dana Holbrook will oversee operations, compliance, and systems management. Both principals hold active Georgia property and casualty licenses. The agency will maintain $2 million aggregate professional liability coverage and comply with all state regulatory requirements.
The agency generates revenue through commissions on personal lines (auto, home, life) and commercial lines (general liability, workers’ compensation, business owner policies). New business commissions pay 10 to 15%. Renewal commissions pay 12 to 20%. Commercial accounts typically carry higher policy values and generate stronger client retention based on industry data and founder experience.
The business projects $225,000 in gross commissions during Year 1, $360,000 in Year 2, and $520,000 in Year 3. Monthly cash flow turns positive by Month 12 based on new business commission accumulation. The agency targets $26,500-$27,000 in monthly gross commissions to cover operating costs and debt service. Renewal income strengthens cash flow stability after the first policy anniversary cycle in Year 2.
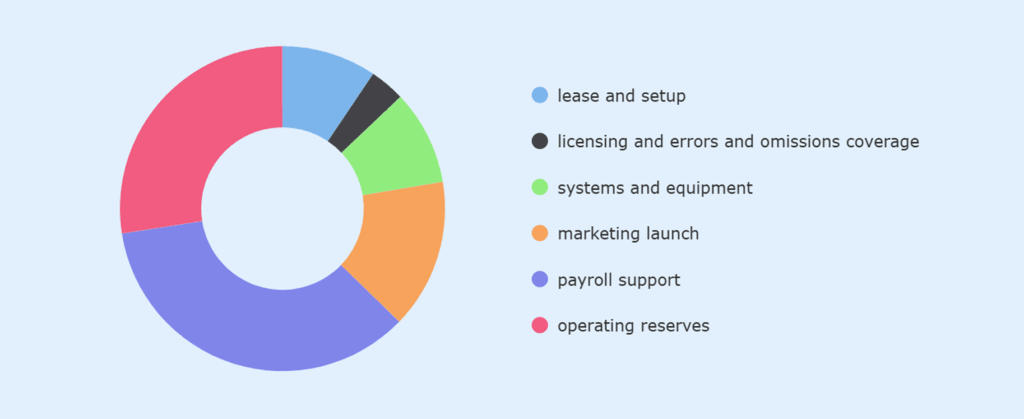
The term loan funds office lease and setup, licensing and insurance requirements, systems infrastructure, and initial marketing. The line of credit smooths timing gaps between commission receipts and fixed expenses during ramp-up. Total uses include $24,000 for lease and setup, $9,000 for licensing and errors and omissions coverage, $24,000 for systems and equipment, $30,000 for marketing launch, $98,000 for payroll support, and $70,000 in operating reserves.
The business maintains lean fixed costs through delayed owner draws, limited initial headcount, and outsourced bookkeeping. Marcus Rowan will defer compensation until Month 9. The agency will initially consist of four people: the two owners, one licensed agent, and one customer service representative. This staffing model controls payroll risk during the sales ramp period.
Collateral includes business assets, assignment of commission income where required, and personal guarantees from both owners.
A business plan shouldn’t take weeks
Company Description
ShieldPoint Insurance Advisors, LLC is a Georgia limited liability company. The business operates as an independent multiline insurance agency representing multiple insurance carriers. It’s not captive to any single insurer. The agency compares coverage options for clients across personal and commercial lines.
Location
The business will operate from 1183 Willow Ridge Parkway, Suite 302, Atlanta, GA 30324. This location sits in Lindridge-Martin Manor with access to Midtown and Buckhead. The lease covers office and meeting space adequate for initial staffing. Most client interactions occur through scheduled appointments and phone consultations, not walk-in traffic.
Ownership Structure
Marcus L. Rowan holds 70% equity. Dana Holbrook holds 30% equity. Both owners are Georgia residents. Marcus Rowan injected $65,000 in documented personal funds before the loan application. These funds cover initial formation costs, licensing fees, and preliminary carrier application expenses. Bank loan proceeds will fund operational launch and working capital requirements.
Current Operating Status
The business is pre-revenue and pre-appointment. Both principals hold active Georgia property and casualty licenses. Both hold Georgia life and health licenses. Carrier appointment applications are in process with 6 insurers across personal and commercial lines. Applications are pending at different stages, with estimated completion between July and September 2026. The agency submitted parallel applications to reduce approval risk and ensure coverage breadth at launch.
If appointment delays occur, the business will activate backup carrier applications already prepared. The operating reserve accounts for extended appointment timelines. Marketing launch is scheduled for September 2026, contingent on securing at least four active appointments across both personal and commercial products.
Regulatory Compliance
ShieldPoint operates under the Georgia Department of Insurance authority. The agency will carry errors and omissions insurance with $2 million aggregate coverage. This policy protects against professional liability claims from placement errors, coverage gaps, or advice disputes. Claims under E&O coverage disrupt cash flow and client relationships. Documented compliance procedures reduce error frequency and claims exposure.
Both principals maintain active licenses in good standing. Georgia requires 20 hours of continuing education every 2 years. Dana Holbrook tracks compliance deadlines, CE completion, and regulatory filings. She manages carrier relationship documentation and appointment renewals.
| Item | Status | Completion Date | Responsible Party |
|---|---|---|---|
| Georgia Property & Casualty Licenses | Active | Completed | Marcus Rowan, Dana Holbrook |
| Georgia Life & Health License | Active | Completed | Marcus Rowan, Dana Holbrook |
| Errors & Omissions (E&O) Insurance | $2 million aggregate coverage | Completed | Dana Holbrook |
| Carrier Appointments | Pending (applications submitted to 6 carriers) | July–September 2026 | Marcus Rowan |
| Continuing Education (CE) | 20 hours every 2 years | Ongoing (tracked quarterly) | Dana Holbrook |
| Carrier Relationship Management | In Progress (multiple insurers engaged) | Ongoing | Dana Holbrook |
| Regulatory Filings | Annual reporting and licensing renewals | Ongoing | Dana Holbrook |
| Compliance Procedures | Established (includes coverage reviews, exclusion checks) | Ongoing | Marcus Rowan, Dana Holbrook |
| Appointment Minimums | Monitoring and tracking based on carrier agreements | Ongoing | Dana Holbrook |
Principal Roles
Marcus Rowan serves as principal agent and manages sales, policy placement, and client relationships. He spent 10 years managing over 1,800 policies at a national carrier. Dana Holbrook manages operations, compliance, carrier coordination, and internal systems. Her prior experience includes operational oversight in financial services with exposure to regulatory documentation and process controls.
Market Analysis
Target Market Geography
ShieldPoint Insurance Advisors serves 3 adjacent Atlanta neighborhoods. Lindridge-Martin Manor surrounds the office location. Midtown lies two miles south. Buckhead sits three miles north. These areas contain concentrations of homeowners, renters, and small businesses within the agency’s service radius.
Lindridge-Martin Manor shows a median household income of nearly $107,000 according to census data. The neighborhood contains a mix of single-family homes and rental properties. Homeownership rates exceed 59.4%. Midtown and Buckhead skew higher in income and professional employment. Commercial activity includes retail, restaurants, professional offices, and contractor businesses.
Personal Insurance Market
The primary personal insurance customer is aged 30 to 55 with a household income between $70,000 and $150,000. This segment owns homes and drives one or two vehicles. They seek insurance during life transitions: Home purchase, marriage, children, and vehicle replacement.
These customers compare coverage options before buying. Industry data and founder experience show customers will switch carriers for better pricing or improved service, particularly when no strong agent relationship exists. Bundling auto and home insurance drives initial acquisition. Cross-selling umbrella and life coverage occurs after the first policy year once trust is established.
Renters represent a secondary segment. They purchase lower-value policies but convert to homeowners insurance as income rises. The agency will write renter policies selectively, prioritizing customers likely to transition to homeownership within 3 years.
| Customer Segment | Description | Demographics | Insurance Products | Key Characteristics |
|---|---|---|---|---|
| Homeowners (Auto + Home) | Homeowners seeking bundled auto and home coverage. | Age: 30–55, Income: $70,000–$150,000, Home Value: $250,000–$550,000 | Auto Insurance, Homeowners Insurance, Umbrella Coverage | Comparison shoppers, brand-conscious, value bundled policies |
| Renters | Individuals renting homes or apartments, likely to convert to homeowners over time. | Age: 22–35, Income: $35,000–$75,000, Renter’s Market | Renters Insurance, Homeowners Insurance | Cost-sensitive, potential for cross-selling to homeowners |
| Life Insurance Seekers | Customers in life transition stages seeking term life insurance. | Age: 25–50, Income: $50,000–$150,000, Married, with or expecting children | Term Life Insurance, Umbrella Insurance | Life changes (marriage, children, new home, etc.) |
Commercial Insurance Market
Commercial accounts generate higher commissions per policy and demonstrate stronger retention patterns based on industry benchmarks. Small businesses with 2 to 25 employees form the target segment. Specific industries include general contractors, retail stores, restaurants, professional service firms, and light commercial operations.
These businesses require general liability coverage, commercial property insurance, and workers’ compensation. Many add commercial auto policies and business owner packages. Commercial clients face switching friction from carrier underwriting requirements, premium financing arrangements, and certificate of insurance logistics. Marcus Rowan observed retention above 75% in his commercial book at his prior carrier once policies reached first renewal.
| Customer Segment | Description | Demographics | Insurance Products | Key Characteristics |
|---|---|---|---|---|
| Small Business Owners | Small businesses in need of general liability, property insurance, and workers’ compensation. | 2–25 Employees, Revenue: $300,000–$10M, Located in Atlanta Metro | General Liability, Workers’ Compensation, Business Owner’s Policy (BOP), Commercial Auto | High retention, long-term relationships, bundled policies |
| Contractors | Contractors needing specialized coverage like workers’ compensation and general liability. | Age: 35–60, Business Type: Construction, Retail, Service Providers | General Liability, Workers’ Compensation, Commercial Auto | High-risk, industry-specific insurance needs |
| Retail & Restaurant Owners | Small businesses in retail and food service looking for liability, property, and auto coverage. | 2–25 Employees, Revenue: $250,000–$5M, Primarily in Midtown, Buckhead | General Liability, Property Insurance, Commercial Auto | Depend on long-term, cost-effective coverage |
Competitive Landscape
The local insurance market includes the following competitor categories:
Captive Agencies
- Represent single carriers such as State Farm, Allstate, and Farmers
- Benefit from national brand recognition and walk-in traffic
- Can’t compare coverage or pricing across multiple insurers
- Less attractive to customers who prioritize choice and customization
Independent Local Agencies
- Three independent agencies operate within approximately 1.5 miles of the ShieldPoint office
- Two focus primarily on personal lines and appear to have mature books that limit service capacity for new business
- One agency serves commercial accounts but relies primarily on referrals rather than active marketing
- Limited outbound commercial acquisition creates an opening for a growth-focused independent agency
Market Conditions
- Atlanta is a competitive insurance market with multiple agencies pursuing the same customer segments
- ShieldPoint enters with carrier appointment applications in process rather than established carrier relationships
- Success depends on execution speed and operational discipline rather than unmet market demand
Online Insurance Platforms
- Platforms such as Policygenius compete for price-focused personal lines buyers
- These platforms efficiently handle straightforward coverage needs
- They are less effective for complex underwriting situations or customized coverage
- Online competition impacts personal lines pricing but rarely displaces agent-led commercial placements
Competitive Positioning
ShieldPoint competes on carrier comparison and commercial account focus. The agency plans to represent multiple carriers once the appointments are complete. This breadth allows comparison shopping within one relationship. Customers avoid contacting multiple agents to gather quotes.
The bundling approach targets customers who buy both auto and home coverage. Discounts improve with multi-policy placement. Retention strengthens when customers consolidate coverage. Cross-selling life and umbrella products typically occurs after the initial policy placement has established the relationship.
A commercial account focus differentiates ShieldPoint from competitors that are primarily personal lines. Marcus Rowan’s experience includes commercial policy management and small business underwriting exposure. The agency will develop these accounts through direct outreach and repeat service quality rather than waiting for referral flow to build organically.
Products & Revenue Model
ShieldPoint Insurance Advisors earns revenue through commissions on insurance policies sold and renewed. The agency doesn’t charge direct fees to clients. Commissions come from insurance carriers based on premium volume and policy type.
Revenue Concentration
The agency projects Year 1 revenue split at approximately 60% personal lines and 40% commercial lines by commission dollars. This mix reflects faster personal lines acquisition during ramp-up, balanced with commercial account development. Commercial share increases in Years 2 and 3 as business accounts mature and renew. Auto insurance represents the largest single product line by policy count, but not necessarily by commission dollars.
Personal Insurance Products
Auto insurance forms the foundation of personal lines revenue. Monthly premiums range from $135 to $260 per customer, depending on coverage level, vehicle type, and driver history. Auto policies renew annually. Most customers bundle auto with homeowners or renters coverage.
Homeowners’ insurance covers property damage and liability. Annual premiums range from $900 to $1,900 based on home value and coverage limits. Homeowners policies produce higher commission dollars per policy than auto coverage due to the premium size.
Renters insurance serves non-homeowners. Monthly premiums range from $16 to $34. These policies generate lower commission but provide entry relationships with younger customers.
Term life insurance provides death benefit coverage with fixed premiums. Monthly premiums range from $25 to $100 based on coverage amount and age. The agency offers life insurance as a cross-sell opportunity after establishing auto and home relationships. Life insurance is ancillary to the core property and casualty book and represents less than 10% of projected Year 1 revenue.
Umbrella policies provide additional liability coverage above auto and home policy limits. Annual premiums average $260 for $1 million in coverage. These policies cross-sell to homeowners with assets to protect.
Commercial Insurance Products
General Liability Insurance
- Covers third-party bodily injury and property damage claims
- Required by contractors, retailers, and food service businesses
- Typical annual premiums range from $700 to $2,500, depending on business type and revenue
Workers’ Compensation Insurance
- Covers employee injury and illness claims
- Premiums vary based on industry classification and payroll size
- Mandatory in Georgia for businesses with three or more employees
Commercial Auto Insurance
- Covers vehicles used for business purposes
- Common among contractors, delivery services, and sales-driven businesses
- Annual premiums typically range from $1,500 to $3,200 per vehicle
Business Owner Policies (BOP)
- Bundle property, general liability, and business interruption coverage
- Designed for small businesses seeking simplified coverage structures
- Annual premiums generally range from $950 to $4,000, based on coverage limits and risk profile
Carrier Relationships and Appointment Risk
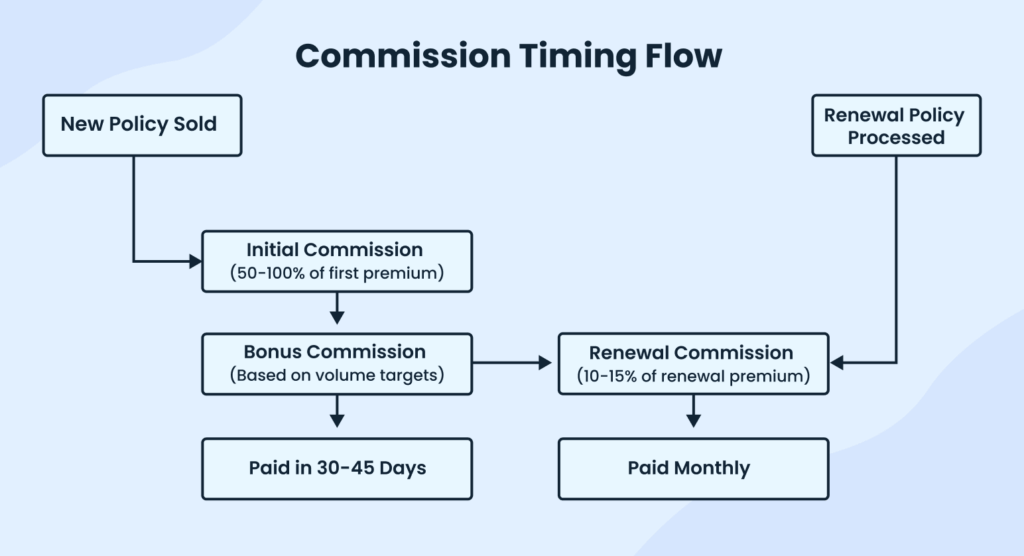
The agency submitted appointment applications to multiple carriers. Appointments authorize the agency to bind coverage and earn commissions. Applications typically process within 60 to 90 days. The agency filed parallel applications to reduce approval timing risk.
Some carriers impose minimum production requirements after the first year. These requirements typically range from $50,000 to $150,000 in annual premiums. Failure to meet minimums can result in appointment termination. The agency’s volume projections exceed typical carrier minimums by Year 2. Diversifying across multiple carriers reduces exposure to single-carrier production requirements or underwriting changes.
Carriers pay commissions on a monthly or quarterly schedule, depending on premium collection. Payment timing varies by carrier and policy type. New business commissions generally arrive 30 to 60 days after the policy’s effective date, based on industry norms. Renewal commissions pay at policy anniversary. The agency tracks commission receivables through its agency management system.
Revenue Risk Factors
Policies canceled within the first year trigger commission chargebacks. The carrier reclaims paid commission if the customer cancels before the anniversary. Chargeback rates vary by product and customer segment. Personal auto shows higher early cancellation than commercial policies. The agency will monitor retention monthly and address service issues that drive early cancellations.
Quoting unbindable risks consumes agent time without producing revenue. Some customers request quotes with no intent to purchase or have disqualifying risk factors. The agency will qualify prospects before investing significant quoting time.
Product Mix Strategy
The agency prioritizes bundled personal lines accounts and commercial policies. Bundled customers purchase multiple insurance products, such as auto and homeowners, or multiple commercial coverages, through the agency rather than a single standalone policy. Commercial accounts produce higher commissions per customer. The initial sales focus balances volume acquisition through personal lines with higher-value commercial placement.
Marketing & Sales Strategy
ShieldPoint Insurance Advisors allocates approximately $4,500 per month to customer acquisition during Year 1. This budget must generate sufficient lead volume to support 70 to 80 policy placements monthly by Month 12. Marketing efficiency directly affects break-even timing and operating reserve burn rate.
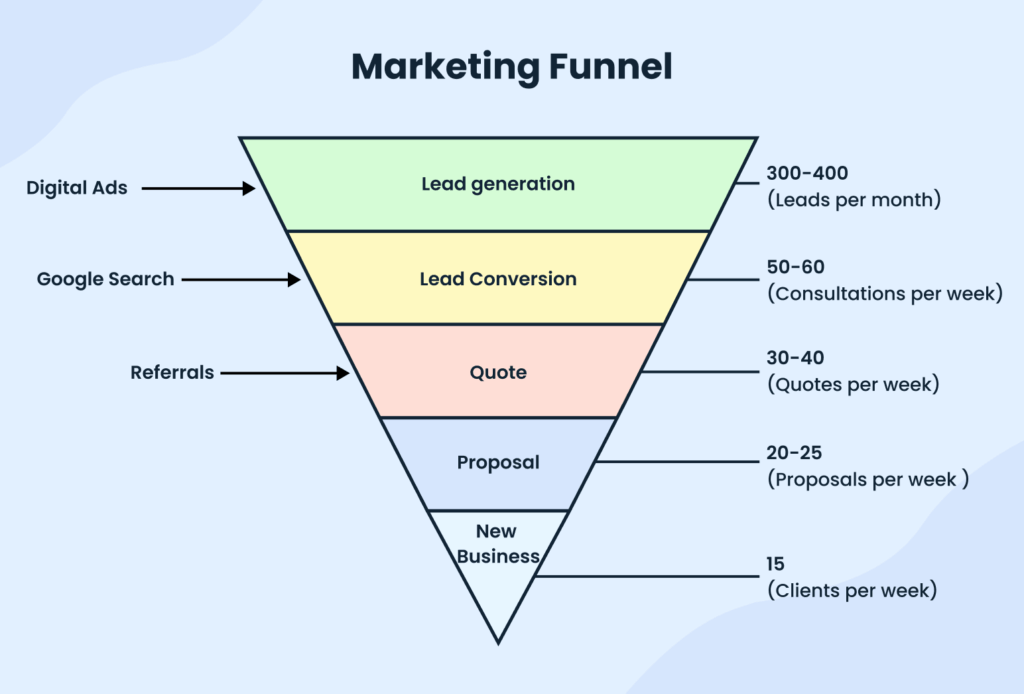
Production Targets and Marketing Math
The agency needs 70 to 80 new policies per month to reach ~$26,500 in monthly commissions by Month 12. At industry-typical conversion rates of 20 to 25%, this requires approximately 300 to 350 qualified leads per month. Customer acquisition cost planning assumes $150 to $250 per closed policy based on Atlanta insurance market norms and digital channel benchmarks.
At a $200 average CAC and 75 policies per month, total acquisition costs run $15,000 monthly. The $4,500 marketing budget covers lead generation only. Agent time, quoting systems, and operational overhead add cost not captured in the marketing line item. Full customer acquisition economics exceed the direct marketing spend.
If actual CAC reaches $300 per policy instead of $200, monthly acquisition costs rise to $22,500 for the same volume. This variance draws additional operating reserve or triggers line of credit usage. The agency will track CAC weekly and adjust spending or improve conversion rates when costs exceed planning assumptions by 20% or more.
Digital Marketing Channels
Google Local Services and Google Maps listings provide a foundational digital presence. Local search captures customers actively seeking insurance quotes. The agency will maintain verified Google Business profiles with service area targeting. New profiles typically take 60 to 90 days to rank prominently, though timing varies based on competition and review accumulation.
Paid search advertising targets specific insurance product searches. The monthly paid search budget runs approximately $2,000. Actual costs fluctuate with seasonal competition and bid management.
Lead quality from digital channels varies significantly. Some leads represent serious buyers. Others abandon after initial contact or are shopping with no intent to switch carriers. The agency will track lead source performance and reduce spending on channels producing conversion rates below 15%.
Referral Development
Real estate agents and mortgage brokers refer homebuyers needing insurance. The agency will develop these relationships during Year 1 through consistent outreach. No active referral agreements currently exist. Referral flow builds slowly and cannot be relied upon for Month 6 production targets.
Commercial insurance acquisition will occur through direct business owner contact. This approach requires significant agent time. Commercial sales cycles run 30 to 90 days from initial contact to policy placement. The agency will prioritize industries with immediate coverage needs, such as contractors bidding on projects requiring certificates of insurance.
Sales Process and Capacity Constraints
Initial customer contact occurs through phone, email, or form submission. The agency gathers information and schedules a quote consultation. Standard personal lines quotes are delivered within 24 hours when carrier systems cooperate, and risk factors are straightforward. Complex risks require additional underwriting time.
Marcus Rowan and one licensed agent handle sales and quoting. Each agent can realistically manage 15-20 quotes/day. At 25% conversion, this produces 4 to 5 closed policies daily per agent. Two agents working full sales schedules can produce 40 to 50 policies weekly or 160 to 200 policies monthly at full capacity.
This capacity exceeds the 70 to 80 monthly policy target. However, agents also handle service calls, policy changes, renewal management, and claims assistance. These activities reduce available quoting time. As the book grows beyond 500 policies, service load constrains new business production capacity. This timing typically occurs in Months 9 to 12 and may require earlier hiring of additional staff or customer service support.
Customer Retention Activities
Email and phone follow-ups maintain customer contact. The agency sends renewal reminders 45 days before expiration. Response time targets 4 business hours for service requests. These service standards affect retention but consume staff time.
Cross-selling occurs after initial policy placement. The agency waits 90 days before introducing additional products. This timing allows relationship development.
Marketing Budget Allocation
The monthly budget is allocated as follows. Paid search receives $2,000. Google Business optimization and local SEO receive $800. CRM and email tools receive $400. Website hosting receives $300. Networking and business development receive $500. Testing and contingency receive $500.
This allocation prioritizes direct lead generation. The agency will reduce spending in any channel producing CAC above $350 within the first 90 days. Budget flexibility allows reallocation based on actual performance rather than planned assumptions.

Cost Control and Spending Triggers
Marketing spend continues at $4,500 monthly unless lead conversion falls below 15% or CAC exceeds $350 per policy for two consecutive months. At these thresholds, the agency will either improve conversion processes or reduce spending to $3,000 monthly until performance stabilizes.
Reduced marketing spend extends break-even timing but preserves operating reserves. The line of credit can cover temporary marketing spend increases if specific campaigns show strong ROI. Marketing efficiency problems that persist beyond Month 6 trigger staffing adjustments or strategy changes before reserves deplete.
Execution Risk
Marketing channel performance varies. Digital presence builds over 90 to 120 days, not immediately at launch. Early months may produce 30 to 40 policies monthly while lead generation ramps up. This slower start draws additional operating reserve and delays break-even timing. The nine-month reserve accounts for this ramp variability.
Operations, Staffing & Compliance
ShieldPoint Insurance Advisors operates from 1183 Willow Ridge Parkway, Suite 302, Atlanta, GA 30324. The office provides workspace for initial staff, meeting space for client consultations, and secure document storage. The location does not depend on walk-in traffic. Most business occurs through scheduled appointments and phone consultations.
Systems Infrastructure
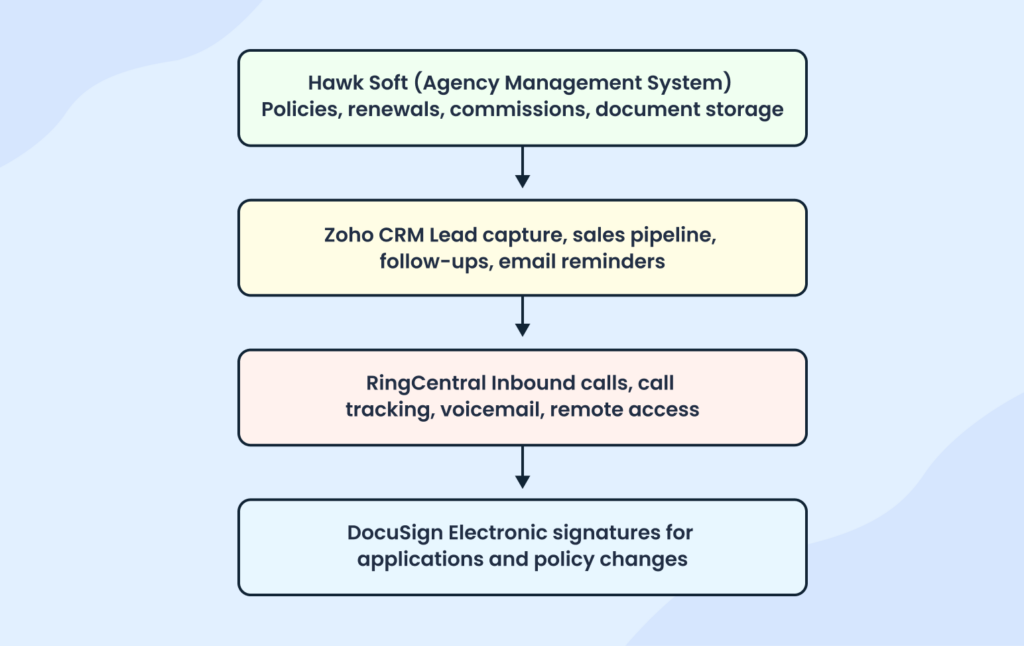
The agency uses HawkSoft as its agency management system. HawkSoft tracks policies, manages renewals, stores customer documents, and generates commission reports. The monthly subscription cost runs approximately $400. The system integrates with multiple carrier portals to streamline policy downloads and updates.
Customer relationship management runs through Zoho CRM. This system tracks leads, manages follow-up schedules, and monitors the sales pipeline. The monthly cost runs $75 for required user licenses. Email marketing and automated renewal reminders operate through Zoho’s marketing tools.
Phone service runs through RingCentral. Cloud-based phone systems allow remote work capability and call tracking. The monthly cost runs $150 for required lines. The system records calls for training and quality review purposes.
Electronic signature capability runs through DocuSign. Insurance applications and policy change forms require customer signatures. Digital signatures reduce turnaround time and eliminate paper document shipping. The monthly cost runs $50.
Total monthly systems cost runs approximately $675. These systems are standard in independent insurance agencies and required for efficient operations. The business can’t operate at the projected volume without adequate technology infrastructure.
Initial Staffing Structure
The agency launches with four people. Marcus Rowan serves as principal agent and manages sales, client relationships, and business development. Dana Holbrook manages operations, compliance, carrier relationships, and internal systems administration. One licensed agent handles quoting and policy placement. One customer service representative handles phone coverage, policy changes, and administrative support.
This lean structure controls fixed payroll costs during ramp-up. Total monthly payroll runs approximately $15,000, including both owners, the licensed agent, and the CSR. This amount covers base salaries but excludes payroll taxes and benefits.
Compensation Structure
Marcus Rowan defers owner compensation until Month 9. This delay preserves cash during the sales ramp period. Beginning in Month 9, owner draw starts at $4,000 monthly and increases to $6,000 monthly by Year 2 as cash flow stabilizes.
Dana Holbrook receives a $60,000 annual salary paid from launch. Her salary funds critical operational and compliance functions that cannot be delayed. Monthly gross pay runs $5,000.
The licensed agent receives a base salary of $40,000 annually plus commission overrides on personally produced policies. Base monthly pay runs $3,333. Commission overrides add approximately $1,500 to $2,500 monthly once production ramps up. Total compensation reaches $55,000 to $70,000 annually at full productivity.
The customer service representative receives $35,000 annually. Monthly gross pay runs $2,917. This role doesn’t earn commission but receives periodic bonuses for service quality performance.
Bookkeeping and accounting functions are outsourced. The monthly cost runs $500 for transaction processing, reconciliation, and financial reporting. The business will hire internal accounting staff only when the book exceeds 2,000 policies, likely in Year 3.
| Role | Start Timing | Base Compensation | Monthly Pay | Variable/Notes |
|---|---|---|---|---|
| Marcus Rowan (Owner) | Month 9 | $48,000 annually by Year 2 | $4,000 starting Month 9 | Owner draw deferred until Month 9; increases to $6,000/month in Year 2 as cash flow stabilizes |
| Dana Holbrook (Operations) | Launch | $60,000 annually | $5,000 | Fixed salary supporting operations and compliance |
| Licensed Agent | Month 3 | $40,000 base annually | $3,333 | Commission overrides add ~$1,500–$2,500/month at scale; total comp $55,000–$70,000 |
| Customer Service Representative | Month 5 | $35,000 annually | $2,917 | No commission; eligible for periodic service quality bonuses |
| Bookkeeping & Accounting (Outsourced) | Launch | – | $500 | Covers transaction processing, reconciliation, and reporting; internal hire planned post-2,000 policies (Year 3) |
Hiring Timeline and Capacity Planning
The four-person team handles operations through approximately Month 12. As the policy book grows beyond 500 active policies, service load increases. Renewal processing, policy changes, claims assistance, and customer questions consume staff time previously available for new business production.
The agency will hire a second customer service representative in Month 10 or 11 when service call volume consistently exceeds 20 inbound contacts daily. This hire costs approximately $3,000 monthly, including payroll taxes. The addition preserves agent capacity for new business production as service demands grow.
A second licensed agent hire likely occurs in Months 15 to 18 when new business production approaches team capacity limits. This timing depends on actual sales velocity and commercial account mix. Commercial policies require more underwriting time per placement than personal lines.
Compliance and Procedures
Dana Holbrook owns compliance risk for the agency. She tracks licensing renewals, continuing education requirements, carrier appointment terms, and regulatory filing deadlines. Compliance failures trigger fines, appointment terminations, or license suspensions. These outcomes disrupt revenue and damage carrier relationships.
Both principals maintain active Georgia property and casualty licenses. Both hold Georgia life and health licenses. Georgia requires 20 hours of continuing education every two years for license renewal. The agency tracks CE completion quarterly to avoid last-minute compliance gaps.
Errors and omissions insurance provides $2 million aggregate coverage. Annual premium runs approximately $4,500 for startup agency coverage. E&O insurance protects against claims from coverage gaps, placement errors, or inadequate advice. Claims under E&O coverage damage carrier relationships even when the insured. Prevention matters more than coverage.
The agency maintains documented procedures for policy review before binding. These procedures include coverage limit verification, exclusion review, and premium confirmation. The staff follow standardized checklists to reduce placement errors that trigger E&O claims or customer disputes.
Carrier Appointment Management
Carrier appointments authorize the agency to bind coverage and earn commissions. Applications submitted to six carriers currently sit at various approval stages. Expected completion runs from July through September 2026.
Some carriers impose minimum production requirements after the first year. These requirements typically range from $50,000 to $150,000 in annual placed premium. The agency’s Year 2 projections exceed these minimums. Failure to meet production requirements can result in appointment termination.
Dana Holbrook manages carrier relationships and tracks production against minimum thresholds. She monitors appointment renewal dates and submits required reporting. Strong carrier relationships provide access to competitive markets and underwriting flexibility.
Operational Risk Factors
System failures disrupt quoting and policy processing. The agency maintains backup internet service and cloud-based systems to reduce downtime risk. Extended outages still occur and delay sales activity.
Staff turnover affects service quality and sales capacity. The licensed agent role is critical and difficult to replace quickly. New agents require 60 to 90 days to reach full productivity. The agency will address compensation and working conditions proactively to reduce turnover risk.
Carrier portal access issues occasionally prevent policy binding or commission reporting. These technical problems lie outside agency control but affect operations. The agency maintains relationships with carrier support contacts to resolve issues quickly.
Revenue Mechanics & Cash Flow Timing
Insurance agency revenue doesn’t arrive immediately when policies are sold. Commission payment lags policy effective dates. This timing gap affects early cash flow and determines when the business reaches break-even.
New Business Commission Timing
When a policy sells, the carrier collects premiums from the customer. The carrier processes the policy and remits commission to the agency. This process typically takes 30 to 60 days based on industry norms, though timing varies by carrier. Some carriers pay monthly. Others pay quarterly. Payment schedules are not uniform across all appointments.
A policy sold in Month 1 may generate a commission payment in Month 2 or Month 3. Early months show sales activity without corresponding cash receipts. Commission receivables build before converting to cash. This lag creates startup cash pressure that the operating reserve must cover.
Monthly Break-Even Target
The agency targets $26,500 to $27,000 in monthly gross commissions to cover operating expenses and debt service. This amount funds payroll (~$13,750), rent and occupancy (~$3,000), marketing ($5000), and debt service (~$3,000). At this monthly commissions, the business operates near break-even with minimal margin.
If monthly commissions fall below $26,500 during the ramp period, the shortfall is absorbed through operating reserves or temporary line-of-credit usage. Commissions above $27,000 support reserve rebuilding and accelerated debt repayment.
Production Requirements and Staffing Capacity
New business commissions averaging 12% require approximately $200,000 in monthly premium placement to generate $26,500 in commission. This translates to roughly 80 to 100 personal lines policies/month or 15-20 commercial policies, depending on the mix.
The initial team includes Marcus Rowan and one licensed agent. Each agent can realistically produce 35 to 50 new policies/month during full ramp. This capacity supports the 80 to 100 policy monthly target by Month 6 or 7. Production below this level extends break-even timing or requires earlier hiring of additional licensed staff.
Marcus Rowan managed over 1,800 policies at his prior carrier. Managing an existing book differs from producing new business at a startup agency. New business production lacks brand recognition and established referral flow. Volume assumptions reflect conservative ramp expectations, not prior book size.
| Item | Assumption/Range | Notes |
|---|---|---|
| Average New Business Commission Rate | 12% | Used for production and break-even calculations |
| Monthly Premium Required | ~$200,000 | Required to generate ~$26,500 in gross commission |
| Monthly Commission Target | ~$26,500 | Pre-break-even target under stated assumptions |
| Personal Lines Volume | 80–100 policies/month | Assumes lower premium per policy |
| Commercial Lines Volume | 15–20 policies/month | Assumes a higher premium per policy |
| Initial Production Team | 2 producers | Marcus Rowan + 1 licensed agent |
| Per-Producer Capacity (Full Ramp) | 35–50 new policies/month | Reflects startup conditions, not a mature agency |
| Combined Team Capacity | 70–100 new policies/month | Supports stated monthly target |
| Prior Book Experience (Marcus Rowan) | 1,800+ policies managed | Managing renewals differs from new business production |
| Ramp Assumption | Conservative | No brand recognition or referral flywheel assumed |
Path to Month 12 Break-Even
The business projects a positive monthly cash flow by Month 12. This timeline depends on the new business commission accumulation. Renewals do not materially contribute until Month 13 when Year 1 policies reach anniversary dates.
Month 12 break-even requires several conditions. New business production must reach approximately 70 policies/month by Month 6 and stabilize near that level. Commission payments from earlier months must accumulate to offset the 30 to 60-day payment lag. Marketing efficiency must generate leads at projected acquisition costs. Close rates must average 20 to 25% on quoted policies.
These conditions introduce execution risk.
- Slower sales extend break-even timing.
- Carrier appointment delays postpone revenue generation entirely.
- Higher customer acquisition costs reduce margin per policy.
- The 9-month operating reserve funds gap occurs when actual performance lags behind projections.
If carrier appointments complete by August 2026 as projected, Month 10 represents June 2027. Suppose appointments delay to October 2026, Month 10 shifts to August 2027. The operating reserve extends to cover this variability.
Line of Credit Usage
The $75,000 working capital line covers timing gaps between commission receipts and fixed expenses. The LOC draws when monthly expenses exceed commission receipts during ramp-up. Draws likely peak between Months 4 and 8 when sales activity builds, but commission payment lags remain.
As monthly commissions reach $26,500, LOC draws stabilize. When commissions consistently exceed $26,000, the business begins repaying drawn amounts. The LOC remains available for seasonal variations or temporary revenue dips. Full LOC repayment likely occurs in Year 2 as renewal income accumulates.
Renewal Income and Cash Flow Stability
Renewal commissions strengthen cash flow after Month 13 when Year 1 policies renew. Renewal commissions pay 12 to 20%, depending on product and carrier. They require no new acquisition cost beyond service and retention activities.
Renewal retention varies by product and customer segment. According to our research, first-year retention rates for personal lines insurance policies commonly range in the 70%–80% range. Commercial accounts typically retain at similar or higher rates. Marcus Rowan observed retention above 75% in his commercial book at his prior carrier.
If retention averages 70% instead of 80%, Year 2 renewal income falls approximately 12% below projections. This reduces the margin above break-even but doesn’t eliminate debt service coverage, given the conservative base assumptions. Retention below 65% signals service problems that require immediate operational correction.
Early policy cancellations trigger commission chargebacks. Carriers reclaim paid commission when customers cancel within the first policy year. Chargeback rates vary, but they can affect 10 to 15% of new business in poorly managed books. The agency will monitor early cancellation triggers and address service issues that drive customer loss.
Why This Supports Debt Service
Debt service begins immediately upon loan funding, while commission revenue ramps gradually during the initial operating period. Commission revenue builds over time. The operating reserve and line of credit bridge the gap. By Month 12, commission revenue covers monthly operating costs plus debt service under base assumptions. Renewal income in Year 2 provides additional margin and improves the debt service coverage ratio. The loan structure assumes this timing pattern and builds in reserve capacity for execution variance.
Financial Plan
This financial plan is structured conservatively and reflects how a commercial lender would underwrite a startup independent insurance agency. The projections intentionally account for commission payment lag, gradual production ramp, and the absence of renewal income during the first operating year. All assumptions prioritize liquidity protection and debt service reliability over early profitability.
Capital Structure and Funding Request
ShieldPoint Insurance Advisors is capitalized with a combination of owner equity and bank financing. The business requests a total bank credit of $255,000, comprising a $180,000 term loan and a $75,000 working capital line of credit. In addition, Marcus Rowan has contributed $65,000 in documented personal capital, deployed prior to loan funding. Total capital available at launch is $320,000.
This structure is designed to fund startup costs, absorb commission timing delays, and provide sufficient liquidity during the initial ramp period typical for insurance agencies.
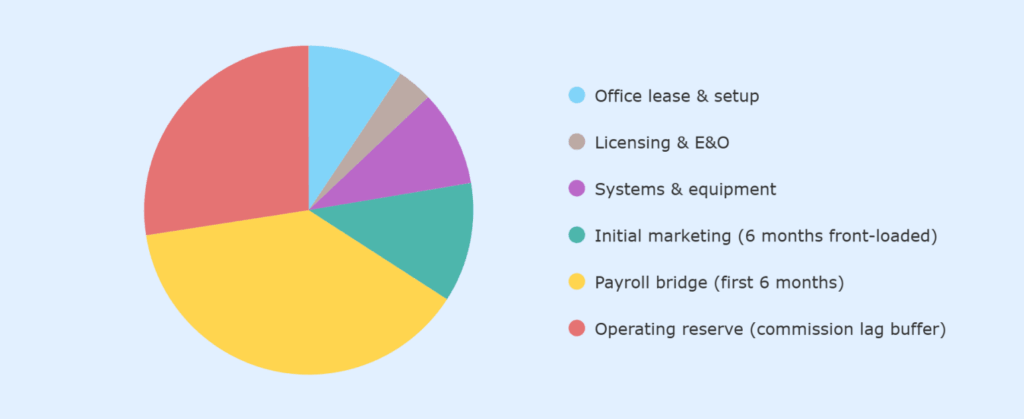
Startup Costs and Use of Funds
Total startup costs are estimated at $255,000. These costs are necessary to establish operations and support the business until commission revenue stabilizes.
| Category | Amount ($) |
|---|---|
| Office lease & setup | $24,000 |
| Licensing & E&O | $9,000 |
| Systems & equipment | $24,000 |
| Initial marketing (6 months front-loaded) | $30,000 |
| Payroll bridge (first 6 months) | $98,000 |
| Operating reserve (commission lag buffer) | 70,000 |
| Total Startup Need | $255,000 |
Sources of Funds
| Source | Amount ($) |
|---|---|
| Owner cash (deployed first) | 65,000 |
| Bank term loan | 180,000 |
| Working capital LOC (timing buffer) | $75,000 |
| Total Available Capital | 320,000 |
Here’s one thing to note: Of the $320,000 available at launch, $255,000 is allocated to startup and initial operating costs, with the remaining $65,000 held as a cash reserve to manage commission timing and appointment delays.
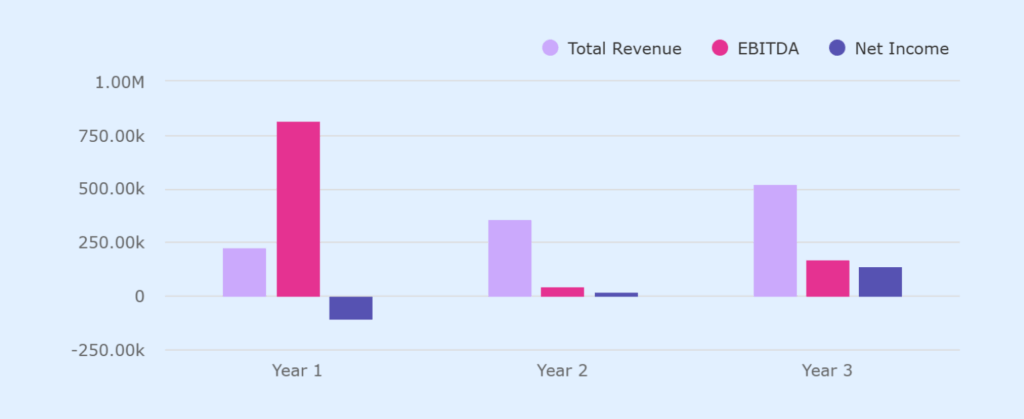
Projected Profit & Loss Statement
| Profit & Loss | Year 1 ($) | Year 2 ($) | Year 3 ($) | Total ($) |
|---|---|---|---|---|
| Revenue | ||||
| Personal lines commissions | 135,000 | 200,000 | 275,000 | 610,000 |
| Commercial lines commissions | 90,000 | 160,000 | 245,000 | 495,000 |
| Total Revenue | 225,000 | 360,000 | 520,000 | 1,105,000 |
| Cost of sales | 0 | 0 | 0 | 0 |
| Gross Profit | 225,000 | 360,000 | 520,000 | 1,105,000 |
| Operating Expenses | ||||
| Salaries & wages | 140,000 | 150,000 | 170,000 | 460,000 |
| Payroll taxes & benefits | 25,000 | 30,000 | 35,000 | 90,000 |
| Marketing & advertising | 60,000 | 48,000 | 50,000 | 158,000 |
| Rent & utilities | 36,000 | 36,000 | 38,000 | 110,000 |
| Software & systems | 20,000 | 22,000 | 24,000 | 66,000 |
| Insurance & licenses | 9,500 | 10,000 | 10,500 | 30,000 |
| Professional services | 9,000 | 10,000 | 11,000 | 30,000 |
| Office & administrative | 7,000 | 8,000 | 9,000 | 24,000 |
| Total Operating Expenses | 306,500 | 314,000 | 347,500 | 968,000 |
| EBITDA | -81,500 | 46,000 | 172,500 | 137,000 |
| Depreciation | 6,000 | 6,000 | 6,000 | 18,000 |
| Interest expense | 19,000 | 17,000 | 14,000 | 50,000 |
| Taxes | 0 | 0 | 14,000 | 14,000 |
| Net Income | -106,500 | 23,000 | 138,500 | 55,000 |
Projected Cash Flow Statement – Years 1 to 3
| Category | Year 1 ($) | Year 2 ($) | Year 3 ($) |
|---|---|---|---|
| Cash Flow from Operations | |||
| Net income (loss) | -106,500 | 23,000 | 138,500 |
| Depreciation | 6,000 | 6,000 | 6,000 |
| Change in accounts receivable | -35,000 | -10,000 | -10,000 |
| Change in accounts payable | 24,000 | 2,000 | 2,000 |
| Net Cash from Operations | -111,500 | 21,000 | 136,500 |
| Cash Flow from Investing | |||
| Equipment purchases | -24,000 | 0 | 0 |
| Net Cash from Investing | -24,000 | 0 | 0 |
| Cash Flow from Financing | |||
| Owner capital contribution | 65,000 | 0 | 0 |
| Term loan proceeds | 180,000 | 0 | 0 |
| Line of credit draw / (repayment) | 40,000 | -20,000 | -20,000 |
| Term loan principal payments | -18,000 | -22,000 | -26,000 |
| Net Cash from Financing | 267,000 | -42,000 | -46,000 |
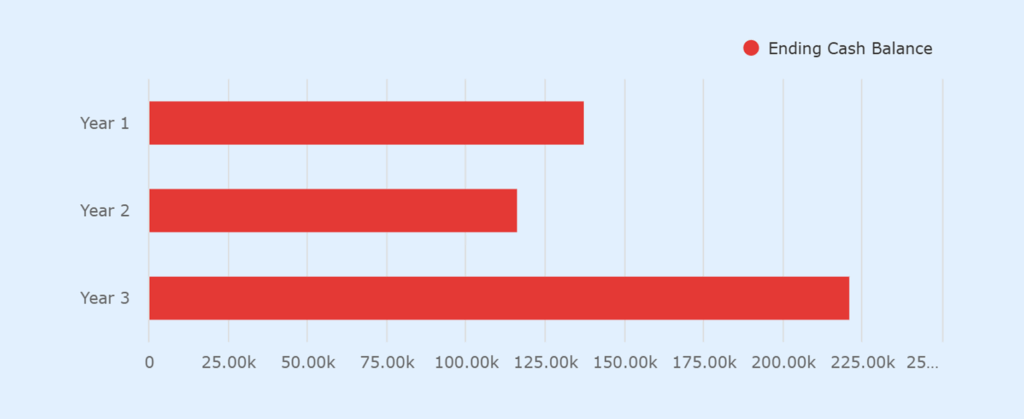
| Net Change in Cash | 131,500 | -21,000 | 90,500 |
| Beginning cash balance | 0 | 131,500 | 110,500 |
| Ending Cash Balance | 131,500 | 110,500 | 201,000 |
Projected Balance Sheet – Years 1 to 3
| Category | Year 1 ($) | Year 2 ($) | Year 3 ($) |
|---|---|---|---|
| ASSETS | |||
| Cash | 131,500 | 110,500 | 201,000 |
| Accounts receivable | 35,000 | 45,000 | 55,000 |
| Equipment (net of depreciation) | 18,000 | 12,000 | 6,000 |
| Total Assets | 184,500 | 167,500 | 262,000 |
| LIABILITIES | |||
| Term loan balance | 162,000 | 140,000 | 114,000 |
| Line of credit balance | 40,000 | 20,000 | 0 |
| Accounts payable | 24,000 | 26,000 | 28,000 |
| Total Liabilities | 226,000 | 186,000 | 142,000 |
| OWNER’S EQUITY | |||
| Owner capital & retained earnings | -41,500 | -18,500 | 120,000 |
| Total Equity | -41,500 | -18,500 | 120,000 |
| Total Liabilities + Equity | 184,500 | 167,500 | 262,000 |
(*Negative owner’s equity in Year 1 reflects initial operating losses typical of a startup insurance agency during the commission ramp period. Equity improves in subsequent years as commission revenue stabilizes, renewal income begins, and debt amortization reduces overall leverage.)
Spreadsheets are exhausting & time-consuming
Build accurate financial projections w/ AI-assisted features

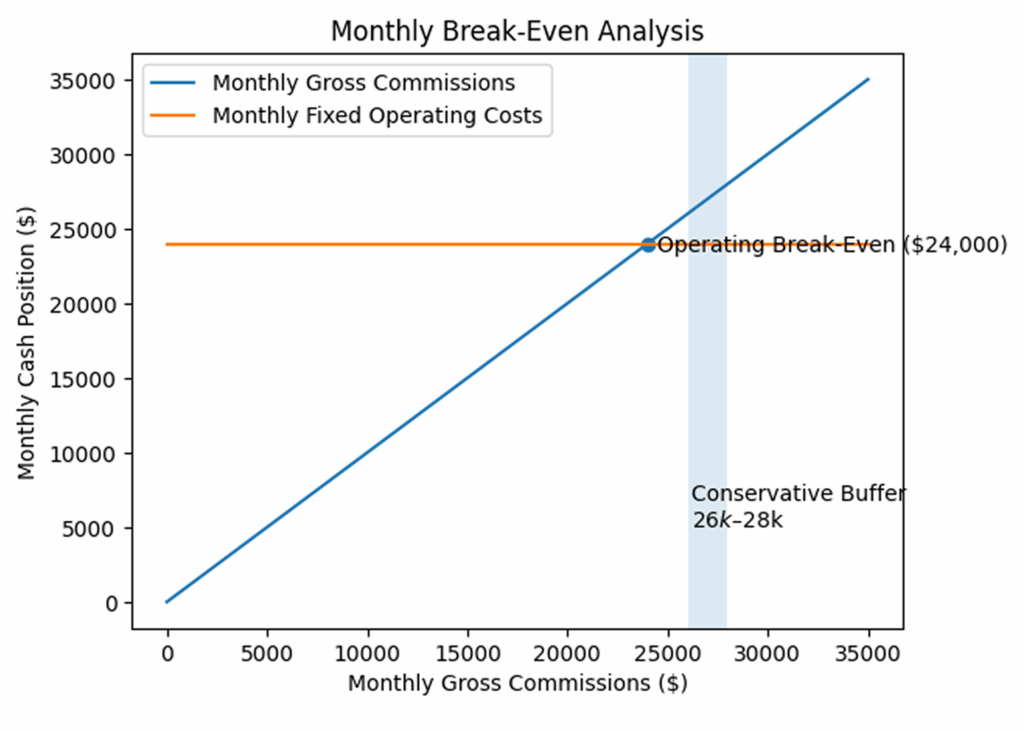
Break-Even Analysis
Monthly operating break-even occurs at approximately $26,500 in gross commissions. A conservative break-even range of $26,000 to $28,000 reflects a buffer for variability in marketing efficiency, commission timing, and short-term expense fluctuations.
Under conservative assumptions, monthly break-even is achieved between Months 12 and 14. The business does not reach annual break-even in Year 1, which is expected, given startup costs and commission timing lag. Losses during Year 1 are fully funded through owner equity, term loan proceeds, operating reserves, and temporary line of credit usage.
Debt Service Capacity
Debt service in Year 1 is supported by reserves and credit availability rather than operating cash flow. By Year 2, debt service coverage exceeds 1.2x under conservative assumptions, improving further in Year 3 as renewal income reduces reliance on new business production. This gradual improvement aligns with lender expectations for insurance agency startups.
Collateral and Security
The loan is secured by business assets, including office equipment and technology systems, along with personal guarantees from both owners. Hard asset collateral value is limited, and primary repayment support comes from recurring commission income and owner guarantees. Assignment of commission income may be provided where carrier agreements permit. The business maintains $2 million in aggregate errors and omissions coverage, reducing operational and liability risk.
Financial Controls and Risk Management
Financial oversight is managed internally with monthly reporting, cash monitoring, and variance analysis. Spending adjustments, marketing reductions, and owner compensation deferrals are triggered if liquidity metrics deteriorate. Operating funds and reserve funds are maintained in separate accounts to ensure disciplined reserve usage.
The Quickest Way to turn a Business Idea into a Business Plan
Fill-in-the-blanks and automatic financials make it easy.
Upmetrics
Upmetrics is the #1 business planning software that helps entrepreneurs and business owners create investment-ready business plans using AI. We regularly share business planning insights on our blog. Check out the Upmetrics blog for such interesting reads. Read more