I’ve always wondered why most entrepreneurs hate (or at least struggle with) financial projections. I spoke to over 35+ of them, asking the same question: why?
Different answers, but a few overlapping categories:
- A lot of numbers, formulas, and spreadsheets
- Not having the historical data (- startup founders)
- Uncertainty and guesswork involved
It’s strangely funny how simple the solution is to an almost universal problem. All you need is: a structured process, a reliable tool, and some educated assumptions.
That’s all there is to it.
In this guide, I’ll walk you through the entire process of creating a financial plan for your startup. From estimating startup costs and forecasting revenue to preparing statements, we’ll discuss everything.
By the end, you’ll have a clear framework to plan confidently, even without years of history behind you.
What is startup financial planning?
Startup financial planning, in simple terms, is a process of planning the financial aspects of a new business. It’s an integral part of a business plan and comprises its three major components: balance sheet, income statement, and cash-flow statement.
Unlike planning for an established business, creating financial projections for a startup plan often involves working without historical data—just assumptions, research, and a vision of where the business can go.
For me, startup financial planning is less about “predicting” the future and more about building a roadmap that shows how your business can become viable and scalable. It answers questions like:
- How much capital do I need to get started?
- How long before the business can generate sustainable revenue?
- At what point do I break even?
- What kind of growth trajectory should I expect?
Unlike traditional business financial planning, where the focus is on optimizing existing operations, a startup’s financial plan is about proving potential. Investors and lenders know you don’t have years of history.
What they want to see is whether you understand your market, your costs, and how you’ll turn a concept into a financially sound business.
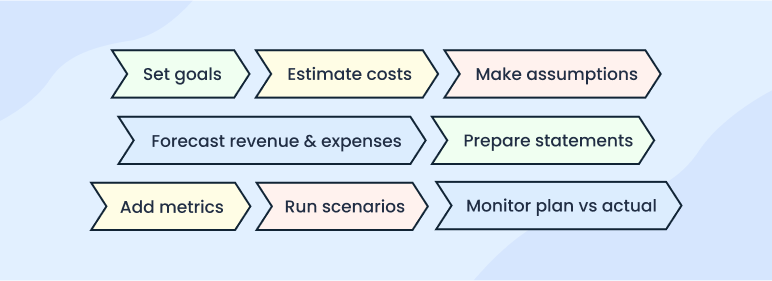
Okay, so how to actually create a startup financial plan? Here’s the exact process our consulting team follows at Upmetrics.
How to create a financial plan for your startup business (practical steps + examples)
I did my best to narrow down to these 8 steps to make financial projections. Don’t worry, it’s not a surface-level guide; these 8 steps are just enough to help you learn the basics and make an investor-ready financial plan for your startup.
Note: I’m using Upmetrics’ financial forecasting tool to make financial projections for this article. You may use Upmetrics, Excel, Google Sheets, or a forecasting tool of your choice; fundamental steps remain the same.
Financial spreadsheets vs. forecasting software
We’ve always used spreadsheets for financials and budgets. And since it’s free, it’s been a primary choice for many entrepreneurs. While it’s tempting to choose the cheaper option, it’s not always the best.
Using financial spreadsheets often comes with hidden costs: hours spent building formulas, manually entering numbers, double-checking for errors, and building visual charts and graphs.
Forecasting software, on the other hand, makes the process much easier and far more reliable. Instead of starting with a blank spreadsheet, I can simply input my assumptions, connect revenue streams, and let the software do the heavy lifting.
So yes, good software might cost $10–20 a month. But when you’re creating a financial plan that could help you raise or earn thousands (sometimes millions) of dollars, that small investment is more than worth it.
Say goodbye to old-school excel sheets & templates
Make accurate financial plan faster with AI

Enough talking. Let’s get to the point, step 1:
1) Determine your financial goals
The first step is to answer the “why” and get clear on why you are doing this—creating a financial plan.
Are you trying to raise seed funding? Secure an SBA/bank loan? Applying for a government grant? Or just want to understand how long your current savings will keep the business alive? Your financial goals define the depth of detail and the way you frame your numbers.
Investor vs. lender-focused financial plan
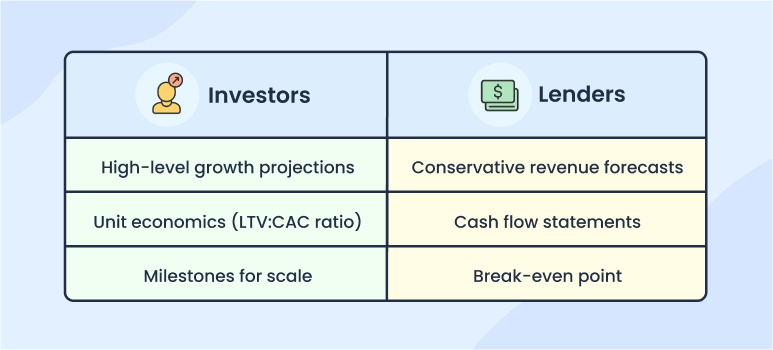
While investors care about scalability and growth potential, lenders focus on cash flow and your ability to repay the loan.
- If I’m pitching to an investor, I’ll highlight how our business will attract new customers, expand into new markets, and grow exponentially.
- If you’re approaching a lender, emphasize steady monthly sales, predictable cash flow, and how we’ll easily repay the debt.
Defining these goals upfront prevents me from building a one-size-fits-all plan that doesn’t resonate with anyone.
Once you clearly understand the “why”, you may proceed to the next step.
2) Estimate startup costs
Every startup has an initial runway cost—the money needed to open the doors and operate until revenue starts flowing. We usually categorize these costs into two categories: (1) one-time costs, (2) ongoing expenses.
- One-time costs: equipment, licenses, legal fees, and initial inventory.
- Ongoing costs: rent, salaries, utilities, and marketing.
One-time expenses are relatively easy to account for and estimate, but ongoing costs are always a concern about how long to plan for. I asked Kaylee, our lead consultant, about the same, and here’s what she says:
“A rule I follow is to plan for at least 6–12 months of operational costs, even if you expect revenue sooner. Having this cushion prevents you from running out of cash before the business hits stride.”
I’m listing a few startup cost examples, categorized into these two categories, for your reference:
| One-time expenses | Ongoing expenses |
|---|---|
| Business registration and legal fees | Rent, utilities, and internet |
| Licenses and permits | Salaries or contractor payments |
| Initial equipment or machinery | Marketing and advertising spend |
| Branding, website, and app development | Software subscriptions (CRM, forecasting, design tools, etc.) |
| Initial inventory purchase | Insurance premiums |
| Security deposits for office, retail, or warehouse space | Raw materials or resupply of inventory |
Advice from our consultants on estimating startup costs:
I’ve talked with our planning experts while putting together this piece, and here are a few of their tips on estimating and presenting startup costs in your projections:
- Instead of simply listing costs, organize them into categories and timelines. For instance, if you know you’ll hire two employees only after month three, reflect that in your plan. This shows investors you’re realistic and intentional with your spending.
- Another tip I received was “comparing estimates against industry benchmarks.” If you’re launching a SaaS startup, look at average developer salaries, server costs, and marketing spend in your niche. It grounds your numbers in reality and builds credibility.
Once you’ve estimated your startup costs, you’ll know the minimum capital you need to open the doors and survive the first few months.
With that foundation, it becomes easier to forecast revenue, plan funding, and set milestones that actually make sense.
3) Make rough financial assumptions
Once you’re done estimating startup costs, it’s time to make financial assumptions. We’ll make all sorts of assumptions to answer a few financial questions:
- Where is the revenue coming from?
- How much will customers pay?
- How many can I realistically reach in the first year?
Where is the revenue coming from?
First things first, spend some time thinking about the potential revenue streams. If you’re having trouble coming up with ideas, try using Upmetrics’ AI forecasting assist for revenue stream suggestions, or even use Gen AI tools like ChatGPT and Gemini.
You should have at least 4-6 revenue categories to move ahead with the next steps. If you have 7-8 or more categories, try clustering them into groups.
For instance, if you’re planning for a coffee shop, you can’t have multiple streams depending on coffee types—Latte, Espresso, Cold Brew, and more. You may create revenue groups like Hot/Cold Beverages, Snacks, and more.
How much will customers pay?
The key while making such assumptions is to avoid blind optimism. When I talked to Kaylee, she mentioned that when they work with clients, they mutually plan three versions of the assumptions:
- Conservative (worst case)
- Expected (realistic case)
- Optimistic (best case)
Even though you’re not building full scenarios yet, creating these versions at this stage would give you perspective. It forces you to think about risk and reward, and it makes your financial plan more credible.
Don’t worry about being perfectly accurate here. The goal is to get the fundamentals right—to know where revenue will come from, in what form, and roughly how much.
With these assumptions in place, you can start shaping forecasts that are grounded in reality rather than guesswork.
Make Accurate Financial Plans Using Upmetrics
Using Upmetrics, you can now create accurate and realistic financial plan without using financial spreadsheets.
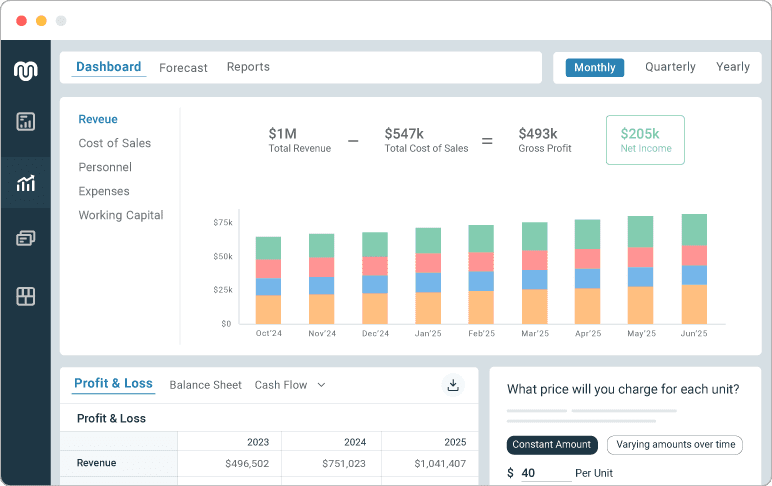
Upmetrics simplifies the process with built-in formulas and an automated visual dashboard. From sales and expenses to cash flow, our AI-powered forecasting tool helps you shape your financial strategy with confidence.
- AI-Powered Forecasting: AI provides suggestions for revenue/expense streams while answering all your financial questions. Built-in formulas ensure accurate calculations without manual checks.
- Automated Visual Dashboard: Get a complete picture of your financials in one click. Transform raw financial data into dynamic models with easy-to-read charts and reports.
- Scenario Planning: Prepare for even the most uncertain times by modeling different financial scenarios. Upmetrics makes scenario planning and what-if analysis easier.
- Plan vs. Actual Analysis: Integrate accounting software (QuickBooks/ Xero) and track actual performance against projections. Real-time analysis helps optimize future decisions.
4) Forecast revenue and expenses
As you reach this step, you should already have your rough cost estimates and revenue categories in place.
Now, it’s time to put numbers into play. I’m dividing the entire process into a few steps, so it’s easier to understand and follow:
- Start with revenue projections, then expenses
- Create revenue categories and add numbers
- Then move to the next category and expenses
First, let’s only focus on revenue projections. And, once you have finished forecasting for all revenue streams, you should move on to forecasting expenses.
Starting with revenue (sales) projections
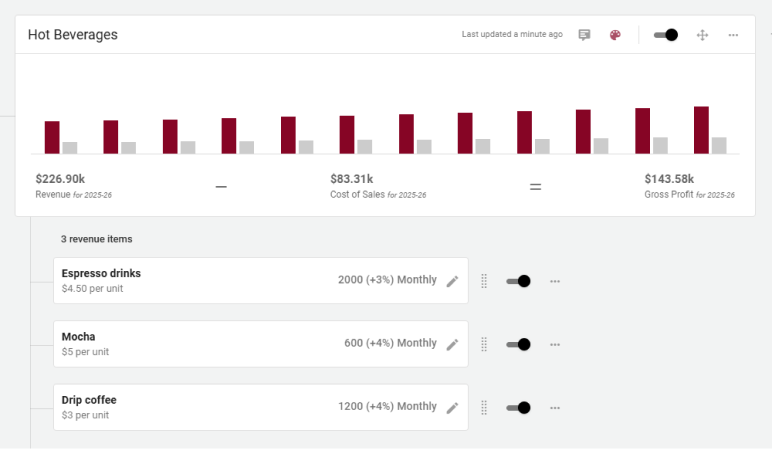
Always start by splitting revenue into categories that reflect how the business actually earns. For example:
- A café might have hot/cold beverages, snacks, and packaged goods.
- A SaaS startup could break revenue down by subscription tiers.
- An e-commerce brand might use product categories like shoes, apparel, and accessories.
This structure keeps projections organized. If one line grows faster than expected, you can quickly see its impact without overhauling the entire plan.
Once you have the categories ready, add numbers: numbers of units sold, average price per unit, frequency of purchase or subscription renewal.
Here’s an example for a cafe:
- Hot beverages: 3,000 cups × $3 = $9,000/month
- Cold beverages: 1,500 cups × $4 = $6,000/month
This step can be followed for all the other categories and revenue groups.
How to add the numbers:
If you’re an early-stage startup with no historical sales, a bottom-up approach works best. Start at the unit level (customers × average spend) and scale up. It forces you to justify every number.
If you’re already operating, historical data gives you a baseline. I look at past months or years, then adjust for seasonality, growth goals, or market shifts.
Making expense projections
If you’re selling products, you must include direct costs, like ingredients, packaging, shipping, or manufacturing. For services, you can roll related labor or software into operating expenses instead.
Example for the café:
- Hot beverages: $1 COGS per cup (beans, milk, cup)
- Cold beverages: $1.50 per cup
Subtracting these from revenue gives you gross margin, something investors often look for in projections.
COGS (Costs of Goods Sold) aren’t your only expenses. Next, add numbers to the startup costs we considered earlier.
- Fixed expenses: rent, salaries, insurance, utilities, and software.
- Variable expenses: marketing ads, payment fees, commissions.
- One-time costs: launch campaigns, equipment, and legal fees.
Kaylee suggests tying each expense back to a business driver. For instance, “if I plan $2,000 in monthly marketing spend, I also show how many customers I expect to acquire with it.”
It not only makes your projections more credible, but it also helps investors understand how your investment is bringing in business.
5) Prepare key financial statements
Don’t overthink the financial statements. You don’t need dozens of different reports. For a startup financial plan, there are really just four core statements that matter.
Here are the four key financial statements you’d need:
- Income statement (P&L)
- Cash flow statement
- Balance sheet
- Break-even analysis
Why just these four? Because they’re the statements investors and lenders actually care about. They cover profitability, cash health, overall stability, and sustainability. (We’ll discuss this in detail in a section ahead.)
While other reports can come later as the business grows, these are enough to prove that you’ve thought through the financial fundamentals.
6. Add key startup metrics & unit economics
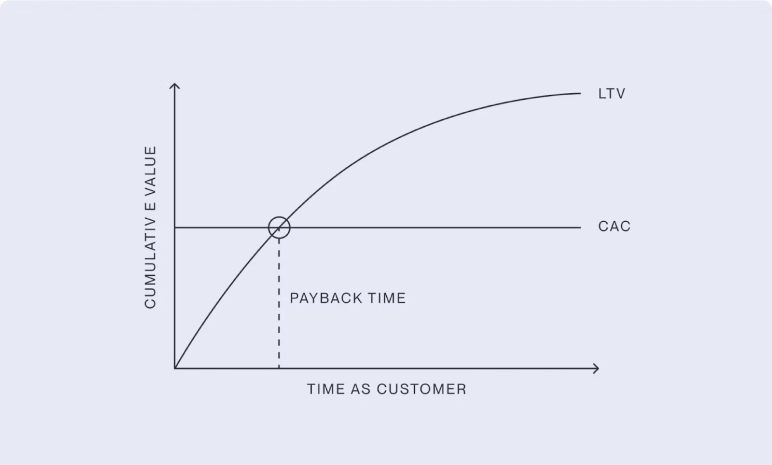
Think of unit economics as the story of one customer: how much it costs to acquire them, how much revenue they bring in, and how long they stick around. If the math doesn’t work for one customer, it won’t magically work when you scale to hundreds or thousands.
Here are the metrics you should always include in your startup financial plan:
- Customer Acquisition Cost (CAC): How much it costs to get one paying customer. For ex. $50 in ad spend → 1 customer acquired = $50 CAC.)
- Lifetime Value (LTV): The total revenue you expect to earn from a single customer before they churn. For instance, If a subscription is $20/month and the average customer stays for 12 months, LTV = $240.
- Gross margin: The percentage of revenue left after covering direct costs (COGS). This shows how profitable each sale is.
- Burn rate: How much money your startup spends each month.
- Runway: How many months can your startup survive at the current burn rate before you run out of cash?
What most people don’t realize about unit economics is that investors don’t just look at the numbers in isolation — they care about how those numbers behave as you scale.
An investor might ask:
- What happens to CAC when you try to double customer acquisition?
- Does LTV improve as retention strategies kick in?
- Or does churn rise when you move beyond early adopters?
In short, they’re not just evaluating your current unit economics, but also how resilient your numbers are in different scenarios or under growth pressure.
Tracking metrics in a spreadsheet gets messy fast
See CAC, LTV, and runway in one visual dashboard

7. Run scenarios & monitor plan vs. actuals (ongoing)
This isn’t really a one-time step in financial planning—it’s an ongoing practice that keeps your projections relevant.
Kaylee says, “We always recommend plan vs. actual analysis because it’s the simplest way to know if you’re staying on track.”
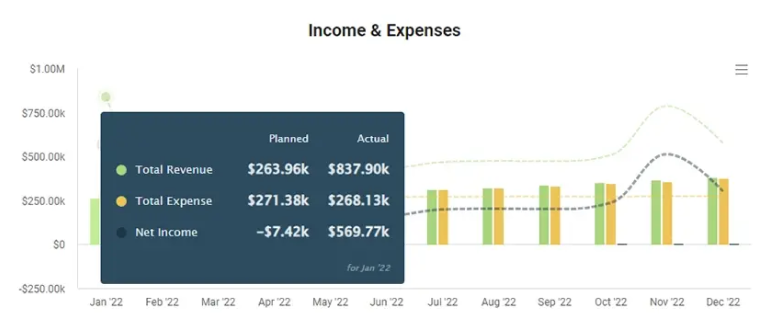
Here’s how it works: once a month (or at least quarterly), compare your projections against what actually happened. If expenses run 20-30% higher than forecast, update your model.
If churn is double what you expected, revisit your runway. Without this discipline, a financial plan quickly becomes static and irrelevant. You need this practice to stay relevant.
Now, this is where scenario planning becomes invaluable. If you’ve already modeled multiple versions of the future, you can quickly see which one your actuals are aligning with:
- A conservative case (if things take longer or cost more),
- An expected case (your realistic baseline), and
- An optimistic case (if growth picks up faster).
Looking at these side-by-side stress tests your model.
For example, how does your runway change if CAC jumps 25%? What if revenue takes six extra months to build? Instead of scrambling when things shift, you’re prepared with a clear response.
First-time founders often skip this practice. They stop at “investor-ready” forecasts or assume they don’t have enough data yet.
But in reality, this is exactly when plan vs. actual analysis and scenario planning matter most — because early-stage startups live in uncertainty.
Doing both not only helps you make better decisions, it also shows investors that you’ve thought out your financials thoroughly and know how to manage risks, not just betting on one perfect version of the future.
Key components of your startup financial plan
These four statements are considered the key components of a financial plan because together they give a complete picture of your startup’s financial health and future potential.
1) Income statement (P&L statement)
Your income or P&L statement shows whether your startup can turn revenue into profit over time. Investors look here to see growth potential and how efficiently you manage expenses.
For example, if your café projects $20,000 in monthly sales and $15,000 in expenses, the income statement shows a $5,000 profit.
2) Cash flow statement
Your cash flow statement tracks how money moves in and out of your business.
Jessie Hagen of the US bank reported in her report that 82% of startups fail due to poor cash flow visibility and management. The main reason lenders and investors care about cash flow statements.
For example, your income statement may show $5,000 profit, but if customer payments are delayed 60 days while rent and salaries are due now, your cash flow statement could show a negative balance.
3) Balance sheet
Your balance sheet provides a snapshot of your startup’s financial position — what you own, what you owe, and what’s left over. It’s a quick health check on stability and leverage.
For example: If your café owns $50,000 worth of equipment (assets) financed by a $30,000 bank loan (liabilities), your equity is $20,000.
4) Break-even analysis
Break-even analysis highlights the exact point where your revenue covers your costs. This is often one of the first numbers both investors and founders want to know, because it shows when the business starts to sustain itself
For example, if your café spends $10,000/month and makes $5 profit per cup of coffee, you’ll need to sell 2,000 cups a month to break even.
Startup financial plan example (for your business plan)
Wondering how you should present your financial projections in your business plan? Here’s a sample financial section of a coffee shop business plan for your reference:
Important Assumptions
- The sales forecast is conservative and assumes a 5% increase in Year 2 and a 10% in Year 3.
- The analysis accounts for economic seasonality – wherein some months revenues peak (such as holidays ) and wanes in slower months.
- The analysis assumes the owner will not withdraw any salary till the 3rd year; at any time it is assumed that the owner’s withdrawal is available at his discretion.
- Sales are cash basis – nonaccrual accounting
- Moderate ramp- up in staff over the 5 years forecast
- Barista salary in the forecast is $36,000 in 2023.
- In general, most cafes have an 85% gross profit margin
- In general, most cafes have a 3% net profit margin
Projected Balance Sheet
| 2023–24 | 2024–25 | 2025–26 | Total | |
|---|---|---|---|---|
| Assets | -$72,334.68 | -$85,783.42 | $66,627.32 | $66,627.32 |
| Current Assets | -$169,703.12 | -$158,820.30 | $32,522.00 | $32,522.00 |
| Cash | -$169,704.82 | -$158,822.00 | $32,520.30 | $32,520.30 |
| Accounts Receivable | $0 | $0 | $0 | $0 |
| Inventory | $0 | $0 | $0 | $0 |
| Other Current Assets | $1.70 | $1.70 | $1.70 | $1.70 |
| Long Term Assets | $97,368.44 | $73,036.88 | $34,105.32 | $34,105.32 |
| Gross Long Term Assets | $121,700.00 | $121,700.00 | $107,100.00 | $107,100.00 |
| Accumulated Depreciation | -$24,331.56 | -$48,663.12 | -$72,994.68 | -$72,994.68 |
| Liabilities & Equity | $89,665.33 | $76,216.59 | $243,227.31 | $243,227.31 |
| Liabilities | $204,479.13 | $190,728.67 | $212,425.29 | $212,425.29 |
| Current Liabilities | $63,417.69 | $82,454.57 | $100,930.50 | $100,930.50 |
| Accounts Payable | $1,360.76 | $1,747.59 | $2,221.83 | $2,221.83 |
| Income Tax Payable | $0 | $0 | $36,224.21 | $36,224.21 |
| Sales Tax Payable | $29,790.15 | $45,061.45 | $62,484.46 | $62,484.46 |
| Short Term Debt | $32,266.78 | $35,645.53 | $0 | $0 |
| Long Term Liabilities | $141,061.44 | $108,274.10 | $111,494.79 | $111,494.79 |
| Long Term Debt | $141,061.44 | $108,274.10 | $111,494.79 | $111,494.79 |
| Equity | -$114,813.80 | -$114,512.08 | $30,802.02 | $30,802.02 |
| Paid-in Capital | $75,000.00 | $75,000.00 | $75,000.00 | $75,000.00 |
| Common Stock | $0 | $0 | $0 | $0 |
| Preferred Stock | $0 | $0 | $0 | $0 |
| Owner’s Contribution | $0 | $0 | $0 | $0 |
| Retained Earnings | -$189,813.80 | -$189,512.08 | -$44,197.98 | -$44,197.98 |
| Check | -$162,000 | -$162,000 | -$176,600 | -$176,600 |
Projected Cash-Flow Statement
| 2023–24 | 2024–25 | 2025–26 | Total | |
|---|---|---|---|---|
| Cash Received | $526,292.48 | $796,085.24 | $1,103,892.49 | $2,426,270.21 |
| Cash Paid | $567,625.51 | $695,793.83 | $820,125.37 | $2,083,544.71 |
| COS & General Expenses | $264,403.66 | $354,618.63 | $453,150.10 | $1,072,172.39 |
| Salary & Wages | $282,000.00 | $294,900.00 | $308,445.00 | $885,345.00 |
| Interest | $19,221.85 | $16,485.05 | $13,468.79 | $49,175.71 |
| Sales Tax | $0 | $29,790.15 | $45,061.45 | $74,851.60 |
| Income Tax | $2,000.00 | $0 | $0 | $2,000.00 |
| Net Cash From Operations | -$41,333.03 | $100,291.41 | $283,767.12 | $342,725.50 |
| Assets Sell | $0 | $0 | $0 | $0 |
| Assets Purchase | $51,700.00 | $0 | $0 | $51,700.00 |
| Net Cash From Investments | -$51,700.00 | $0 | $0 | -$51,700.00 |
| Amount Received | $0 | $0 | $0 | $0 |
| Loan Received | $0 | $0 | $0 | $0 |
| Common Stock | $0 | $0 | $0 | $0 |
| Preferred Stock | $0 | $0 | $0 | $0 |
| Owner’s Contribution | $0 | $0 | $0 | $0 |
| Amount Paid | $86,671.79 | $89,408.59 | $92,424.82 | $268,505.20 |
| Loan Capital | $26,671.79 | $29,408.59 | $32,424.82 | $88,505.20 |
| Dividends & Distributions | $60,000.00 | $60,000.00 | $60,000.00 | $180,000.00 |
| Net Cash From Financing | -$86,671.79 | -$89,408.59 | -$92,424.82 | -$268,505.20 |
| Summary | ||||
| Starting Cash | $10,000.00 | -$169,704.82 | -$158,822.00 | $10,000.00 |
| Cash In | $526,292.48 | $796,085.24 | $1,103,892.49 | $2,426,270.21 |
| Cash Out | $705,997.30 | $785,202.42 | $912,550.19 | $2,403,749.91 |
| Change in Cash | -$179,704.82 | $10,882.82 | $191,342.30 | $22,520.30 |
| Ending Cash | -$169,704.82 | -$158,822.00 | $32,520.30 | $32,520.30 |
Projected Profit & Loss Statement
| 2023-24 | 2024-25 | 2025-26 | Total | |
|---|---|---|---|---|
| Revenue | $496,502.28 | $751,023.72 | $1,041,407.93 | $2,288,933.92 |
| Pastry | $107,603.82 | $191,043.14 | $288,745.25 | $587,392.20 |
| Espresso | $102,600 | $102,600 | $102,600 | $307,800 |
| Cheesecake | $60,354.14 | $76,543.07 | $97,075.49 | $233,972.69 |
| Cold Beverages | $85,077.15 | $155,304.60 | $191,901.83 | $432,283.58 |
| Cappuccino | $140,867.17 | $225,532.91 | $361,085.36 | $727,485.45 |
| Cost Of Sales | $352,334.47 | $446,411.79 | $547,515.18 | $1,346,261.44 |
| General Costs | $0 | $0 | $0 | $0 |
| Revenue Specific Costs | $142,334.47 | $227,111.79 | $318,450.18 | $687,896.44 |
| Personnel Costs (Direct Labor) | $210,000 | $219,300 | $229,065 | $658,365 |
| Gross Margin | $144,167.81 | $304,611.93 | $493,892.75 | $942,672.48 |
| Gross Margin (%) | 29.04% | 40.56% | 47.43% | 41.18% |
| Operating Expense | $230,428.23 | $203,493.66 | $214,554.16 | $648,476.05 |
| Payroll Expense (Indirect Labor) | $72,000 | $75,600 | $79,380 | $226,980 |
| General Expense | $121,429.93 | $127,893.66 | $135,174.16 | $384,497.75 |
| Bad Debt | $0 | $0 | $0 | $0 |
| Amortization of Current Assets | $36,998.30 | $0 | $0 | $36,998.30 |
| EBITDA | -$86,260.39 | $101,118.33 | $279,338.69 | $294,196.63 |
| Additional Expense | $43,553.41 | $40,816.61 | $74,024.59 | $158,394.61 |
| Long Term Depreciation | $24,331.56 | $24,331.56 | $24,331.56 | $72,994.68 |
| Gain or loss from Sale of Assets | $0 | $0 | $0 | $0 |
| Interest Expenses | $19,221.85 | $16,485.05 | $13,468.79 | $49,175.71 |
| Income Tax Expense | $0 | $0 | $36,224.21 | $36,224.21 |
| Total Expense | $626,316.13 | $690,722.07 | $836,093.93 | $2,153,132.13 |
| Net Income | -$129,813.80 | $60,301.72 | $205,314.10 | $135,802.02 |
| Net Income (%) | -26.15% | 8.03% | 19.72% | 5.93% |
| Retained Earning Opening | $0 | -$189,813.80 | -$189,512.08 | $0 |
| Owner’s Distribution | $60,000 | $60,000 | $60,000 | $180,000 |
| Retained Earning Closing | -$189,813.80 | -$189,512.08 | -$44,197.98 | -$44,197.98 |
Break Even Analysis
| 2023–24 | 2024–25 | 2025–26 | Total | |
|---|---|---|---|---|
| Starting Revenue | $0 | $0 | $0 | $0 |
| Net Revenue | $496,502.28 | $751,023.72 | $1,041,407.93 | $2,288,933.92 |
| Closing Revenue | $496,502.33 | $1,247,526.12 | $2,288,934.15 | $2,288,934.15 |
| Starting Expense | $0 | $0 | $0 | $0 |
| Net Expense | $626,316.13 | $690,722.07 | $836,093.93 | $2,153,132.13 |
| Closing Expense | $626,316.13 | $1,317,038.20 | $2,153,132.13 | $2,153,132.13 |
| Break Even Revenue | $626,316.13 | $1,317,038.20 | $1,562,412.59 | $1,562,412.59 |
| Is Break Even? | No | No | Yes | Yes |
| Break Even Month | Feb ’26 | Feb ’26 | ||
| Days Required | 3 Days | 3 Days | ||
Tools and resources for financial planning
If you’ve read this far, you already know enough about startup financial planning, as much as you could start planning for your business. To make the process even smoother, here are a few tools and resources I recommend:
- Financial Forecasting Software: Instead of building everything in spreadsheets, use a tool like Upmetrics to create forecasts, run scenarios, and generate financial statements.
- Sales Forecasting Guide: A practical guide to help you break revenue into categories, estimate sales volume, and set realistic targets. Perfect if you’re unsure how to turn assumptions into actual sales projections.
- Startup Cost Worksheet: A simple worksheet to list one-time and recurring expenses, so you don’t miss hidden costs like permits, insurance, or software subscriptions.
- Financial statements Template: Templates for income statement, cash flow, balance sheet, and break-even analysis. These give you a head start and help you present numbers in the format investors expect.
Plan your financials using Upmetrics
From determining financial goals and calculating startup costs to conducting plan vs. actual analysis, we covered everything in this article. Hope you have all the knowledge and information you need to finish your financial plan.
For the tools and resources, Upmetrics is always here to help. Check out our resources library for more resources on business and financial planning.
If you’re still figuring out the spreadsheets, it’s time to make a switch to Upmetrics. Try Upmetrics for automated and AI-powered financial planning. 15-day money-back guarantee.
Frequently Asked Questions
How often should I update my financial projections?
How do I estimate startup costs accurately?
What financial ratios should startups pay attention to?
What are the 3 different scenarios in scenario analysis?
How detailed should my financial projections be?
Why do investors care more about financial projections?
How detailed should financial projections be for securing loans?
How do I create projections when I lack data?
Is it okay to include personal finances in my business financial plan?
How much runway should I show in my financials?
What do U.S. lenders expect in a startup financial plan?
What unit economics matter in financial projections?

Ajay Jagtap
Ajay Jagtap is the Head of Growth Marketing at Upmetrics. With 5+ years of experience in product-led content and growth strategy, he leads product webinars, reviews tools, and creates content that simplifies complex planning concepts for startups and businesses. He writes extensively on business planning, product-led growth, and marketing strategies. Read more