Starting a medical lab isn’t like starting a typical small business. Before the first test is processed, there are CLIA certifications, state licensing, equipment procurement, and a reimbursement cycle, which means revenue arrives weeks after the work is done. Most labs that struggle early do so because the planning wasn’t specific enough before the doors opened.
A business plan forces that specificity. It defines what tests the lab will offer, what it will cost to get operational, how long until break-even, and what the billing and collections cycle actually looks like in practice.
It also answers the questions lenders and regulators ask: Is the projected test volume realistic? Are the fixed costs sustainable? Are the compliance risks understood and managed? A grounded plan doesn’t just improve the chances of getting funded. It provides you with a concrete benchmark to run the business against once it’s open.
That’s why, here’s a detailed business plan that you can use to address all your concerns and start off today!
Medical Lab Business Plan (Precision Diagnostics Lab LLC)
Executive Summary
Precision Diagnostics Lab LLC is an independent clinical diagnostic laboratory opening at 1890 Medical Park Drive, Suite 305, San Diego, CA 92123. The lab will process routine blood work, urinalysis, pregnancy tests, basic pathology screenings, and PCR testing for common infections. Mainly for healthcare providers ordering routine diagnostic tests. Advanced genetic testing and complex pathology are excluded from the initial scope.
The business is equally owned by Dr. Emily Stone and John Richards. Dr. Stone holds a PhD in Clinical Pathology and is a licensed CLIA Clinical Laboratory Director with eight years of diagnostic and lab management experience. Richards brings 10 years of experience in healthcare administration, covering medical billing, insurance verification, and Medicare/Medicaid compliance. Both owners provide personal guarantees on the loan.
The Opportunity
Primary care physicians, urgent care centers, specialists, and hospitals require reliable diagnostic results for routine patient care. Large chains like LabCorp and Quest Diagnostics handle enormous volume, but independent labs hold a competitive position through direct communication with referring providers and fewer layers between the specimen and the report. Precision Diagnostics Lab is built around that model: routine work, processed locally, with results delivered back to the ordering provider without the delays common at high-volume national operations.
Funding Request
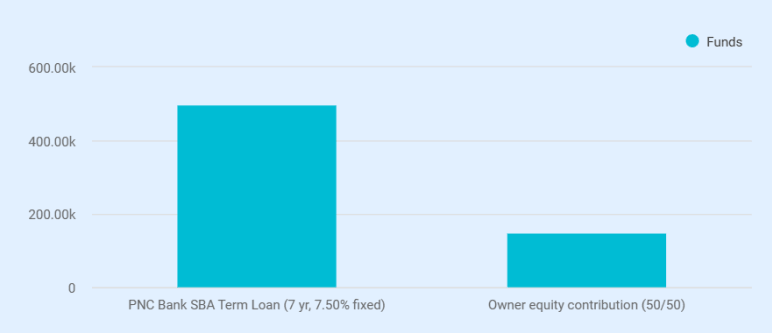
Total startup capital is $650,000. The owners are contributing $150,000 in equity, covering working capital and licensing costs. The remaining $500,000 is requested as a Small Business Term Loan from PNC Bank at 7.50% fixed over 7 years.
Loan funds break down as: lab equipment ($250,000, vendor quotes in hand), office and IT setup ($20,000), and initial medical supplies ($50,000). The remaining $180,600 sits as an operating reserve.
Monthly payments begin at $3,125 interest-only during the three-month buildout, then shift to $7,857 per month. The interest-only structure eliminates debt service during the three-month pre-revenue buildout period.
Financial Snapshot
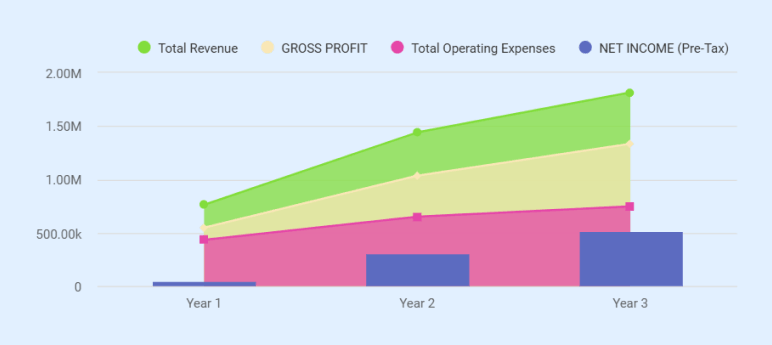
Revenue comes from fee-for-service diagnostic testing billed through Medicare, Medicaid, and private insurance. Based on the projected test mix, the weighted average billed rate per test is approximately $89 using the category midpoints shown in the pricing table. After applying a 78% insurance collection factor, net collected revenue is approximately $69.50 per test. The lab opens for testing in Month 4 and ramps to full operations by Month 7.
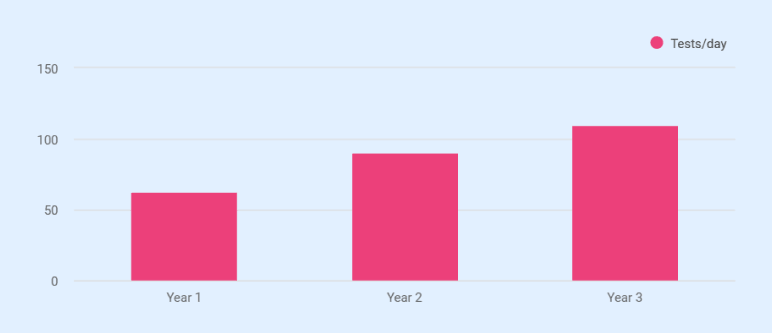
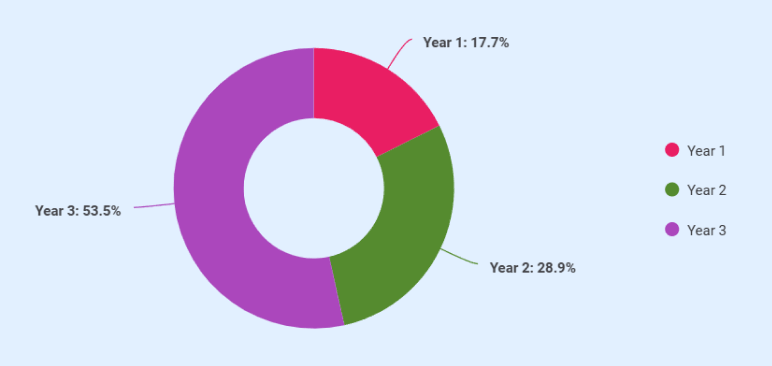
Year 1 is a ramp year. With 9 revenue-generating months and an average of 63 tests/day, projected revenue reaches $762,000. That falls short of the $993,360 annual break-even at the full cost structure. To keep net income positive at $48,005, both owners have reduced their Year 1 salaries to $48,000 each, well below their full compensation rates. Year 2 revenue climbs to $1,440,000 at 90 tests/day, with EBITDA of $384,334. Against $94,284 in annual loan payments, that produces a debt service coverage ratio of approximately 4.1x. Year 3 projects $1,815,000 in revenue with $586,090 in EBITDA.
Key Risk
The single biggest risk to this plan is daily test volume. If physician referrals build more slowly than projected, the gap between actual revenue and the 62-tests-per-day break-even threshold widens. The owners have accepted reduced compensation in Year 1 specifically to absorb that pressure. Equipment service contracts, early regulatory consultation, and a working capital reserve built into the startup budget provide additional protection during ramp-up.
Medicare Reimbursement Risk
Medicare reimbursement rates are subject to federal regulation under the Protecting Access to Medicare Act (PAMA). Scheduled Clinical Laboratory Fee Schedule reductions of up to 15%/year are set to begin in January 2027 and continue through 2029. Under the current financial model, a 10% reduction in Medicare reimbursement would decrease net collected revenue from $64 per test to approximately $61.50/test, which would compress EBITDA in the later years of the loan term. To mitigate this risk, the lab will actively expand its commercial payer mix and pursue direct-pay contracts with self-insured employers in the San Diego market to reduce reliance on Medicare-based revenue.
Want a professional plan like this sample?
Upmetrics AI generate a complete, investor-ready plan for you

Company Description
Legal Structure and Ownership
Precision Diagnostics Lab is structured as a multi-member limited liability company, providing liability protection to the owners while allowing operational flexibility and pass-through taxation. Ownership is split equally between Dr. Emily Stone and John Richards, each holding a 50% stake in the business. Both owners have provided personal guarantees on the loan.
Dr. Emily Stone serves as Clinical Laboratory Director and is responsible for all clinical operations, including test validation, result review, regulatory compliance under CLIA, and supervision of laboratory staff. John Richards oversees operations and finance, including billing, insurance coordination, staffing, financial management, and physician outreach.
Location and Facility
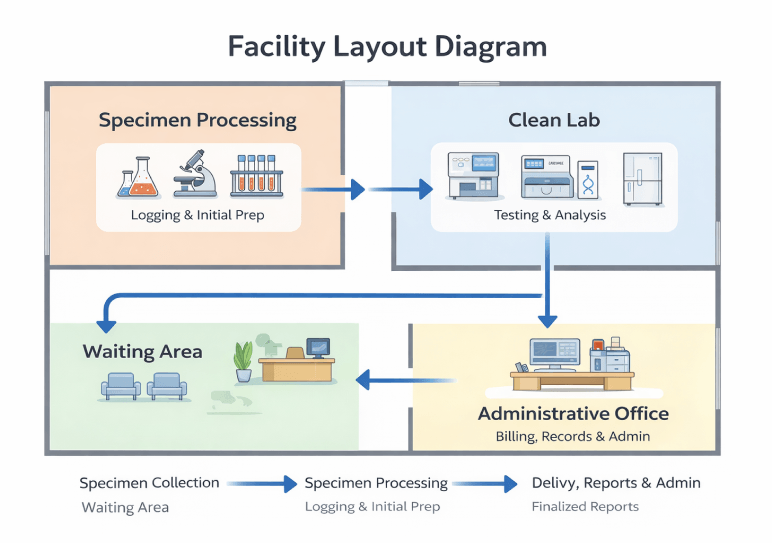
The lab leases 2,500 square feet at 1890 Medical Park Drive, Suite 305, San Diego, CA 92123, inside a medical office complex. The space includes a specimen processing area, a clean lab, a small waiting area, and an administrative office. Sitting within a medical park supports early referral development, though the lab will still rely on specimen transport for accounts outside the building.
Lease cost is $28/square foot ($70,000 annually) with a 3% annual escalation. The startup budget includes a $15,000 refundable security deposit and $15,000 in prepaid rent.
Scope of Services
Core services include standard blood panels (CBC, lipid, liver and kidney function, glucose), urinalysis, pregnancy testing, basic pathology screenings for STDs and infectious diseases, and PCR testing for common infections.
The lab doesn’t perform advanced genetic testing, complex pathology, or specialized diagnostics. That exclusion keeps equipment costs, staffing requirements, and regulatory burden at a level the current capital structure supports.
Licensing and Regulatory Standing
The lab will obtain CLIA certification, state health department licensure, and a Medicare/Medicaid provider number. Operations will comply with HIPAA, OSHA, and CDC specimen handling guidelines. Dr. Stone’s credentials as a licensed CLIA Clinical Laboratory Director satisfy the federal lab director requirement, avoiding the cost and delay of an external hire.
Products & Services
Test Menu and Pricing
Precision Diagnostics Lab offers five categories of routine diagnostic testing:
| Test Category | Price Range | Share of Test Mix |
| Blood panels (CBC, lipid, liver/kidney function, glucose) | $50-$150 | 40% |
| Urinalysis | $30-$50 | 25% |
| Pregnancy tests | $25-$40 | 5% |
| Basic pathology screenings (STDs, infectious disease panels) | $75-$200 | 20% |
| PCR testing for common infections | $80-$120 | 10% |
Blood panels make up the largest share of volume, which is typical for a lab serving primary care and urgent care providers. Pathology and PCR testing carry higher per-test revenue but lower volume. The financial model uses a weighted average billed rate of $82/test based on expected mix and contracted pricing.
Revenue Model
Each completed test is billed to the patient’s insurance carrier, Medicare, Medicaid, or directly to the client. The insurance collection factor is 78% of billed charges, accounting for contractual adjustments, claim denials, and payment delays standard across diagnostic labs. The net collected revenue is $64/test in Years 1 and 2, rising to $66 in Year 3 due to a modest payer contract uplift.
The financial model assumes a 45-day accounts receivable cycle. Cash doesn’t arrive on the day a test is processed, which is one reason the working capital reserve exists in the startup budget.
Capacity
The lab can process a maximum of 120 tests/day based on staffing and equipment throughput, across 250 working days per year (Monday through Friday).
- Year 1 averages 63 tests/day across 9 revenue months, producing 11,900 total tests.
- Year 2 rises to 90 tests/day (22,500 tests).
- Year 3 reaches 110 tests/day (27,500 tests), putting utilization at roughly 92% of maximum capacity.
Beyond that point, adding volume would require additional staff or equipment.
The ramp from 63-110 tests/day assumes steady growth in physician referral accounts. Lower-than-projected daily volume would compress margins under the Year 2 cost structure.
Service Boundaries
The lab doesn’t offer advanced genetic testing, molecular sequencing, complex surgical pathology, or toxicology screening. Those services require different equipment, higher-credentialed staff, and additional regulatory certifications. Expanding into specialty diagnostics isn’t part of this plan or this funding request.
Market Analysis
Industry Overview
The U.S. clinical laboratory market was valued at $99.7 billion in 2024. Independent stand-alone labs are growing at 8.2% annually through 2030, outpacing the broader market. That growth reflects something real: physicians want faster, more responsive lab partners than national chains typically provide. LabCorp and Quest have scale. They don’t have flexibility.
There were more than 317,000 CLIA-certified facilities nationwide in 2023, which sounds like a crowded market until you look locally. Most are small-volume hospital or physician-owned operations. In the Medical Park Drive corridor, the day-to-day competition is LabCorp, Quest, and hospital-affiliated labs. The national number doesn’t translate into local pressure.
San Diego Demand Drivers
San Diego County has a population of roughly 3.3 million. The chronic disease profile here generates the kind of recurring, predictable testing volume that a lab business model depends on:
| Condition/Patient Type | Testing Pattern |
| Diabetes (8.5% of SD County adults) | HbA1c and metabolic panels, 2-4 times/year |
| Cardiovascular disease and hypertension | Routine lipid panels, metabolic workups |
| Medicare beneficiaries | Average 14 lab tests annually |
| Adults under 40 | Average 4 lab tests annually |
Diabetic patients alone generate consistent, repeat volume from primary care practices. A single physician managing 200 diabetic patients generates 400 to 800 lab orders a year from that condition alone. Add cardiovascular monitoring and routine preventive panels, and the baseline volume case becomes straightforward.
San Diego’s aging population reinforces this. The Medicare testing differential, 14 tests/year versus 4 for younger adults, matters more as the senior share of the county grows. In practice, the demand is already here. The question is whether the lab can capture a reliable slice of it from the physician practices nearby.
Target Clients
The lab serves healthcare providers who order routine diagnostic tests as part of standard patient care. Ranked by expected volume contribution:
- Primary care physicians and family practices: Most consistent repeat volume from routine physicals, chronic disease monitoring, and preventive screenings.
- Urgent care centers: Same-day blood work, urinalysis, and infection panels. Moderate but steady volume per account.
- Specialists (endocrinologists, cardiologists, OB-GYNs): Lower frequency, higher per-test value. Lipid panels, glucose monitoring, and STD screenings.
- Hospitals and outpatient facilities: Overflow work when in-house labs hit capacity. Less predictable, but can arrive in batches.
- Independent clinics and small group practices: No in-house lab capability. Easier to win, individually lower in volume.
Primary care and urgent care will account for the majority of early revenue. Specialist and hospital accounts take longer to establish because credentialing and vendor approval cycles at larger organizations run 60-90 days or more.
Competitive Landscape
| Competitor Type | Strengths | Weaknesses |
| National chains (LabCorp, Quest) | Brand recognition, insurance network coverage, massive capacity | Less flexible turnaround for smaller accounts, limited direct provider communication |
| Hospital-affiliated labs | Built-in referral base, established credentialing | Restricted to the affiliated network, capacity constraints during peak periods |
| Other independent labs | Local relationships, flexible service | Varies in quality, compliance standing, and financial stability |
Competing with national chains on volume or price is not realistic for an independent startup. The differentiation is in service execution, specifically speed, access, and reliability. Precision Diagnostics Lab is structured to return routine test results within 24 hours of specimen receipt, compared to the typical 48–72 hour turnaround at large regional processing labs. Referring providers have direct phone access to the lab director and operations lead, rather than routing through centralized call centers. Specimen pickups are scheduled with defined daily time windows and tracked for consistency, reducing missed or delayed collections that are common pain points with high-volume providers.
This positioning is measurable: faster turnaround, direct clinical access, and predictable logistics. These factors directly influence physician retention, as delays or communication gaps disrupt patient care. The model only works if execution is consistent. A single missed pickup or delayed result can break provider trust and result in lost accounts.
Referral Behavior
Physicians choose labs based on insurance acceptance, turnaround time, accuracy, and ease of communication. Most primary care offices work with 2-3 labs simultaneously. The goal is to become one of those, not to replace the incumbent entirely.
The realistic path starts with smaller practices and independent clinics where switching costs are low. Larger group practices and hospital overflow accounts come later, once the lab has a track record of clean results and clean billing.
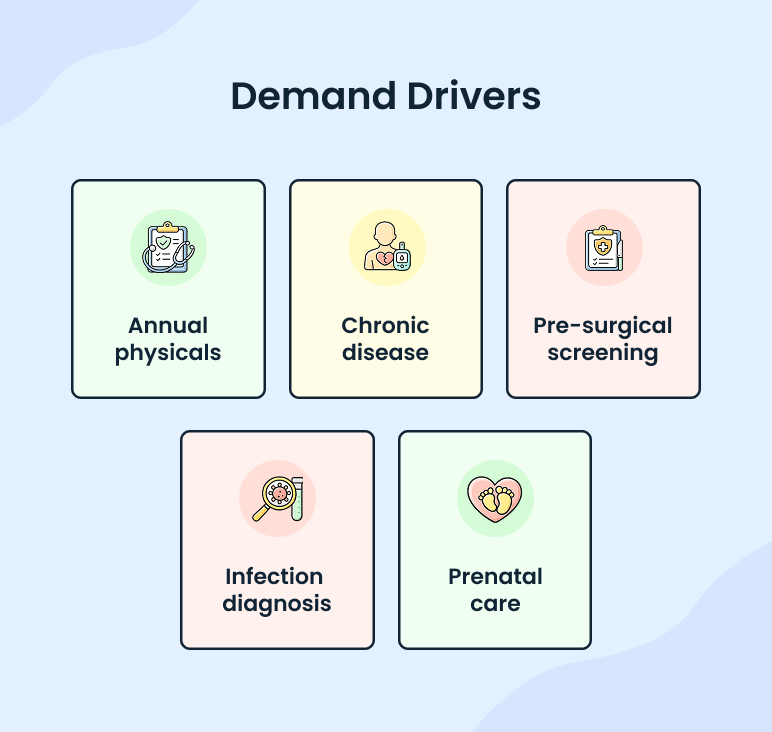
Demand Drivers
Routine diagnostic testing follows the rhythm of everyday healthcare delivery: annual physicals, chronic disease management, pre-surgical screening, infection diagnosis, and prenatal care. Volume does not depend on a single trend or seasonal cycle. The constraint is not whether demand exists. It’s whether this lab can capture enough referral share to fill its daily capacity.
Volume Sensitivity Analysis
Daily test volume is the single most important driver of financial performance. To evaluate downside risk and operational stability, the table below shows how changes in daily volume affect revenue, EBITDA, and cash sustainability under the existing cost structure.
All scenarios use the same core assumptions: net revenue of $64/test, variable cost of $19.50/test, and fixed costs aligned with the Year 2 operating level.
| Daily Tests | Annual Tests | Annual Revenue | EBITDA | Cash Position Impact |
| 40 | 10,000 | $640,000 | ($131,000) | Sustained cash burn; working capital reserve required |
| 50 | 12,500 | $800,000 | ($20,000) | Near break-even; limited margin for error |
| 62 | 15,500 | $993,000 | ~$0 | Break-even level; stable operations |
| 75 | 18,750 | $1,200,000 | ~$170,000 | Positive cash flow; debt service comfortably covered |
| 90 | 22,500 | $1,440,000 | ~$384,000 | Strong profitability; surplus cash generation |
At 40 tests per day, the lab operates materially below break-even, requiring ongoing use of the working capital reserve to cover fixed costs. At 50 tests per day, the business approaches break-even but remains exposed to normal variability in collections and expenses. The break-even threshold occurs at approximately 62 tests per day, where contribution margin offsets fixed operating costs.
Above this level, incremental volume converts efficiently into operating income due to the fixed-cost structure. At 75 tests per day, the lab generates sufficient earnings to support debt obligations and maintain liquidity. At 90 tests per day, the business produces a strong operating surplus, consistent with the Year 2 forecast.
This analysis reinforces that early referral volume is the primary execution risk. The $265,000 working capital reserve provides a buffer during the ramp period if physician acquisition progresses more slowly than planned.
Stop searching the internet for industry & market data
Get AI to bring curated insights to your workspace
Marketing & Sales Strategy
Acquisition Approach
The lab’s primary sales channel is direct physician outreach. John Richards will visit medical offices in the San Diego market to introduce the lab, confirm insurance network coverage, and establish specimen pickup logistics. Each new account requires an introductory meeting and often a trial period before a practice commits to regular orders. The ramp from 63 tests/day in Year 1 to 90 in Year 2 depends on how many of these conversations convert into active accounts.
Channel Priorities
With a $20,000 Year 1 marketing budget and both owners working full-time in operations, marketing capacity is limited.
| Channel | Priority |
| In-person physician outreach | Primary |
| Medical community networking | Secondary |
| Printed leave-behind materials | Supporting |
| Basic website (service menu, location, contact) | Supporting |
Digital advertising and broad-audience campaigns aren’t funded in Year 1. The target audience makes referral decisions through direct relationships, not online ads. Marketing spend rises to $24,000 in Year 2 as outreach expands to larger practices, then drops to $18,000 in Year 3 as the referral base stabilizes.
Retention
Winning an account matters less than keeping it. Retention depends on turnaround consistency, billing accuracy, and responsiveness. Dr. Stone handles clinical inquiries directly. Richards manages billing disputes and account logistics. There’s no dedicated sales team during the forecast period. The owners are the sales and retention function, which means outreach slows when daily operations get busy. The Year 1 ramp accounts for that constraint.
Discounted Testing
The plan includes selectively discounted testing for new accounts during their first 30-60 days as a switching incentive. This is not a permanent pricing strategy. It’s a short-term tool to reduce friction for practices currently sending specimens elsewhere.
Operations & Compliance
Workflow
Each test follows the same sequence.
- The referring provider submits an order.
- The specimen is collected at the physician’s office or on-site at the lab.
- A licensed medical courier transports it to the facility under CDC handling guidelines. On arrival, staff log the specimen into the LIMS and assign a unique tracking number.
- A technician processes and tests the specimen using CLIA-certified procedures.
- Dr. Stone or the supervising technician reviews the result before release.
- The completed report is transmitted to the ordering provider via the LIMS portal or fax, typically within 24 hours of receipt.
Order → Collection → Courier → Accession → Testing → Review → Report
Hours of Operation
Monday through Friday, 8:00 AM to 5:00 PM. No weekend or evening hours.
Facility Layout
The 2,500-square-foot suite is divided into four zones:
- Specimen processing area: Receiving, accessioning, initial preparation
- Clean lab: Testing equipment and analysis, separated from processing for contamination control
- Waiting area: On-site patient specimen collection
- Administrative office: Billing, scheduling, records
Equipment
| Equipment | Function |
| Automated hematology analyzers | CBC and blood cell analysis |
| Blood centrifuges | Specimen separation for serum-based tests |
| Medical-grade refrigerators | Specimen and reagent storage at controlled temperatures |
| Microscopes | Manual review for pathology screenings |
| Testing kits | Consumable kits for urinalysis, pregnancy, infection panels, and PCR |
Total equipment cost is $250,000, depreciated over 7 years. All equipment is purchased new with vendor service contracts. No molecular sequencing, toxicology, or radiology equipment is included.
Technology
The lab runs three core systems: LIMS for sample tracking and result delivery ($18,000/year), billing and practice management software for insurance and Medicare/Medicaid claims ($6,000/year), and HIPAA-compliant IT and data security infrastructure ($8,000/year). All patient data is stored electronically. No paper-based records are used for test results or patient health information.
Regulatory Compliance
| Framework | Covers |
| CLIA | Testing quality, personnel standards, proficiency testing, lab director qualifications |
| HIPAA | Patient data privacy, electronic records security, breach notification |
| OSHA | Workplace safety, bloodborne pathogen exposure, chemical handling |
| CDC guidelines | Specimen collection, handling, transport, and disposal protocols |
Dr. Stone maintains CLIA compliance, including proficiency testing and procedure documentation. Richards manages HIPAA and OSHA training records and audit preparation. Compliance-related costs are included in licensing ($15,000 Year 1, $5,000 ongoing) and CLIA expense categories ($5,000/year).
The biggest operational concern is not equipment failure. A compliance lapse that triggers a CLIA finding or delays the Medicare provider number would interrupt revenue during the ramp period when daily volume is still building.
Management & Staffing
Ownership Roles
| Owner | Role | Key Responsibilities |
| Dr. Emily Stone (50%) | Clinical Director, Lab Supervisor | Testing procedures, CLIA compliance, result review, technician oversight |
| John Richards (50%) | Operations and Finance Manager | Billing, insurance relations, staffing, financial oversight, physician outreach |
Dr. Stone holds a PhD in Clinical Pathology and is a licensed CLIA Clinical Laboratory Director with 8 years in diagnostics. Richards has 10 years in healthcare administration covering billing, insurance verification, and Medicare/Medicaid compliance. Both work full-time from launch.

The laboratory’s CLIA certification requires an active Clinical Laboratory Director, and Dr. Emily Stone currently serves in that role. This creates a direct key-person risk, as laboratory testing can’t legally continue without qualified oversight under CLIA regulations. To mitigate this dependency, the business will pre-identify and maintain a relationship with at least one credentialed backup Laboratory Director who meets CLIA requirements and can assume responsibility on short notice if needed. In parallel, the company will secure key-person disability insurance on Dr. Stone, with coverage sized to offset operational disruption and debt obligations during any extended absence.
Staffing Plan
| Position | Type | Start Date |
| Lab Technicians (2) | Full-time | Month 4 |
| Receptionist | Part-time, 25 hrs/week | Month 4 |
| Lab Assistant | Part-time, 30 hrs/week | Year 2 |
| Lab Technician #3 | Full-time | Year 3 |
Additional hires in Years 2 and 3 correspond to the volume increase from 63 to 90 to 110 tests/day.
Compensation
| Position | Year 1 | Year 2 | Year 3 |
| Dr. Emily Stone | $48,000 | $110,000 | $120,000 |
| John Richards | $48,000 | $95,000 | $105,000 |
| Lab Technicians (2) | $82,500 (9 mo.) | $110,000 | $110,000 |
| Receptionist (PT) | $17,550 (9 mo.) | $23,400 | $23,400 |
| Lab Assistant (PT) | — | $31,200 | $31,200 |
| Lab Technician #3 | — | — | $57,000 |
| Payroll taxes & benefits (18%) | $35,289 | $66,528 | $80,388 |
| Total staffing cost | $231,339 | $436,128 | $526,988 |
Both owners take reduced salaries in Year 1 to protect cash flow while the lab operates below break-even volume. Full compensation restores in Year 2 when revenue supports it.
Financial Plan
Startup Costs & Use of Funds
Total startup capital is $650,000, funded by a $500,000 PNC Bank SBA Term Loan and $150,000 in owner equity. Loan proceeds cover equipment and supplies. Owner equity funds, working capital, and licensing.
| Category | Cost |
| REFUNDABLE DEPOSITS | |
| Lease security deposit | $15,000 |
| Subtotal—Refundable Deposits | $15,000 |
| CAPITALIZED ASSETS | |
| Lab equipment & testing systems | $250,000 |
| Office equipment & IT setup | $20,000 |
| Subtotal—Capitalized Assets | $270,000 |
| PREPAID EXPENSES | |
| Prepaid rent (first & last month) | $15,000 |
| Insurance premiums (annual prepaid) | $10,000 |
| Licensing & permits | $15,000 |
| Pre-launch marketing & outreach | $10,000 |
| Subtotal—Prepaid Expenses | $50,000 |
| CURRENT ASSETS (INVENTORY) | |
| Initial medical supplies & test kits | $50,000 |
| Subtotal—Inventory | $50,000 |
| CASH RESERVE | |
| Working capital reserve (opening cash) | $265,000 |
| Subtotal—Cash Reserve | $265,000 |
| TOTAL USE OF FUNDS | $650,000 |
3-Year P&L Summary
| Line Item | Year 1 | Year 2 | Year 3 |
| REVENUE | |||
| Diagnostic Test Revenue | $762,000 | $1,440,000 | $1,815,000 |
| Total Revenue | $762,000 | $1,440,000 | $1,815,000 |
| COST OF GOODS SOLD | |||
| Lab Supplies, Reagents & Test Kits | $214,200 | $405,000 | $481,250 |
| Total COGS | $214,200 | $405,000 | $481,250 |
| GROSS PROFIT | $547,800 | $1,035,000 | $1,333,750 |
| Gross Margin % | 71.9% | 71.9% | 73.5% |
| OPERATING EXPENSES | |||
| Dr. Emily Stone—Salary | $48,000 | $110,000 | $120,000 |
| John Richards—Salary | $48,000 | $95,000 | $105,000 |
| Lab Technicians (2 FT) | $82,500 | $110,000 | $110,000 |
| Part-Time Receptionist | $17,550 | $23,400 | $23,400 |
| Additional Lab Assistant (PT, Y2+) | $0 | $31,200 | $31,200 |
| Additional Lab Technician (FT, Y3) | $0 | $0 | $57,000 |
| Payroll Taxes & Benefits (18%) | $35,289 | $66,528 | $80,388 |
| Total Staffing Costs | $231,339 | $436,128 | $526,988 |
| Rent | $70,000 | $72,100 | $74,263 |
| Insurance | $14,000 | $14,000 | $14,500 |
| LIMS Software | $18,000 | $18,000 | $18,540 |
| Billing/Practice Management Software | $6,000 | $6,000 | $6,180 |
| IT & Data Security (HIPAA) | $8,000 | $8,000 | $8,240 |
| Accounting & Legal | $8,000 | $8,000 | $8,240 |
| Telephone & Internet | $4,800 | $4,800 | $4,944 |
| CLIA Certification & Compliance | $5,000 | $5,000 | $5,150 |
| Marketing & Outreach | $20,000 | $24,000 | $18,000 |
| Utilities | $9,600 | $9,888 | $10,185 |
| Specimen Transport & Waste Disposal | $17,850 | $33,750 | $41,250 |
| Office Supplies & Miscellaneous | $6,000 | $6,000 | $6,180 |
| Licensing & Permits | $15,000 | $5,000 | $5,000 |
| Total Other Operating Expenses | $202,250 | $214,538 | $220,672 |
| Total Operating Expenses | $433,589 | $650,666 | $747,660 |
| EBITDA | $114,211 | $384,334 | $586,090 |
| Depreciation—Lab Equipment | $26,786 | $35,714 | $35,714 |
| Depreciation—Office Equipment | $3,000 | $4,000 | $4,000 |
| Depreciation—Y2 Growth Capex | $0 | $2,143 | $2,143 |
| Depreciation—Y3 Growth Capex | $0 | $0 | $1,429 |
| Total Depreciation | $29,786 | $41,857 | $43,286 |
| EBIT (Operating Income) | $84,425 | $342,477 | $542,804 |
| Interest Expense | $36,420 | $31,614 | $27,100 |
| NET INCOME (Pre-Tax) | $48,005 | $310,863 | $515,704 |
Cash Flow Statement (3 Years)
| Line Item | Year 1 | Year 2 | Year 3 |
| CASH FROM OPERATIONS | |||
| Net Income | $48,005 | $310,863 | $515,704 |
| Add back: Depreciation | $29,786 | $41,857 | $43,286 |
| Working Capital Changes: | |||
| (Increase)/Decrease in Accounts Receivable | ($93,863) | ($83,671) | ($46,192) |
| (Increase)/Decrease in Inventory | $41,762 | ($7,339) | ($2,933) |
| (Increase)/Decrease in Prepaid Expenses | $50,000 | $0 | $0 |
| Increase/(Decrease) in Accounts Payable | $17,611 | $15,677 | $6,267 |
| Net Working Capital Change | ($15,510) | ($75,333) | ($42,858) |
| Cash from Operations | $93,301 | $277,387 | $516,132 |
| CASH FROM INVESTING | |||
| Lab Equipment | ($250,000) | $0 | $0 |
| Office Equipment & IT | ($20,000) | $0 | $0 |
| Lease Deposit | ($15,000) | $0 | $0 |
| Initial Inventory (startup) | ($50,000) | $0 | $0 |
| Initial Prepaid Expenses (startup) | ($50,000) | $0 | $0 |
| Growth Capex | $0 | ($15,000) | ($10,000) |
| Cash from Investing | ($385,000) | ($15,000) | ($10,000) |
| CASH FROM FINANCING | |||
| Loan Proceeds | $500,000 | $0 | $0 |
| Owner Equity Contributions | $150,000 | $0 | $0 |
| Loan Principal Repayments | ($43,668) | ($62,670) | ($67,184) |
| Owner Distributions | $0 | $0 | $0 |
| Cash from Financing | $606,332 | ($62,670) | ($67,184) |
| NET CHANGE IN CASH | $314,633 | $199,717 | $438,948 |
| Beginning Cash | $0 | $314,633 | $514,350 |
| Ending Cash | $314,633 | $514,350 | $953,298 |
Balance Sheet (3 Years)
| Line Item | Day 0 | Year 1 | Year 2 | Year 3 |
| CURRENT ASSETS | ||||
| Cash | $265,000 | $314,633 | $514,350 | $953,298 |
| Accounts Receivable | $0 | $93,863 | $177,534 | $223,726 |
| Inventory | $50,000 | $8,238 | $15,577 | $18,510 |
| Prepaid Expenses | $50,000 | $0 | $0 | $0 |
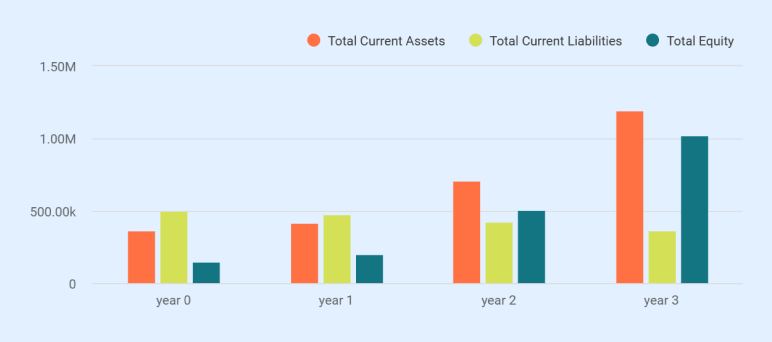
| Total Current Assets | $365,000 | $416,734 | $707,461 | $1,195,534 |
| NON-CURRENT ASSETS | ||||
| Lease Deposit (refundable) | $15,000 | $15,000 | $15,000 | $15,000 |
| Gross Fixed Assets—Lab Equipment | $250,000 | $250,000 | $250,000 | $250,000 |
| Gross Fixed Assets—Office Equipment/IT | $20,000 | $20,000 | $20,000 | $20,000 |
| Gross Fixed Assets—Growth Capex | $0 | $0 | $15,000 | $25,000 |
| Gross Fixed Assets (Total) | $270,000 | $270,000 | $285,000 | $295,000 |
| Less: Accumulated Depreciation | $0 | ($29,786) | ($71,643) | ($114,929) |
| Net Fixed Assets | $270,000 | $240,214 | $213,357 | $180,071 |
| Total Non-Current Assets | $285,000 | $255,214 | $228,357 | $195,071 |
| TOTAL ASSETS | $650,000 | $671,948 | $935,818 | $1,390,605 |
| CURRENT LIABILITIES | ||||
| Accounts Payable | $0 | $17,611 | $33,288 | $39,555 |
| Current Portion of Loan | $37,555 | $62,670 | $67,184 | $72,036 |
| Total Current Liabilities | $37,555 | $80,281 | $100,472 | $111,591 |
| LONG-TERM LIABILITIES | ||||
| Long-Term Loan | $462,445 | $393,662 | $326,478 | $254,442 |
| Total Long-Term Liabilities | $462,445 | $393,662 | $326,478 | $254,442 |
| TOTAL LIABILITIES | $500,000 | $473,943 | $426,950 | $366,033 |
| EQUITY | ||||
| Contributed Capital | $150,000 | $150,000 | $150,000 | $150,000 |
| Retained Earnings | $0 | $48,005 | $358,868 | $874,572 |
| Total Equity | $150,000 | $198,005 | $508,868 | $1,024,572 |
| TOTAL LIABILITIES + EQUITY | $650,000 | $671,948 | $935,818 | $1,390,605 |
Spreadsheets are exhausting & time-consuming
Build accurate financial projections w/ AI-assisted features

Break-Even Analysis
| Metric | Value |
| Total Monthly Fixed Costs (at Year 2 levels) | $57,532 |
| Variable Cost per Test | $19.50 |
| Net Revenue per Test | $64.00 |
| Contribution Margin per Test | $44.50 |
| Contribution Margin % | 69.5% |
| Monthly Break-Even Revenue | $82,780 |
| Annual Break-Even Revenue | $993,360 |
| Break-Even Tests per Day | 62 |
| Break-Even Tests per Year | 15,521 |
| Year 1 Revenue vs Break-Even | $762,000 vs $993,360—below (reduced owner pay offsets) |
| Year 2 Revenue vs Break-Even | $1,440,000 vs $993,360—above by $446,640 |
| Year 3 Revenue vs Break-Even | $1,815,000 vs $993,360—above by $821,640 |
| Primary Break-Even Driver | Daily test utilization exceeding 62 tests/day at full cost structure |
Loan Amortization Summary
| Period | Opening Balance | Principal Paid | Interest Paid | Total Payments | Closing Balance |
| Year 1 (3 mo IO + 9 mo amort) | $500,000 | $43,668 | $36,420 | $80,088 | $456,332 |
| Year 2 (12 mo amort) | $456,332 | $62,670 | $31,614 | $94,284 | $393,662 |
| Year 3 (12 mo amort) | $393,662 | $67,184 | $27,100 | $94,284 | $326,478 |
| Year 4 | $326,478 | $72,036 | $22,248 | $94,284 | $254,442 |
| Year 5 | $254,442 | $77,249 | $17,035 | $94,284 | $177,193 |
| Year 6 | $177,193 | $82,842 | $11,442 | $94,284 | $94,351 |
| Year 7 (final) | $94,351 | $94,351 | $5,349 | $99,700 | $0 |
| Loan Detail | Value |
| Loan amount | $500,000 |
| Interest rate | 7.50% fixed |
| Term | 7 years (84 months) |
| Interest-only period | Months 1–3 ($3,125/month) |
| Monthly payment (Months 4–84) | $7,857 |
| Total interest over the life of the loan | ~$151,208 |
| Total payments over the life of the loan | ~$651,208 |
Milestones & Risk Assessment
Launch Timeline
| Period | Milestones |
| Month 1 | Entity formation complete; CLIA and state lab license applications submitted; lease signed; equipment ordered |
| Month 2 | LIMS and billing software installed; HIPAA infrastructure in place; technician recruitment begins |
| Month 3 | Equipment delivered and installed; staff hired and trained; physician outreach begins |
| Month 4 | CLIA certification anticipated; soft launch; first specimens processed |
| Month 5–6 | First insurance claims submitted; additional referring accounts signed |
| Month 7 | Full operational status; daily volume reviewed against projections |
| Month 8+ | The break-even target of 62 tests per day is expected to be reached |
Risk Assessment
Regulatory delay is the highest-stakes risk. If CLIA certification or state licensure is not received before Month 4, the lab cannot process specimens. Applications are prepared with professional compliance guidance, included in the licensing and regulatory expense categories. Both applications are submitted in Month 1 to allow maximum processing time.
Slow referral ramp is the second risk. The model requires signed physician accounts before the soft launch. If outreach in Month 3 does not produce committed referrals, launch-day volume falls short. John Richards dedicates the majority of his time to physician outreach during Months 3 and 4. Selective introductory pricing may be offered to early accounts to reduce the trial barrier.
Equipment delay is a background risk. Analyzers and centrifuges carry lead times of four to eight weeks. Ordering in Month 1 provides buffer before the Month 4 launch. Vendor service contracts and warranty agreements are in place at delivery.
The Quickest Way to turn a Business Idea into a Business Plan
Fill-in-the-blanks and automatic financials make it easy.
Upmetrics
Upmetrics is the #1 business planning software that helps entrepreneurs and business owners create investment-ready business plans using AI. We regularly share business planning insights on our blog. Check out the Upmetrics blog for such interesting reads. Read more