Most small business owners run a budget. The harder thing is keeping it useful once the year starts.
Sometimes the sales come in differently than expected, a vendor raises prices, or a customer pays late. By March or April, maybe the numbers in the budget don’t reflect the business you are actually running. The effort to update everything in a spreadsheet usually loses out to ten more urgent things on the list.
That’s what a forecast is for. It is the running view of what’s actually likely to happen, updated as the months go on. Both are useful, and they answer different questions.
The rest of this article covers what each one is, what they look like side by side for a small business, and a five-step process for running them together.
What is budgeting?
Budgeting simply involves coming up with specific financial goals that your business wants to achieve within a year and determining how you will use your business money to hit these goals. It responds to three questions:
- What do you think you will make?
- What will be your spending amount?
- What will be the disbursement of that money over all the areas of operations, marketing, staffing, and overhead?
An average small business budget will have estimated revenue, fixed costs, and a contingency against unforeseen costs. These put together a spending plan that restricts and compels trade-offs. For example, when the number of hires is greater, the marketing expenditure might have to be reduced unless the revenue can support both.
A majority of businesses prepare their annual budget at the end of the year, such that it is in line with the next financial cycle. After the year has started, they assess actual performance against the plan on a monthly or quarterly basis and make adjustments when the revenue is lower than expected or the costs are high.
A budget by itself is not the whole story, however. The distinction between budgeting and forecasting is a matter of confusion. The budget will provide you with a limit on how much you can spend, whereas the forecast lets you make adjustments before things get out of hand.
Short-term forecasts encompass the coming 1-3 months and will help you in managing the cash flow, expenses, and day-to-day decisions.
Long-term predictions are 1 to 5 years and are applied in making decisions like hiring, expansion, or raising funds.
What is forecasting?
Financial forecasting is projecting the way your business is likely to go regarding finances based on previous performance, current trends, and assumptions concerning the future. Even though a budget is a tangible plan, a forecast is what is likely to happen as things change.
Forecasts typically are computed on two time scales:
- Short-term forecasts encompass the coming 1-3 months and will help you in managing the cash flow, expenses, and day-to-day decisions.
- Long-term predictions are 1 to 5 years and are applied in making decisions like hiring, expansion, or raising funds.
The complete forecast consists of three parts, i.e., profit and loss, cash flow, and the balance sheet. Profit and loss show whether the business is profitable, cash flow shows whether the business is able to meet its liabilities, and the balance sheet shows the overall financial status of the business.
Forecasts draw in realities as they happen, reveal alterations in sales, expenditures, or outside circumstances instantly, and allow the company to adjust before the situation gets out of control.
This is the reason why budget forecasting is a complementary field. The plan is established by the budget, and the forecast follows the reality and assists in making subsequent decisions.
Budgeting vs forecasting at a glance
The budget sets the direction. The forecast measures the progress against that direction, and surfaces deviations early, so the business can adapt before problems escalate.
Here is the budget vs forecast at a glance:
| Budget | Forecast | |
| Purpose | Sets the financial targets that the business commits to | Estimates what is likely to happen based on current data |
| Time horizon | Fixed, typically 12 months | Rolling, updated monthly or quarterly |
| Granularity | Detailed, broken down by department and cost categories | Flexible, focused on key drivers, but can be detailed |
| Updated | Once a year, with minor adjustments | Continuously, as new data comes in |
| Who uses it | Founders, department heads, board | Founders, finance teams, investors |
| Output | Spending limits and revenue targets | Updated financial projections and scenarios |
| Core question | What do we plan to spend and earn? | Based on current performance, what is likely to happen next? |
The shortest way to think about it: your budget is what you wish would happen, and your forecast is what’s actually going to happen if nothing changes. The gap between the two is where every cash crisis, missed hire, and surprise tax bill belongs. Running both is how you spot that gap early enough to do something about it.
Why do you need both budgeting and forecasting?
Running just a budget or a forecast would either mean you’re ignoring reality or have nothing to measure it against, which is why you need both. The two of them are in a continuous cycle.
Although the plan is established at the beginning of the year by the budget, the actual results are presented month by month. The forecast will update the projection with the results of the forecast, and the variance analysis will indicate the exact point where performance is ahead or behind the original plan.
That data is used in the budget of the next year, which then begins the cycle once more with more precise data.
To illustrate this better, let’s go with this example:
The team projects a 2026 revenue target of $1.2M, and the hiring and marketing costs will be equal to the revenue target. At the end of Q1, the business has recorded a booking of 250K against the plan of 300K. Only the budget indicates that there will be a shortfall of 17 percent in Q1 and no further.
The forecast assumes the same data and forecasts the entire year at $1.05M rather than at 1.2M. The founder now has nine months to delay a hire, reduce ad spend, or push a launch forward, before that turns into a cash shortage.
That kind of early adjustment depends on having budget and forecast data that actually agree with each other, and that is where most small businesses struggle.
According to the 2025 AFP FP&A Benchmarking Survey, 96% of finance professionals still use spreadsheets for planning. When budget and forecast files are separate, the version differences result in incorrect decisions. Running both in one system keeps the numbers consistent, as each one also delivers benefits that the other cannot.
Keep your budget and forecast in one model

Benefits of budgeting and forecasting
Most owners run a budget because they have to and forecast because they should, but the real value of each shows up in specific moments during the year. The benefits below map to those moments.
Benefits of budgeting
- Aligns the team early. A budget forces every department head into the same conversation about revenue, headcount, and spending before the year begins.
- Creates a fixed spending cap. A signed-off budget gives the founder a clear reference point for evaluating mid-year resource requests.
- Surfaces cash gaps in advance. Running revenue and expenses month by month exposes shortfalls early enough to plan around them.
- Supports investor and lender conversations. Term sheets, SBA loan applications, and board reports all reference an annual budget.
- Sets the variance baseline. Without a fixed plan, there is no reference point to measure performance against.
Benefits of forecasting
- Detects changes earlier. A rolling forecast picks up shifts in revenue, costs, or demand sooner than quarterly results do.
- Updates the plan when reality diverges. When actuals move away from the original budget, the forecast adjusts the projection without waiting for year-end.
- Enables scenario planning. Modeling revenue cuts, hiring changes, or price moves becomes straightforward with a working forecast in place.
- Improves cash flow visibility. Short-term rolling forecasts surface funding gaps with enough lead time to act on them.
- Backs strategic decisions with data. Mid-year pivots, delays, and reallocations are easier to defend when an updated forecast supports them.
Examples of budgeting vs. forecasting
To make this concrete, here is what budgeting and forecasting look like for a small bakery, Sourdough & Co., heading into 2026. The bakery did $960K in revenue in 2025 with a single location, and the team has set a 25% growth target for 2026.
The 2026 budget
The owner develops the budget in November 2025, based on the actuals of last year and the growth target. The revenue is divided into in-store sales and a small wholesale account with two local cafes. The expenses are mapped to fixed costs (rent, payroll, software) and variable costs (ingredients, marketing), which change with revenue.
This is what the complete 2026 budget would appear like:
| Line item | 2026 budget |
| Revenue (in-store + wholesale) | $1,200,000 |
| Cost of goods sold (ingredients, packaging) | $360,000 |
| Payroll (5 staff + owner) | $420,000 |
| Rent and utilities | $96,000 |
| Marketing | $60,000 |
| Software and subscriptions | $12,000 |
| General and administrative | $48,000 |
| Total expenses | $996,000 |
| Operating income | $204,000 |
The budget assumes assumes 25% revenue growth, holds payroll and rent flat (no new hires until Q3), and scales COGS and marketing with revenue. If the year tracks the plan, the bakery clears $204K in operating income.
What changed by Q1?
Q1 2026 actuals come in at $250,000 in revenue, roughly 17% short of the $300,000 budget. In March, a heat wave slowed in-store traffic, and one of the wholesale cafes paused orders for renovations. The owner pulls together a Q1-adjusted forecast in early April.
The forecast reprices the remainder of the year based on actuals to Q1 and revised assumptions to Q2 to Q4. It is projected that in-store traffic will rebound in Q2, but not necessarily make up for the original plan.
The wholesale account remains frozen until Q2, and then it comes back to life in Q3. Marketing spend pulls back to match the lower revenue base, and the planned Q3 hire moves to Q4.
| Line item | Original budget | Updated forecast |
| Revenue | $1,200,000 | $1,050,000 |
| Cost of goods sold | $360,000 | $315,000 |
| Payroll | $420,000 | $405,000 |
| Rent and utilities | $96,000 | $96,000 |
| Marketing | $60,000 | $48,000 |
| Software and subscriptions | $12,000 | $12,000 |
| General and administrative | $48,000 | $48,000 |
| Total expenses | $996,000 | $924,000 |
| Operating income | $204,000 | $126,000 |
The revised projection reduces the amount of projected operating income by $78K, but the bakery remains profitable. More to the point, the owner noticed the vacancy gap in April as opposed to December, which left enough time to postpone the new hire and cut on the marketing without ruining the payroll and rent obligations.
Variance: where plan met reality
Once Q1 closes, the owner has actual numbers to compare against the original budget. That comparison is variance analysis, and it shows up as a side-by-side: what was planned, what happened, and the gap between them.
| Line item | Q1 plan | Q1 actual | Variance |
| Revenue | $300,000 | $250,000 | -16.7% |
| Cost of goods sold | $90,000 | $75,000 | -16.7% |
| Payroll | $105,000 | $105,000 | 0% |
| Rent and utilities | $24,000 | $24,000 | 0% |
| Marketing | $15,000 | $15,000 | 0% |
| Software | $3,000 | $3,000 | 0% |
| General and administrative | $12,000 | $12,000 | 0% |
| Total expenses | $249,000 | $234,000 | -6.0% |
| Operating income | $51,000 | $16,000 | -68.6% |
The Q1 revenue shortfall was 17%, but operating income came in 69% below plan. That gap (a small revenue miss producing a much larger operating income miss) is the most useful number an owner can pull from a variance report.
The reason it happens is that most expenses are fixed in the short term: payroll, rent, software, and G&A all hold steady in the table above, even when revenue falls. Only COGS moves with sales. So when revenue drops by $50,000, almost the full $50,000 falls to the bottom line, because the cost base did not shrink to meet it. Recognizing this ratio in your own business is what makes every later spending decision more disciplined.
How to do budgeting and forecasting in 5 steps
The full process below takes a small business owner about a weekend to set up at the start of the year, and an hour or two each month to keep running.
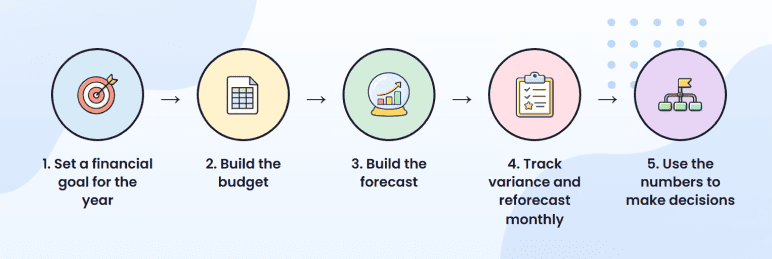
Step 1: Set a financial goal for the year
Start with one anchor: revenue, profit, or runway. It defines how the business operates for the year. Choosing revenue means accepting higher spending to grow faster. Choosing profit means holding costs flat even if the growth is slow. If you choose runway, it would mean protecting cash above everything else.
The common mistake is setting a number without linking it to drivers. A 30% growth goal only makes sense when there is a clear answer to where the growth comes from. More customers? Higher pricing? A new channel? Without that link, it’s just a goal.
Step 2: Build the budget
Convert the goal into a working plan, so your revenue should be built from drivers.
For a small bakery, that might be: average daily transactions × average order value × days open per month
For a SaaS business: new customers × average contract value × retention rate
The breakdown shows what has to happen each month to hit the target.
Expenses follow the same logic. Fixed costs stay constant. Variable costs scale with revenue. If a “fixed” cost actually moves with sales volume, the budget will mislead the team the moment revenue swings. The output is a plan where every assumption is visible, which makes it possible to see which ones are fragile and which will hold.
Step 3: build the forecast
The budget assumes the year unfolds as planned. The forecast removes that assumption. Take current performance and project it forward. If the plan called for $100K in the quarter and the run rate is closer to $80K, the forecast should extend that gap across the rest of the year, not split the difference and hope.
Add best case, most likely, and worst case scenarios to test sensitivity. If a 10% revenue dip creates a cash problem in the worst-case run, the issue is the structure of the business. A cash flow forecast tracks when money actually moves in and out, week by week.
Step 4: Track variance and reforecast monthly
Once the year starts, compare actual results to the budget every month. Do it at the driver level, not just on the totals. If revenue is down, the cause is more important than the number. Fewer customers, lower average order value, and reduced demand each lead to a different response.
When a variance pattern holds for two months in a row, update the forecast with new assumptions for the rest of the year. The original budget stays untouched and continues to serve as the baseline. The forecast moves with reality. This separation between fixed plan and moving forecast is what makes financial projections genuinely useful.
Step 5: Use the numbers to make decisions
The whole point of building both is to drive better decisions. Once variance and reforecasting are running, the numbers should change what you do. A widening revenue gap means slowing hiring or trimming discretionary spend. A favorable variance might make room to pull forward a planned investment or a hire.
Most owners stop short of this step because it is the hardest one. The math is straightforward. The discipline of acting on what the math tells you, especially when it means reversing a decision made three months earlier, is the part that separates businesses that survive a tough year from the ones that do not.
Download our free business plan template to lay out the full plan, including the budget and forecast structure, in one place.
Tips to improve budgets and forecasts
Most small businesses build a budget and forecast that look right on paper, then never act on what the numbers tell them. The six tips below are what close that gap.
1) Build the budget from drivers (not totals)
Do not start with a top-line revenue number and work backwards. Start with the inputs that actually produce revenue (customers, transactions, average order value, contract size) and let the totals fall out of those drivers. This makes every assumption visible, and it shows exactly which lever to pull when something needs to change.
2) Reforecast monthly, not quarterly
Quarterly reforecasting feels disciplined but acts late. By the time a Q1 review surfaces a problem in April, the team has already spent two months operating against stale numbers.
A monthly cadence catches drift while there is still time to react. According to AFP research, companies with accurate forecasting processes are 36% more likely to meet or exceed their financial targets.
3) Run three scenarios
A single-point forecast looks confident but tells you nothing about risk. Build a best case, a most likely, and a worst case. The gap between worst case and most likely is what tells you how much margin for error the business actually has, and whether a 10% revenue dip is uncomfortable or fatal.
4) Be conservative on revenue, thorough on expenses
Most first-year forecasts miss in the same direction. The founder runs hot on revenue because they’re optimistic, and small recurring costs like subscriptions, professional services, and payment fees slip through the cracks because no one’s tracking them in one place.
A safer move is to plan for revenue 10 to 15% below your gut number, and add a 5 to 10% buffer to expenses for what you forgot.
5) Compare actuals at the driver level
When variance shows up, don’t stop at “revenue was down 12%.” Look at what actually drove it. Were customers down? Was the average order value down? Did the churn spike? Each cause points to a different fix, and you can’t pick the right one until you know which driver is moving.
6) Keep the budget fixed and the forecast moving
The budget is the baseline. Do not overwrite it mid-year, even when reality moves. The forecast is what updates with actuals and revised assumptions. Without that separation, there is nothing left to measure performance against, which is what makes variance analysis worthless.
Strengthen your financial planning with Upmetrics
Spreadsheets work fine for simple budgets. But once you are running a real forecast, comparing scenarios, and pulling actuals every month to check variance, you need something built for the job.
Upmetrics takes the manual work out of it. The financial statements update as you change your assumptions, scenarios are part of the same model instead of separate files, and your QuickBooks or Xero data feeds in automatically.
If your forecast is starting to outgrow a spreadsheet, this is the easier way to run it.
The Quickest Way to turn a Business Idea into a Business Plan
Fill-in-the-blanks and automatic financials make it easy.
Frequently Asked Questions
What are the 4 types of budgets?
What are the 4 forecasting methods?
What comes first, budget or forecast?
What is the difference between a financial forecast and a financial projection?
What are the 5 steps of budgeting?
Upmetrics
Upmetrics is the #1 business planning software that helps entrepreneurs and business owners create investment-ready business plans using AI. We regularly share business planning insights on our blog. Check out the Upmetrics blog for such interesting reads. Read more