Nobody planned for ecommerce to take over this fast. But here we are.
Groceries. Furniture. Prescription medicine. Cars. You can get all of it without standing in a single line. That was not some grand strategy anyone drew up; it just kept getting more convenient until driving to a store started feeling like extra work. Brick and mortar is still trying to figure out its response to that.
2026 hits different. Your phone is basically a mall now. TikTok has a checkout button. So does Instagram. Pinterest too. Spot something, tap it, done. No browser, no searching, no friction. AI handles the rest on the backend; every major store has it sorting results, adjusting prices, deciding what lands in front of you.
This year, the data got specific. Device breakdowns, category winners, dropout points in the checkout flow, and where new growth is actually showing up. All of it is in here.
So, here are the ecommerce statistics you need to know about.
E-commerce Industry Statistics (Key Findings)
- $6.42 trillion was spent online globally in 2025. Heading to $6.88 trillion this year.
- Phone is now the primary shopping device. 60% of all global ecommerce runs through mobile.
- Seven in ten carts get abandoned. Most of the time, it is a shipping fee nobody warned them about.
- Amazon at 37.6% of the US ecommerce market. Shopify at 14%. Everyone else is splitting what is left.
- US social commerce just hit $100 billion for the first time. Growing at over 21% a year.
- More than half of US adults use a digital wallet. Under 30s are already at 73% and climbing.
- The average US data breach cost hit $10.22 million in 2025. An all-time high.
- AI ecommerce tools are growing at 30.6% annually. The stores using them are pulling away from those that are not.
- 81% of shoppers want brands to know them. Generic experiences are losing customers to brands that personalize.
Global ecommerce market statistics
The global ecommerce market did not just grow in 2025; it crossed a milestone. Here is what the numbers look like.
- Global ecommerce sales are expected to hit $6.88 trillion in 2026 (Source)
$6.42 trillion spent online in 2025. That is where we landed. This year, the forecast says $6.88 trillion, and in 2028 is looking at $7.89 trillion. Consistent. Compounding. No dip in sight.
- Ecommerce now makes up 20.5% of all retail sales (Source)
One in every five dollars spent on retail globally goes through an online transaction. By 2030, that share hits 23.7%. Back in 2015, it was 7.4%.
- 2.77 billion people shopped online in 2025 (Source)
That is 33.3% of the global population buying something online last year. One in three people on earth. The other two-thirds are still largely untapped.
- China leads, but the rest of the world is catching up (Source)
China is doing $3.45 trillion on its own. After that, the US is at $1.38 trillion, then the UK, Japan, South Korea, Germany, and India all sit in the $136 to $195 billion range. A lot of those markets are nowhere near their ceiling yet.
- 59% of global shoppers buy from retailers outside their home country (Source)
More than half of online shoppers worldwide buy from international retailers. 35% do it at least once a month. The global cross-border ecommerce market is expected to reach $4.81 trillion by 2032.
US ecommerce statistics
The US is the second-largest ecommerce market in the world, and it is not slowing down. Here is where things stand.
- The US ecommerce market is worth $1.38 trillion in 2026 (Source)
$1.38 trillion this year, projected to reach $2.28 trillion by 2031. Growing at a 10.53% CAGR. Consumer electronics lead all categories at 24.3% of the market. Food and beverages are the fastest-growing segment.
- Ecommerce made up 16.6% of all US retail sales last quarter (Source)
Q4 2025 came in at $316.1 billion in online sales alone. That is up 5.3% from Q4 2024. Total retail grew just 2.7% the same period. Ecommerce keeps outpacing everything around it.
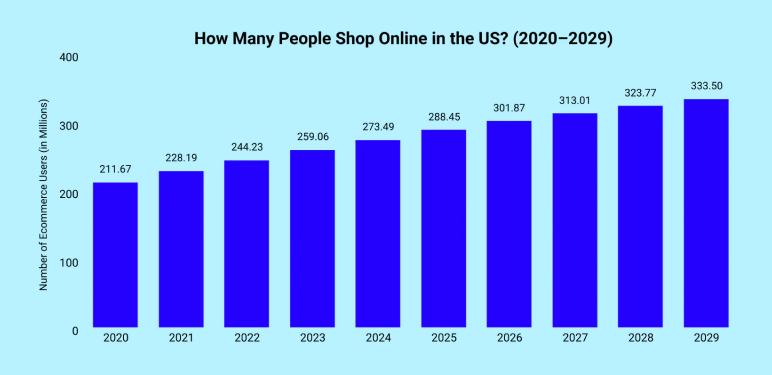
- Over 300 million Americans will shop online in 2026 (Source)
Back in 2020, that number was 211.67 million. By 2024, it hit 273 million, by 2025 it reached 288 million, and this year it crossed 300 million for the first time. Nearly the entire US population shops online now, and the growth has been steady every single year without exception.
- Amazon controls 37.6% of US ecommerce in 2026 (Source)
Amazon at 37.6%. Walmart at 6.4%. Then Apple, eBay, and Target are rounding out the top five. Shein has quietly grabbed 50% of the US fast fashion niche, and Temu is pulling over 503 million monthly visits. Third-party sellers make up 60% of Amazon’s GMV. The platform is not just a retailer; it is an entire ecosystem.
- The US ecommerce fulfillment market is growing at 14.1% annually (Source)
From 2025 to 2030, the US ecommerce fulfillment market grows 14.1% annually. Logistics and last-mile delivery are becoming as competitive as the storefronts themselves.
- BNPL growing at 17.6% CAGR through 2031 (Source)
Buy Now Pay Later is one of the fastest-growing payment methods in US ecommerce. Credit and debit cards still lead at 53.2% of transactions, but BNPL is eating into that share every year.
Online shopping behavior statistics
Knowing that ecommerce is growing is one thing. Understanding why people buy, and what stops them, is what actually helps you build a store that converts.
- 55% of Millennials and 48% of Gen Z shop online multiple times a week (Source)
Convenience and ingrained habit are the two drivers. Even Gen X at 39% and Boomers at 44% now shop online two to three times per week. Online shopping frequency is no longer a generational divide; it cuts across every age group.
- 76% of US adults buy things online using a smartphone (Source)
More Americans shop on their phone than on a desktop or laptop. Among adults under 50, that number jumps to 91%. If your store is not built for mobile first, you are already behind most of your potential customers.
- 75% of US consumers plan to trade down to some degree in their purchases (Source)
McKinsey found this across their 2025 ConsumerWise survey. Smaller pack sizes, cheaper retailers, fewer items. The hunt for deals is not a fringe behavior anymore; it is the dominant shopping mindset across every income group right now.
- 80% of Gen Z shoppers surveyed shopped at a wholesaler in the previous month (Source)
Discount and wholesale channels are pulling in younger shoppers at a rate most brands did not anticipate. Value is not just a low-income concern; it cuts across every age group and income level in 2025.
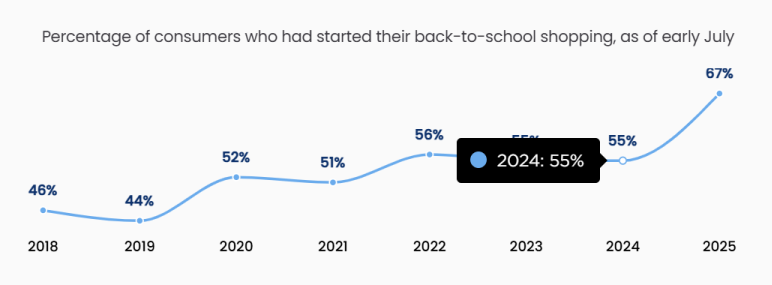
- 67% of US back-to-school shoppers had already begun purchasing items by July 2025, up from 55% in 2024 (Source)
The highest early shopping rate since NRF started tracking it in 2018. More than half of those shoppers started early specifically because of tariff and inflation concerns.
Mobile commerce statistics
A few years back, mobile was where people browsed. The desktop was where they actually bought it. That split no longer exists.
- Mobile commerce is projected to reach $2.4 trillion in 2026 (Source)
The desktop had its run. Mobile took over and kept going. The growth rate sits at 9.5% annually through 2034, and nothing on the horizon suggests it slows down.
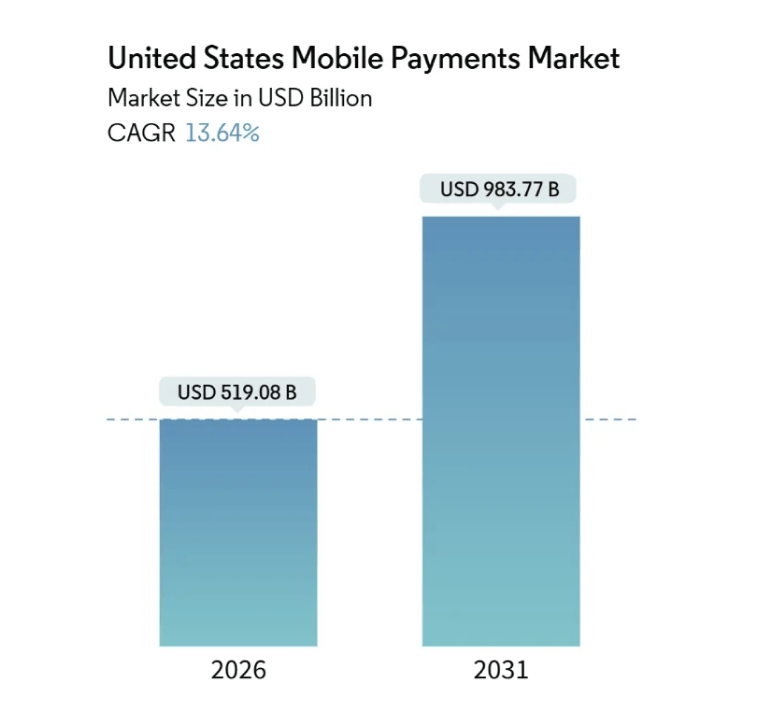
- The US mobile payments market hit $519 billion in 2026 (Source)
That number reaches $983 billion by 2031. Ecommerce made up 47.83% of that in 2025 alone. Shoppers today expect one tap checkout as a given, not a feature.
- 63% of all ecommerce traffic comes from mobile devices (Source)
Most of the journey, finding, comparing, and deciding, happens on a phone. The desktop is often just where people finish what the mobile already started.
- 91% of US adults own a smartphone (Source)
Back in 2011, that number was 35%. It took about a decade for smartphones to go from novelty to necessity. They are now the primary device most Americans use to access the internet, including shopping.
- Mobile devices will account for more than 50% of all US retail ecommerce sales by 2027, a year earlier than previously expected (Source)
US retail m-commerce is already projected to hit $724.81 billion in 2027 with a 9.4% growth rate that year. The shift is happening faster than forecasters predicted. Stores still treating mobile as a secondary channel are not just behind; they are building for a reality that no longer exists.
Social commerce statistics
Social media has always been where people discover products. Now it is where they buy them too, without ever leaving the app.
- US social commerce sales will surpass $100 billion in 2026 (Source)
That is up from $87 billion in 2025, which was already a 21.5% jump from the year before. Social commerce is no longer a side channel; it is becoming a core part of how Americans shop online.
- 1 in 2 US social media shoppers will make a purchase on TikTok in 2026 (Source)
Health, wellness, beauty, accessories, and fashion are the top categories. The average US shopper under 60 spent $708 on TikTok Shop in 2024. That is not impulse spending on cheap items; that is a real purchase channel with real average order values.
- TikTok Shop made up nearly 20% of all US social commerce in 2025 and is forecast to exceed $20 billion in sales in 2026 (Source)
It crossed $30 billion by 2028, according to current forecasts. Two years after launching in the US, it already influences how major retailers think about product mix, demand forecasting, and content strategy.
- Checkouts on Pinterest predict content increased 68% year over year in 2025 (Source)
Pinterest does not just predict trends; it drives purchases off the back of them. Brands that align their products with Pinterest trend forecasts are seeing direct checkout lifts, not just impressions.
- Platforms perceived as positive drive up to 94% more purchase intent (Source)
This matters more than most marketers realize. The environment your ad appears in shapes how people respond to it. Pinterest’s research shows that brands advertising in positive platform environments generate up to 24% more sales with the same budget and same creative.
Ecommerce marketing statistics
Marketing in ecommerce right now is a different game than it was three years ago: more brands, more channels, more noise. The ones winning are not necessarily spending more. They just understand their customer better. Here is what the data says.
- 70% of shoppers say they feel overwhelmed or uncertain when shopping online, and 21% give up on purchasing completely (source)
When overwhelmed, 62% keep browsing, 61% look for reviews, and 38% postpone the purchase entirely. Personalization is not about making shopping feel fancy. It is about reducing that noise and keeping people moving toward checkout.
- 48% of Gen Z shoppers prefer to learn about a product through short-form video (Source)
TikTok, Reels, YouTube Shorts. 40% of Gen Z discovered a new product on social media in the last three months. If your marketing does not include short videos, you are invisible to the fastest-growing spending demographic online.
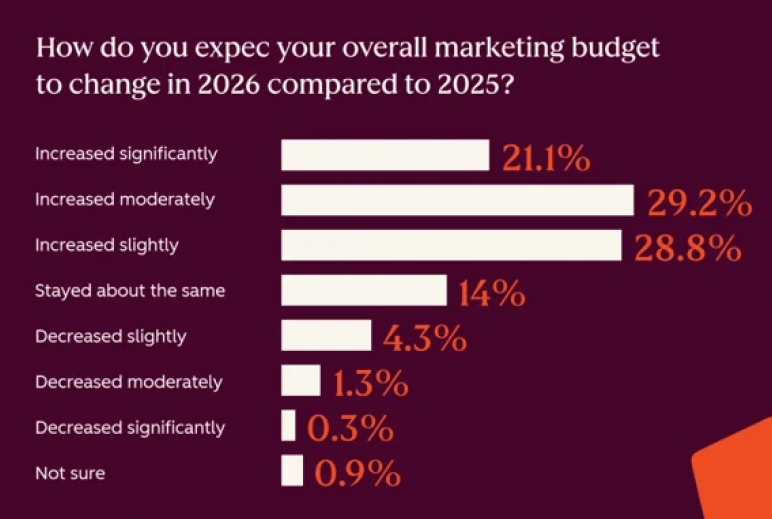
- 79.2% of marketing teams expect budget increases in 2026 (Source)
Budgets are coming back after a period of cuts. The catch is 73% say their budget now receives more scrutiny than before. Every channel needs to prove return, not just reach.
- 82% of consumers prefer to buy from brands that share their values (Source)
For a growing number of shoppers, especially younger ones, brand values are part of the purchase decision. Authenticity is no longer a soft metric; it is a conversion driver.
Top ecommerce platforms and marketplaces
Where you sell matters as much as what you sell. Here is how the US platform landscape looks right now.
- Amazon holds 37.6% of US ecommerce, Shopify is second at 14% (Source)
Two platforms account for more than half the market between them. Walmart sits at 6.4%, Apple at 3.6%, eBay at 3.0%, and Target at 1.9%. Everyone else is competing for what remains.
- Shopify powers 12% of US ecommerce and has served 875 million shoppers (Source)
Over $1.4 trillion in total sales through the platform. Someone makes their first sale on Shopify every 26 seconds. For brands that want to own their customer relationship rather than pay Amazon for access to theirs, it is the default choice.
- Shopify merchants generated a record $14.6 billion in Black Friday Cyber Monday sales in 2025, up 27% from 2024 (Source)
81 million consumers worldwide bought from Shopify-powered brands that weekend alone. Over 94,900 merchants had their single-highest-selling day ever. Peak sales hit $5.1 million per minute at 12:01 PM EST on Black Friday.
| Platform | Amazon | Shopify | Walmart | Apple | eBay | Target | Others |
|---|---|---|---|---|---|---|---|
| US Market Share | 37.6% | 14% | 6.4% | 3.6% | 3.0% | 1.9% | 33.5% |
Cart abandonment and ecommerce conversion statistics
Most shoppers never make it to the end. They browse, they add things, and then they leave. Here is where the sales actually go missing and what the data says about getting them back.
- The average cart abandonment rate sits at 70% in 2025 (Source)
Seven in ten leave before paying. Some were never going to buy. But a good portion had real intent, and something stopped them. That is the gap where revenue is hiding.
- A one-second delay in page load time reduces conversions by 7% (Source)
Pages that load in under two seconds convert the best. 70% of shoppers say speed directly influences whether they buy. It is not a technical problem; it is a revenue problem.
- 39% of shoppers abandon because of unexpected extra costs at checkout (Source)
Shipping fees showing up late in the checkout is the single biggest trigger. Show the full cost earlier in the journey, and a meaningful chunk of that abandonment disappears.
- A better checkout design alone can recover $260 billion in lost orders (Source)
That revenue is not lost to competitors. It is sitting inside checkout flows that are too slow or too complicated for people who already want to buy.
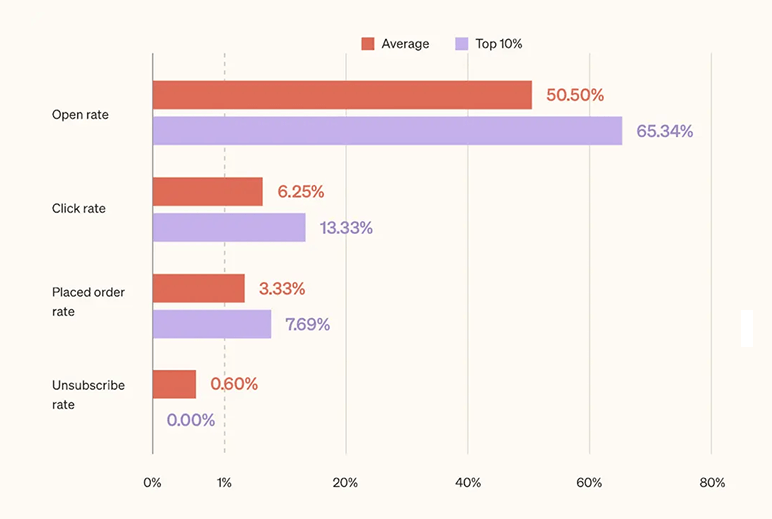
- Abandoned cart email sequences have a 50.5% average open rate and recover 3.33% of lost sales, with top-performing stores hitting 7.69% conversion (source)
Nearly 4 in 10 shoppers who click an abandoned cart email complete their purchase.
Ecommerce payment statistics
Online payments have changed faster in the last three years than in the decade before. Digital wallets, BNPL, instant transfers. Here is where things actually stand in 2026.
- There are 4.3 billion digital wallet users globally, projected to reach 5.8 billion by 2029, a 35% increase (source)
In the US, 64% of Americans use digital wallets just as frequently as cash or conventional cards, and 53% now prefer them outright. By 2030, digital wallets are expected to make up more than 52% of all ecommerce transaction value globally.
- The digital wallet market is growing from $56.77 billion in 2025 to $68.02 billion in 2026 (Source)
19.8% CAGR. Smartphones everywhere, ecommerce growing, people avoiding cash. All three are pushing in the same direction at the same time. The money is moving away from physical cards, whether traditional banks like it or not.
- US online shoppers are 27% more likely to use credit cards than debit cards, and twice as likely to use digital wallets online versus in-store (Source)
How people pay online and how they pay in store are two completely different behaviors. Debit wins at the register. Online, it is credit cards and digital wallets. Stores not supporting wallet checkout at this point are losing completions they should be winning.
Ecommerce security statistics
More transactions online mean more opportunities for fraud. Security is not just an IT problem anymore; it is a direct business cost. Here is what the numbers look like.
- The average cost of a data breach in the US hit a record $10.22 million in 2025, up 9% from the year before (Source)
The global average fell 9%, though the US bucked the trend with a 9% increase.
- 68% of US debit card owners would pay $1 extra per month for enhanced fraud protection (Source)
60% would pay $2 per month. Even credit card holders, who are less liable for fraud, came in at 54% willing to pay extra. Consumers are not just aware of card fraud; they are worried enough to spend money on preventing it. Stores that communicate their security measures clearly have a real conversion advantage over those that say nothing.
- AI-driven attacks now account for 1 in 6 data breaches (Source)
Generative AI cut the time to craft a convincing phishing email from 16 hours down to five minutes. The average window between a breach starting and being discovered is still 241 days. Most stores have no idea they have been hit until the damage is done.
AI in ecommerce statistics
AI is already running in the background of the most successful online stores. Product recommendations, dynamic pricing, fraud detection, and customer service. Here is what the data shows.
- The AI in ecommerce market is growing at 30.6% annually and is projected to reach $3.49 trillion by 2033 (Source)
It was valued at $390.91 billion across all industries in 2025. North America holds the largest share at 35.5%. The investment is not slowing down; it is accelerating every year as more retailers see direct revenue impact from AI-driven tools.
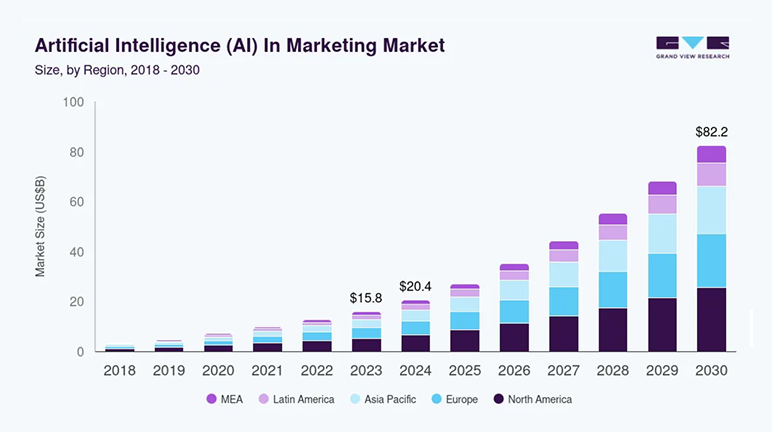
- AI in marketing is growing from $26.99 billion in 2025 to $82.23 billion by 2030 (Source)
25% CAGR. Personalized campaigns, predictive analytics, content creation, and customer segmentation. All of it is being rebuilt around AI. The brands doing it now are not just ahead; they are making it harder for everyone else to catch up.
- AI-powered next best experience capability can increase revenue by 5 to 8%, enhance customer satisfaction by 15 to 20%, and reduce cost to serve by 20 to 30% (source)
Those three numbers together tell the full story. AI in ecommerce is not just a marketing tool. It cuts costs, improves the customer experience, and grows revenue at the same time. The stores that deploy it well are pulling ahead on all three metrics simultaneously.
B2B ecommerce statistics
B2B ecommerce has grown quietly but aggressively over the past few years. It’s no longer just manufacturers and wholesalers experimenting online; it’s now a core sales channel, with businesses expecting the same speed and convenience they get as consumers.
- The global B2B ecommerce market is projected to reach $57.58 trillion by 2030, growing at 18.2% annually (source)
It was valued at $18.67 trillion in 2023. North America holds around 40% of that market. Manufacturing, healthcare, retail, and construction are the sectors driving the fastest adoption of digital procurement platforms right now.
- 73% of all US B2B buyers are now Millennials, and 68% of them prefer self-service research tools over speaking to a sales rep (source)
LinkedIn’s 2025 B2B Buyer Report found Millennials now make up nearly three-quarters of all B2B buyers and 44% of final purchasing decision makers. Salesforce found that most of them complete up to 70% of the buying process online before ever engaging a supplier.
- The global B2B ecommerce market was valued at $13.09 trillion in 2025 and is projected to reach $42.80 trillion by 2032, growing at 18.43% annually (source)
That growth rate is nearly double what most consumer ecommerce markets are delivering right now.
Ecommerce shipping and delivery statistics
Shipping is no longer a back-office logistics decision. It is a front-end conversion decision. What you charge, how fast you deliver, and how easy you make returns directly determine whether someone clicks buy or closes the tab.
- 94% of US shoppers prioritize cost savings when shopping online, with free shipping ranking as the top purchase driver (source)
Free shipping, discounts, and free returns are the three factors driving purchase decisions above everything else. Scheduled delivery nearly doubled in importance compared to fast delivery.
- 76% of US consumers say free shipping is near the top of their list when deciding where to shop (source)
Additional costs at checkout account for nearly 70% of cart abandonment. Free shipping does not just reduce abandonment. It actively increases average order value because shoppers add more items to hit the threshold.
- US retailers estimate 15.8% of their annual sales will be returned in 2025, totaling $849.9 billion (source)
Return fraud accounts for 9% of all returns. Easy returns drive purchases up front, but the back-end cost is one of the most underestimated line items in ecommerce financial planning.
What these ecommerce statistics mean for your business plan
Statistics are only useful if you know what to do with them. Here is how to translate the biggest ecommerce numbers into specific sections of your business plan.
Market analysis section
Start with the global picture: $6.42 trillion in ecommerce sales in 2025, then narrow it down. The US market is at $1.38 trillion, growing at 10.53% CAGR. Then go further into your specific product category and your niche. Investors want to see you size your actual opportunity, not the entire internet economy.
Target market section
2.77 billion people shop online globally, and 310 million Americans will do it this year. But your customer is not all of them. Use behavioral data to get specific. Gen Z and Millennials drive the majority of social commerce purchases. Build your ideal customer profile around data points, not just age ranges.
Marketing plan section
Mobile accounts for 63% of all global ecommerce traffic, which means mobile-first design is not optional. Social commerce is a $100 billion market in the US this year, growing over 20% annually. Every channel you pick should have a stat behind it.
Financial projections section
The industry average conversion rate is 1% to 4%. Cart abandonment sits at 70%. If your projections do not account for both, your model is wrong before you finish it. Build these into your revenue assumptions from day one.
Operations section
76% of consumers say free shipping influences their purchase decision. Shipping economics need to be in your cost structure from day one, not added later when margins get tight. Your fulfillment strategy is a conversion decision, not just an ops detail.
If you are building an ecommerce business plan, Upmetrics has a dedicated ecommerce business plan template that includes a pre-built market analysis, financial projections, and marketing plan, all structured specifically for online retail businesses.
Conclusion
The numbers make one thing clear. Ecommerce is not a trend that is still finding its footing. It is how a growing portion of the world shops, pays, and discovers products.
The market crossed $6.42 trillion in 2025. Mobile drives more than half of all purchases. Social platforms are closing sales without anyone opening a browser. AI is running in the background of every major store.
The opportunity is real, but so is the competition. The stores winning right now are not just the ones with the best products. They are the ones who understand their numbers and build around them.
The data in this article gives you the foundation. What you do with it is the part that actually matters.
If you are ready to take the next step, start with a solid plan. Upmetrics has a dedicated ecommerce business plan template built specifically for online retail businesses.
Frequently Asked Questions
How big is the global ecommerce market in 2026?
What is the average cart abandonment rate?
What percentage of ecommerce sales come from mobile devices?
What is the average ecommerce conversion rate?
Which country has the largest ecommerce market?

Riya Shah
Riya Shah is a skilled content writer experienced in various areas of writing, currently working with Upmetrics. Fascination with reading led her to be a writer. Highly creative, focused, imaginative, and passionate. Read more