


 Download Now: Financial Statements Template
Financial forecasting gets difficult when you have to estimate numbers for something that hasn’t happened yet, whether that’s next year’s revenue, monthly expenses, cash flow, or profit.
But the real challenge is deciding what those numbers should be based on. Past performance? Expected customers? Pricing and capacity? Or market demand? And what if your business is new and has no historical data?
That’s where choosing the right forecasting method matters. Some methods rely on past financial data, while others work better with assumptions, research, or limited operating history.
In this guide, I’ll explain the common financial forecasting methods, how each one works, and what exactly fits your business.
Financial forecasting methods at a glance
Financial forecasting methods are different ways of estimating future financial results based on the information you have available.
Most financial forecasting techniques draw mainly on one of two broad approaches.
- Quantitative forecasting uses numerical data and measurable patterns, usually from past business performance.
- Qualitative forecasting uses research, experience, expert input, and other evidence when historical numbers are limited or cannot tell the whole story.
These are broad approaches, not two individual forecasting methods. The specific techniques below use these approaches in different ways.
Here are the seven common techniques covered in this guide and what each one actually helps you do.
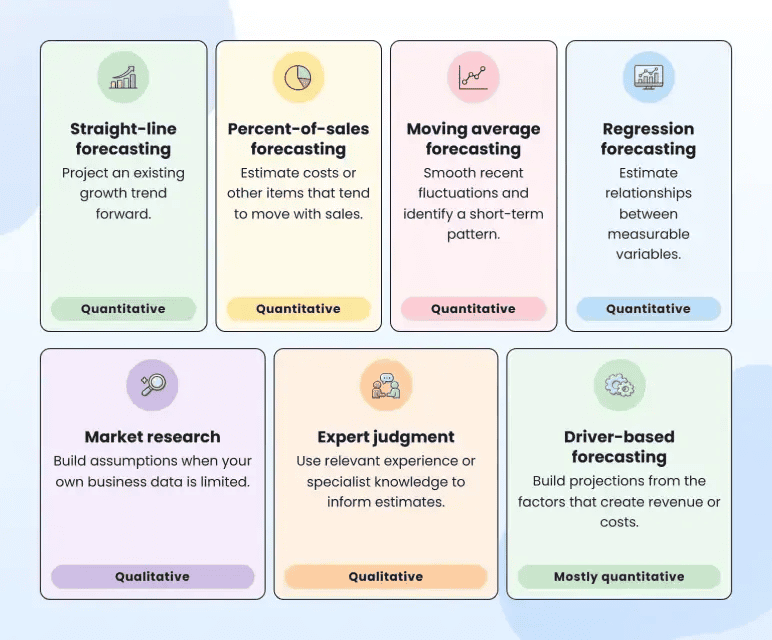
Now, let’s get into them.
7 common financial forecasting methods
You don’t need to use every method below, or rely on just one for your entire forecast. Different parts of the forecast may need different methods depending on what you’re estimating and the information you have.
For each method, I’ll explain how it works, show a practical example, and point out when it is useful and when it may not be the right fit.
Straight-line forecasting
Straight-line forecasting uses a past growth rate to estimate what could happen if that same rate continues.
For example, a residential cleaning business has been operating for several years. Last year, it earned $240,000 in revenue, and revenue has been growing by about 8% a year.
To apply that growth rate, convert 8% into decimal form and add it to 1:
1 + 0.08 = 1.08
Then multiply last year’s revenue by 1.08:
$240,000 × 1.08 = $259,200
So, if that growth rate continues, the business would forecast $259,200 in revenue next year.
The calculation is simple. But the more important question is whether that 8% growth rate is still realistic for the year ahead.
Straight-line forecasting works best when the business has a fairly stable history and no major change is likely to affect growth.
Suppose the cleaning business is already close to capacity; it may need more cleaners before sales can grow further. A major price change, lost customer, or expansion into a new area could also make the old growth rate less reliable.
I’d suggest you use the straight-line estimate as a reference point. If something important is changing, adjust the assumptions rather than carrying the old growth rate forward automatically.
Percent-of-sales forecasting
Percent-of-sales forecasting estimates a cost or other financial item as a percentage of expected sales.
Let’s say the cleaning business usually spends about 6% of its revenue on cleaning supplies. If next year’s revenue is forecast at $259,200, you can estimate the supply cost using that same percentage.
Then the revenue forecast is:
$259,200 × 6% = $15,552
So, the business could forecast about $15,552 in cleaning supply costs for the year.
This method is useful when a cost has a fairly consistent relationship with sales.
For a service business, that might include supplies, payment processing fees, or sales commissions. For a product business, it could include packaging or shipping costs.
But you shouldn’t apply the same percentage to every expense. Rent, insurance, and some salaries may stay fairly fixed even when sales change.
Rent, for example, may stay at $2,000 a month whether revenue rises by 5% or 15%. Applying the percent-of-sales method to a fixed expense like that would make the forecast less realistic.
A simple check I’d make before using this method is:
If sales increase, should this cost increase with them?
If yes, percent-of-sales forecasting may be a reasonable starting point. If not, I’d forecast that expense separately.
Moving average forecasting
Moving average forecasting uses results from a few recent periods to estimate what may happen next. It is useful when the numbers change from month to month, and you want a clearer view of the recent pattern.
Suppose the cleaning business completed:
- 92 jobs in June
- 104 jobs in July
- 98 jobs in August
To calculate a three-month moving average, add the three months together and divide by 3:
(92 + 104 + 98) ÷ 3 = 98 jobs
That gives the business a starting estimate of around 98 jobs for September.
Once September ends, the next calculation would use July, August, and September. The oldest month drops out as the newest one is added, which is why it is called a moving average.
This method is useful when recent sales or demand move up and down, but there is still a fairly consistent pattern underneath.
However, I’d say don’t rely on a simple moving average when the business has great seasonal changes. If the cleaning business is always much busier before the holidays, for example, averaging a few normal months could underestimate December demand.
Regression forecasting
Regression forecasting uses past data to see whether one business factor tends to move with another. You can then use that relationship to help estimate what may happen next.
Assume the cleaning business has tracked its qualified leads and booked jobs for the past two years. The data shows that, on average, every 10 additional qualified leads have been linked with about 3 more bookings.
If the business expects lead volume to increase next month, that relationship can help it estimate how bookings might change.
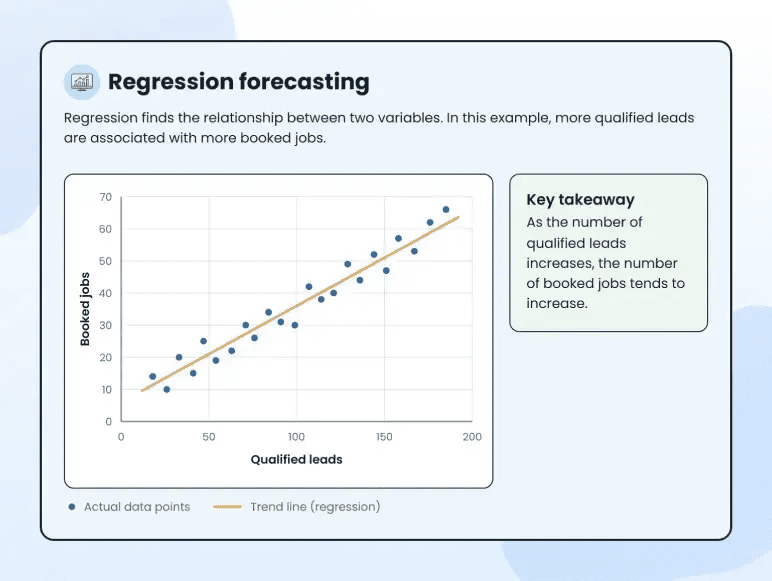
Regression can look at one factor or several factors at once.
In this example, the forecast looks at one factor, qualified leads, to estimate another, booked jobs. This is known as simple linear regression.
If the business wanted to consider several factors together, such as qualified leads, advertising spend, and pricing, it could use multiple linear regression instead.
Here’s one thing to note: regression makes the most sense when you have a specific relationship worth testing and enough reliable observations to support it.
Don’t use regression just because historical data is available. The relationship also needs to make sense for how the business actually works. If two numbers move together, that does not necessarily mean one caused the other.
Market research
Historical data is not always available, especially when you are forecasting a new business, location, product, or service. In those cases, market research can help you build more reasonable assumptions.
Let’s say the cleaning business is still new. The owner may not know how many jobs to expect each month yet, so they could look at things like:
- What similar services charge locally
- How much demand exists in the local area
- Which services customers are looking for
- Responses from customer interviews, inquiries, or early bookings
Suppose that research helps the owner settle on an average price of $170 per cleaning, while early interest suggests around 100 jobs per month may be a reasonable starting assumption.
That gives the owner inputs that can later be turned into a revenue forecast.
The important distinction is that market research does not produce the forecast by itself. It gives you better evidence for the assumptions behind it.
I’d generally put more weight on evidence that is close to the actual business. Local pricing, early customer interest, or real inquiries usually give you more to work with than a broad national industry average.
Expert judgment
Expert judgment uses the experience of people who understand the business, market, or particular assumption you are trying to estimate.
This is especially helpful when you do not yet have enough of your own data to answer an important forecasting question.
For example, a first-time cleaning business owner may not know how many jobs one cleaner can realistically complete in a day. Someone with experience running a similar business may be able to help estimate that based on job length, travel time, setup, and the type of service.
If the expert believes one cleaner can usually complete 2 jobs per day, the business can use that figure as an input when estimating capacity and revenue.
The key is to ask experts about specific assumptions, rather than asking them to predict the future.
For example:
- How many jobs can one cleaner reasonably complete per day?
- How much travel time should I allow between jobs?
- How quickly can a new employee reach normal capacity?
- Which costs usually increase as job volume grows?
These answers give you specific numbers or assumptions you can actually use in the forecast.
I recommend using expert judgment when an important assumption is difficult to estimate from your own data. But where possible, check that input against market research, industry data, or your early business results rather than relying on one opinion alone.
Driver-based forecasting
Market research and expert judgment can help you decide what assumptions are reasonable. Driver-based forecasting takes the next step by turning those assumptions into financial numbers.
Instead of starting with a total revenue figure, you identify the factors that actually create the result.
For a cleaning business, two obvious revenue drivers are:
Number of jobs × average price per job
If the business expects 100 jobs per month at an average price of $170:
100 × $170 = $17,000 monthly revenue
The value of this method shows what has to happen for the forecast to be achieved.
If the owner wants to forecast $20,400 in monthly revenue at the same $170 price:
$20,400 ÷ $170 = 120 jobs
Now there is a practical question: Can the business realistically win and complete 120 jobs?
The same logic works for expenses. If supplies cost roughly $10 per cleaning:
100 jobs × $10 = $1,000 in monthly supply costs
I find this method especially useful for new and growing businesses because it keeps the forecast tied to how the business actually operates.
In short, the methods above help you decide what information to use and how to estimate a future number.
But when you’re building a revenue forecast, there’s another choice to make: do you build the estimate from your individual sales and business activity, or start with the overall market?
That is where top-down and bottom-up forecasting come in.
Spreadsheets are exhausting & time-consuming
Build accurate financial projections with AI
Top-down vs. bottom-up forecasting
Both can help you estimate revenue, but they start from opposite ends.
Here’s the difference:
Top-down forecasting
A top-down forecast starts with the size of the overall market and estimates the share your business could realistically capture.
Suppose the local residential cleaning market is worth $10 million per year. If the business expects to capture 1%:
$10 million × 1% = $100,000 annual revenue
This gives you a broad revenue estimate, but the 1% still needs to be justified. The calculation does not tell you how many customers you need, whether you can reach them, or whether you have enough capacity to serve them.
For that reason, I ask people to mainly use a top-down forecast as a market-level check, rather than the only basis for the forecast.
Bottom-up forecasting
A bottom-up forecast starts with the customers, units, jobs, or sales the business expects and builds up the total from there.
Suppose the cleaning business expects 100 jobs per month at $170 each:
100 × $170 = $17,000 monthly revenue
Over a year:
$17,000 × 12 = $204,000 annual revenue
This makes it easier to see what the business actually needs to achieve to reach the forecast.
For the cleaning business, jobs and price are the revenue drivers. Using 100 jobs × $170 to build the revenue estimate is the bottom-up part.
Most small businesses need to focus on a bottom-up forecast when customer volume, pricing, and capacity can be estimated reasonably well.
Now that you know the main forecasting methods and where top-down and bottom-up fit, the next step is deciding which method makes the most sense for your situation.
How to choose the right financial forecasting method?
There is no single method that works best in every situation. The right choice depends mainly on what you are forecasting, what data you have, and how predictable that part of the business is.
Use this as a starting point:
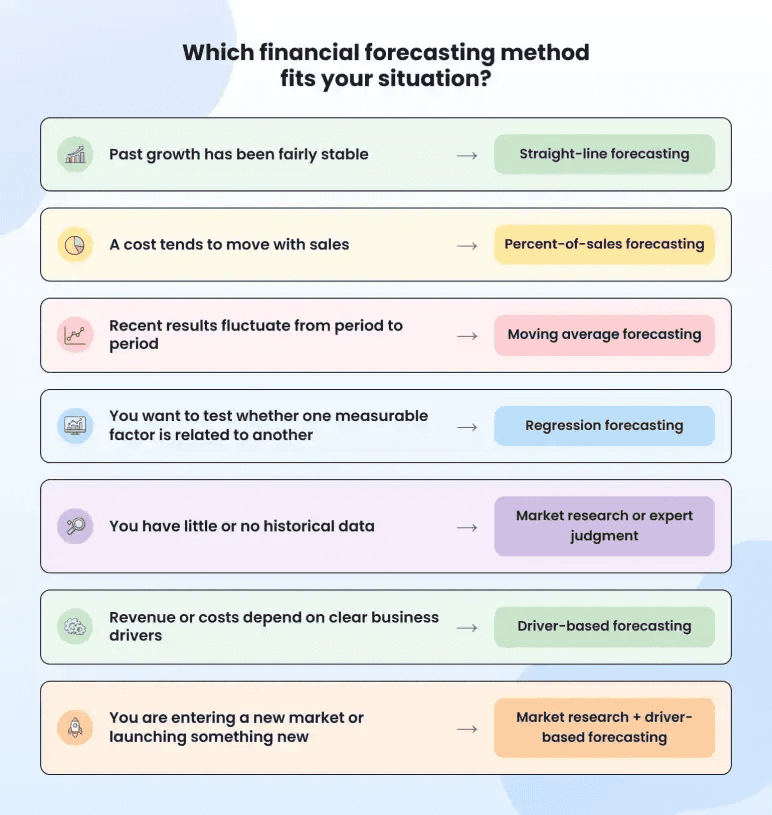
Don’t treat this table as a fixed rule. A method only makes sense if the information behind it is reliable enough to support the estimate.
Can you use more than one forecasting method?
Yes. Using more than one method makes sense when different parts of the business behave differently.
This is especially common when:
- Your existing business is adding a new product, service, or location. Use straight-line or moving average forecasting for the established part, and market research or driver-based forecasting for the new part.
- You’re starting a new business with no past results. Use market research or expert judgment to set assumptions, then driver-based forecasting to turn them into financial estimates.
- Your business earns revenue in different ways. Use straight-line or moving average forecasting for revenue with a reliable history, and driver-based forecasting for revenue based on customers, units, jobs, or pricing.
- You need to forecast revenue and the costs that increase as sales grow. Use straight-line or moving average forecasting for revenue, then percent-of-sales forecasting for costs that usually rise or fall with sales.
So, the goal is not to choose one forecasting method for the entire business. Choose the method that best fits each number or part of the forecast.
Conclusion
Summing up! The right forecasting method depends on the number you’re estimating and the information you have available. You may use past performance for some estimates and rely on business drivers, research, or expert input for others.
Once you’ve chosen the right method, the next step is to turn those estimates into a complete forecast and check how the numbers work together.
That’s where Upmetrics’ financial forecasting software can help. You can build revenue, expense, cash flow, and profit forecasts, adjust key assumptions, and see how those changes affect your overall financial outlook.
As actual results come in, keep comparing them with your forecast and update the assumptions that no longer hold. A useful forecast should change as your business does.
Forecast Your Business Without the Spreadsheet Headache
Build projections faster, test scenarios, and make smarter financial decisions.

Frequently Asked Questions
What is the best financial forecasting method for small businesses?
Do lenders or investors care which forecasting method you use?
What if two forecasting methods give you different results?
Is scenario planning a financial forecasting method?

Vinay Kevadia
Vinay Kevadiya is the founder and CEO of Upmetrics, the #1 business planning software. His ultimate goal with Upmetrics is to revolutionize how entrepreneurs create, manage, and execute their business plans. He enjoys sharing his insights on business planning and other relevant topics through his articles and blog posts. Read more