Executive Summary
QuickEats Delivery is a founder-operated local food delivery service launching in San Francisco’s Bayview District. Owned by Jordan Vega (70%) and Mia Torres (30%), the business partners with independent neighborhood restaurants and serves nearby residential customers seeking predictable pricing and reliable local delivery. The founders manage operations and complete the majority of deliveries during the pilot year.
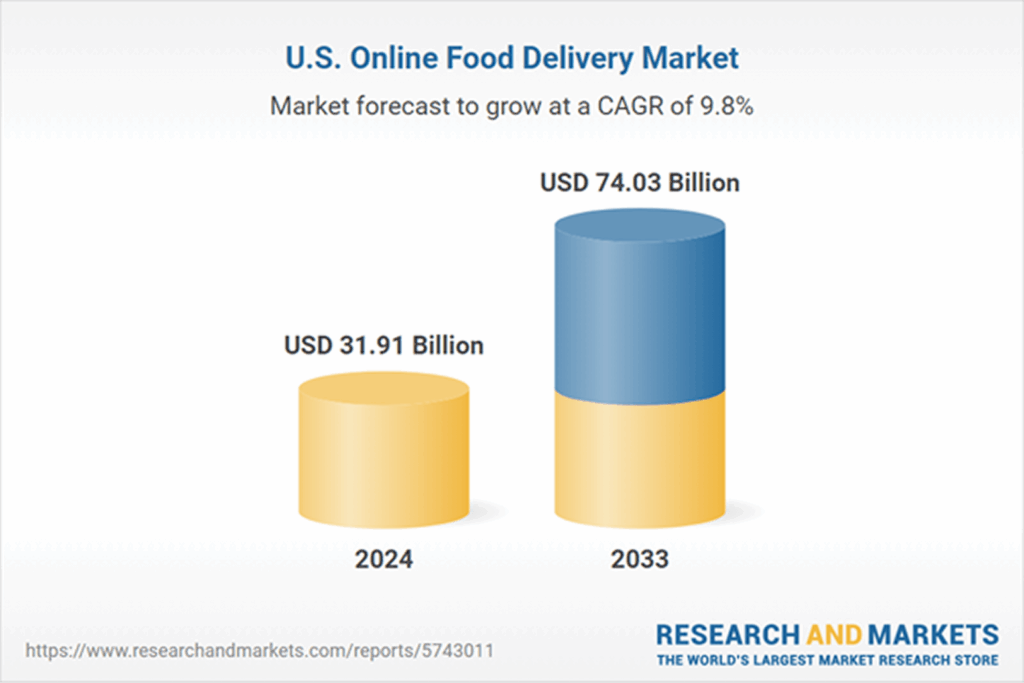
Demand for food delivery remains strong in dense urban areas where short delivery distances and high restaurant density support efficient local delivery. The U.S. online food delivery market was valued at approximately $31.91 billion in 2024 and is projected to reach about $74.03 billion by 2033, reflecting sustained consumer reliance on delivery and takeout services beyond pandemic-driven behavior.
The business operates as a constrained pilot intended to validate neighborhood-scale delivery economics before expanding staffing or service geography. Founder-operated delivery supports up to approximately 20 deliveries per day under stabilized conditions. Year 1 operations reflect a gradual ramp toward this level rather than steady-state performance, resulting in intentionally loss-making operations during the pilot phase.
Startup funding of $64,000 supports technology setup, delivery equipment, insurance, marketing, and working capital during the ramp period. Funding consists of $50,000 in revenue-based financing from ClearFund Growth Capital and $14,000 in founder capital. The financing structure avoids fixed monthly debt service and aligns repayment with delivery volume.
Expansion beyond the pilot phase is conditional on demonstrated delivery volume and cash flow stability. If adoption progresses more slowly than expected, the business continues operating in a founder-only configuration to limit fixed costs and preserve liquidity.

Company Description
Legal Structure and Location
QuickEats Delivery is structured as a California limited liability company. The registered business address is 2148 Montgomery Street, Suite 104, San Francisco, CA 94124, which serves as the administrative base of operations.
The company operates within San Francisco’s Bayview District during Year 1. Geographic expansion is phased and conditional on performance: Potrero Hill in Year 2, followed by scheduled-only delivery services in the Mission District in Year 3.
Business Goals
QuickEats is launched as a neighborhood-scale pilot with the primary goal of validating sustainable delivery economics at limited volume before expanding staffing or service area. The business prioritizes cash flow discipline, operational control, and repeat customer behavior over rapid growth.
Short-term goals focus on achieving consistent daily delivery volume within founder capacity. Long-term goals include selective geographic expansion and the introduction of additional delivery services only after unit economics and cash flow stability are demonstrated.
Ownership Structure
QuickEats Delivery will be owned and operated by its two founders, with Jordan Vega responsible for delivery execution and logistics, and Mia Torres overseeing restaurant partnerships and day-to-day operations.
Jordan Vega brings hands-on experience in bicycle-based delivery, including route planning, order batching, and urban logistics in dense neighborhoods. Jordan manages daily delivery execution, fleet upkeep, and service reliability during the pilot phase.
Mia Torres has experience working with independent restaurants, including menu coordination, partner onboarding, and customer issue resolution. Mia leads restaurant acquisition, menu setup, and ongoing partner communication. She will also deliver the food.
Business Model
QuickEats operates a food delivery service using founder-delivered bicycle courier operations. The company contracts with local restaurants at a flat 10% commission and charges customers delivery fees ranging from $3.99 to $6.99 per order.
During the pilot year, QuickEats focuses exclusively on on-demand restaurant delivery within a constrained geographic radius. This allows the business to validate unit economics, delivery timing, and repeat customer behavior before introducing additional services.
Year 2 introduces limited, scheduled batch services, including:
- Scheduled grocery delivery windows, and
- Small catering and batch orders with advance notice and minimum order thresholds.
These services are designed to increase delivery density and improve per-route efficiency rather than expand geographic coverage.
Year 3 expansion is geographic, not service-based, extending restaurant and scheduled delivery coverage into adjacent neighborhoods only after delivery volume and cash flow stability are demonstrated.
All expansion decisions remain conditional. No additional services or geographic growth are assumed unless core restaurant delivery proves operationally and financially sustainable.
Services and Pricing
QuickEats is launched as a focused, single-service delivery business and expands its offerings only after core operations stabilize. This approach limits early complexity and ensures pricing remains simple and predictable during the pilot phase.
Customer Services
During Year 1, QuickEats provides on-demand restaurant delivery only. Customers place orders through the website, and the founders complete all deliveries. Additional services are introduced later, once restaurant delivery volume is consistent.
| Service Type | Availability | Description |
|---|---|---|
| On-demand restaurant delivery | Year 1 | Core pilot service |
| Scheduled grocery delivery windows | Year 2 | Two-hour delivery windows |
| Late Year 2 (conditional) | Late Year 2 (conditional) | 24-hour notice, $150 minimum |
This staged rollout keeps Year 1 operations tightly controlled while allowing revenue diversification in later years.
Customer Pricing
QuickEats applies a simple, flat pricing structure designed to remain predictable for customers and operationally manageable during the pilot phase, with limited peak adjustments and no dynamic pricing.
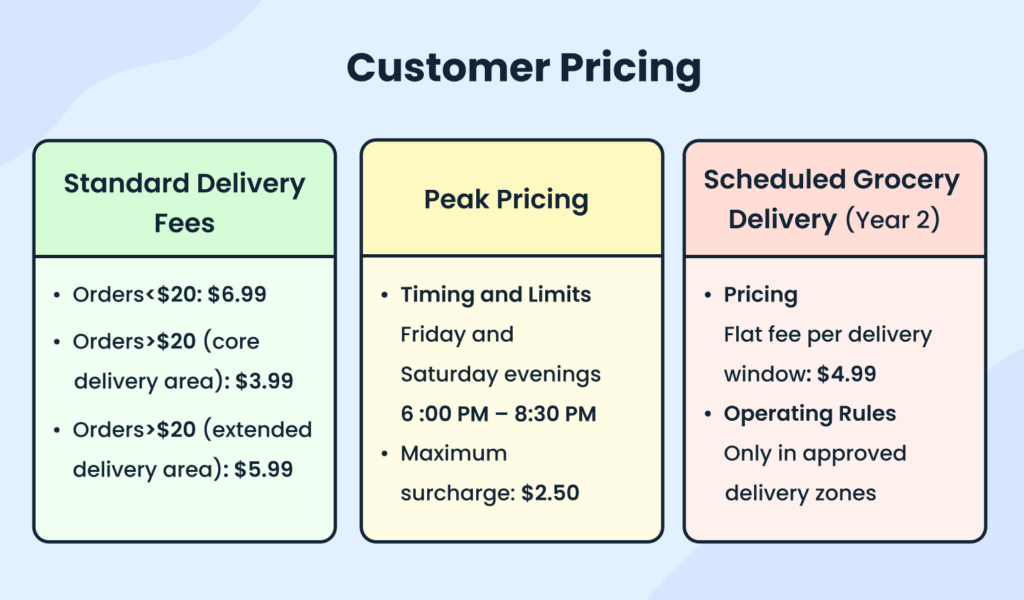
Delivery areas are defined manually during order acceptance based on address proximity and route practicality. No automated distance calculation or dynamic routing software is used during the pilot phase.
Restaurant Pricing
QuickEats partners with restaurants under a flat, contract-free commission structure. Restaurants pay a 10% commission on food subtotals before tax and tip. No monthly fees, long-term contracts, or proprietary tablets are required.
Menus are entered manually during onboarding, and commission amounts are remitted to restaurants every week. This structure keeps restaurant participation simple and avoids fixed costs on either side.
Revenue Per Order
During Year 1, revenue is generated solely from customer delivery fees and restaurant commissions.
On average, customer delivery fees contribute approximately $6.00 per order, while restaurant commissions contribute approximately $3.50 per order, based on an assumed average order value of approximately $35. This results in an average revenue per order of approximately $10.50 during the pilot year.
In Year 2 and Year 3, revenue per order increases as additional services are introduced and average order values rise. These later-year additions supplement, but do not replace, core restaurant delivery revenue.
Run-Rate Revenue Capacity
At stabilized operations of 20 deliveries per day across 360 operating days, annual delivery volume reaches approximately 7,200 orders, supporting a maximum annualized retained revenue capacity of approximately $75,600.
This figure represents steady-state operating capacity and is not presented as guaranteed realized revenue for Year 1.
Market Analysis
Market Overview & Target Customers
Online food delivery is growing as more people choose convenience over cooking at home. In 2024, the global food delivery market was worth $288.84 billion and is expected to reach $505.50 billion by 2030. Busy schedules, smartphone use, and easy online payments are driving this growth.
In the United States, the food delivery market reached $31.91 billion in 2024 and is expected to grow to $74.03 billion by 2033.
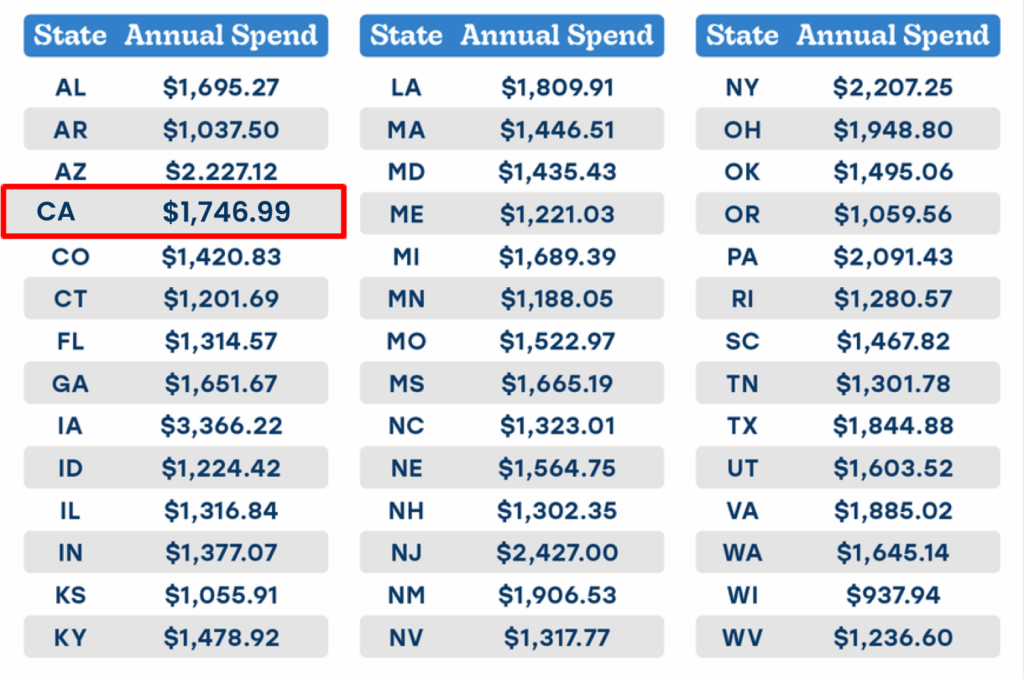
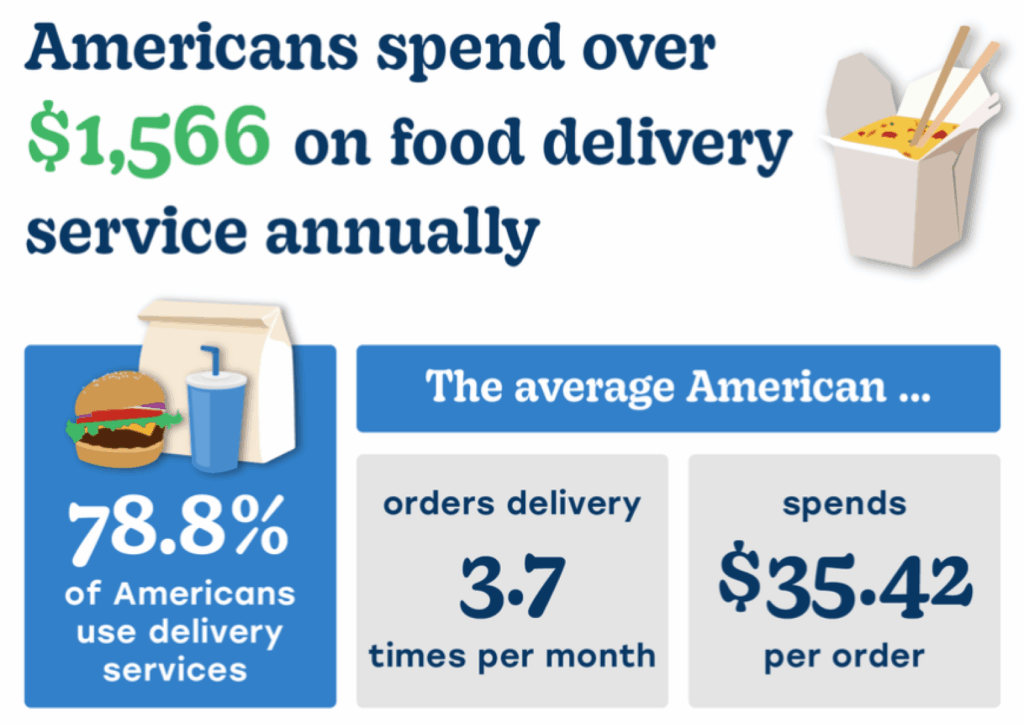
Americans spend over $1,566 per year on food delivery. In California, annual spending is higher at about $1,746.99.
For many city residents, food delivery has become a regular part of daily life.
On average, Americans order food delivery about 3.7 times per month, with apartment residents ordering more frequently.
These customers want fast service, fair prices, and clear fees. Many prefer ordering from local restaurants rather than large chains.
QuickEats focuses on:
- Urban residents aged 20–45
- Busy people who order food several times a week
- Customers looking for lower fees and honest pricing
- People who prefer supporting local restaurants
By focusing on local neighborhoods, QuickEats offers a simple and reliable delivery service. This approach helps build customer trust and supports nearby restaurants.
Competitive Landscape
QuickEats operates in a neighborhood-level food delivery environment where competition is driven less by national scale and more by local alternatives already serving the same customers. The primary competitors are existing delivery marketplaces and informal local delivery options within the same service radius.
| Competitor type | Operating model | Competitive position |
|---|---|---|
| National delivery apps (DoorDash, Uber Eats, Grubhub) | Platform-based marketplaces using independent drivers | Broad restaurant coverage and strong brand awareness, but higher fees for restaurants and inconsistent service at the neighborhood level |
| Restaurant-owned delivery | In-house staff or ad hoc drivers | Lower platform fees and direct customer relationships, but limited reach and inconsistent availability |
| Informal local couriers | Independent drivers or small operators | Flexible and low-cost in some areas, but unreliable, unbranded, and difficult to scale |
Differentiation Strategy
QuickEats differentiates through three operational choices:
- Lower restaurant commission: A flat 10% commission improves restaurant unit economics compared to national platforms.
- Founder-operated delivery: All Year 1 deliveries are completed by the founders, reducing variability during the pilot phase.
- Limited geography: Operations remain within a bicycle-deliverable radius to control delivery time and cost.
- Direct restaurant relationships: Orders are sourced through direct partnerships rather than a marketplace model, reducing dependence on algorithmic placement, paid visibility, or promotional bidding.
These choices are designed to support pilot feasibility at low volume. They do not insulate the business from competitive responses once scale is required.
Market Risk
QuickEats operates in a market where customer habits and restaurant relationships are already established around existing delivery apps. Even at a neighborhood level, these platforms can react quickly by increasing local visibility or offering short-term discounts, making it harder for a new service to gain consistent order volume.
Restaurant adoption presents additional risk. Many restaurants depend on third-party platforms for delivery sales and may be hesitant to shift customer traffic to a smaller service, even with lower commissions. This can slow customer acquisition and limit repeat ordering during the early stages.
Because of these conditions, QuickEats treats growth as uncertain and keeps costs flexible. Expansion, hiring, and service coverage are adjusted only after stable order demand is observed, reducing exposure if market adoption is slower than expected.
Marketing and Sales Strategy
Marketing Budget and Timeline
QuickEats allocates a fixed marketing budget of approximately $2,000 per month during the pilot year to support early customer adoption and restaurant visibility. Spend is intentionally modest and adjusted only after performance data is observed and delivery capacity allows.
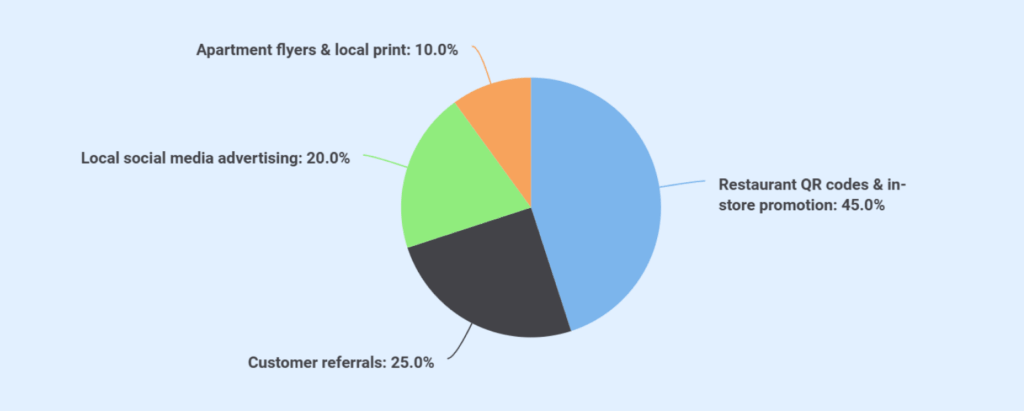
| Category | Monthly Spend | How we will use this tactic |
|---|---|---|
| Restaurant partner materials | Included in budget | Print and distribute QR codes, counter cards, and bag inserts at partner restaurants to drive first-time app scans and orders |
| Local print distribution | Included in budget | Place flyers in nearby apartments, residential buildings, and local notice boards within active delivery zones |
| Digital advertising | $500 | Run geo-targeted social media ads focused on limited delivery areas to test demand and cost per order |
| Referral incentives | Variable (usage-based) | Offer discounts or credits to existing customers who refer new users during the pilot phase |
| Total Monthly Budget | $2,000 | Fixed, controlled spend aligned with pilot delivery capacity |
Marketing activity during the pilot year is designed to remain tightly controlled and capacity-aware. The estimated customer acquisition cost (CAC) of approximately $20 per initial customer reflects the cost of acquiring a first-time ordering user, not the cost of generating each delivery. Ongoing order volume is expected to be driven in part by repeat customers and restaurant-led promotion rather than continuous paid acquisition.
Marketing spend is intentionally constrained and throttled to founder-operated delivery capacity to avoid over-acquisition, service delays, or degradation of delivery reliability during the pilot phase.
Customer Acquisition Strategy
QuickEats uses a neighborhood-focused customer acquisition strategy designed to minimize paid advertising and rely primarily on restaurant-led exposure and referrals during the pilot phase.
This mix reflects the company’s emphasis on restaurant partnerships and repeat customer behavior rather than heavy reliance on paid digital advertising.
Restaurant Partner Acquisition
Restaurant onboarding is phased to match delivery capacity and operational readiness.
| Milestone | Target |
|---|---|
| Restaurant partners by Month 1 | 10 |
| Restaurant partners by Month 2 | 15 |
| Active partners by Month 6 | 20 |
Onboarding includes manual menu setup, QR code placement, and order flow training. Partner acquisition emphasizes commission savings and direct communication rather than paid outreach.
Customer Retention
To attract new customers during the pilot phase, QuickEats offers a $6 discount on a customer’s first order. This incentive is designed to encourage trial within the active delivery area and is capped through the fixed monthly marketing budget to prevent demand from exceeding founder delivery capacity.
Customer retention during Year 1 relies on consistent delivery execution, predictable pricing, and real-time order confirmations via text message, rather than ongoing discounts or loyalty subsidies.
Beginning in Year 2, the business may introduce an optional paid membership program for high-frequency customers seeking unlimited free delivery on qualifying orders, subject to demonstrated delivery volume and operational stability.
Stop searching the internet for industry & market data
Get AI to bring curated insights to your workspace

Operations Plan
Delivery Workflow
Customers place orders through the QuickEats website and complete payment via Stripe. Order details are transmitted to the available founder via text and email. The founder collects the order from the restaurant and completes delivery to the customer. Order confirmation is sent via text message.
Manual dispatch is used during Year 1. When both founders are active, coordination occurs via direct communication to manage pickup timing and routing.
Daily Capacity and Operating Hours
Each founder can complete approximately 10 deliveries per day under typical urban bicycle delivery conditions. Combined daily delivery capacity is therefore approximately 20 deliveries per day during the pilot phase. This figure represents maximum operational capacity, not required or guaranteed delivery volume.
Operating hours are 11:00 AM to 9:00 PM daily. The business operates approximately 360 days per year.
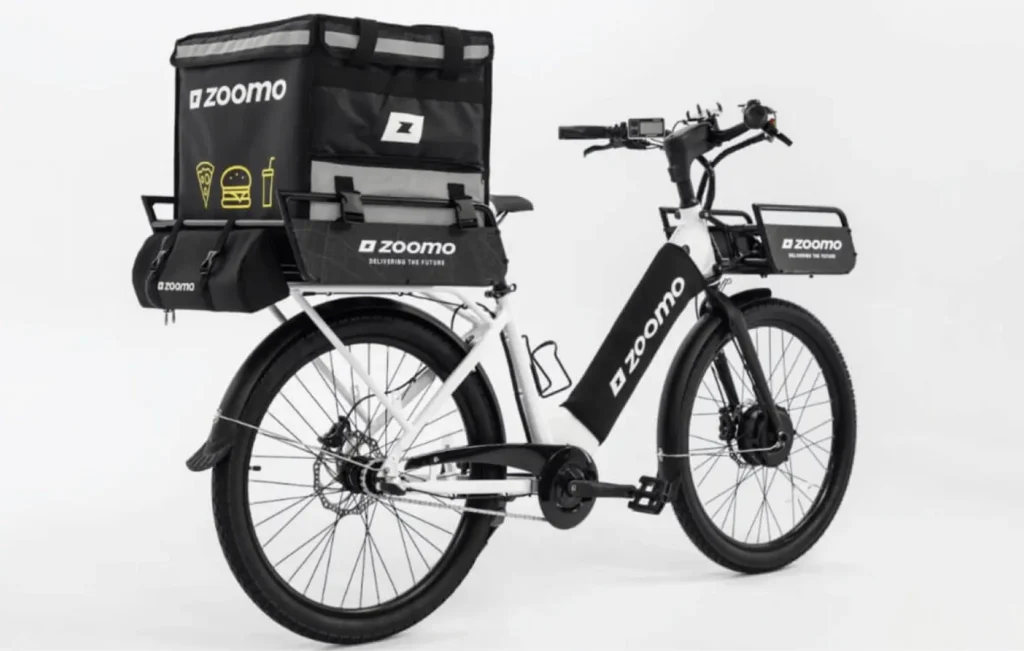
Fleet and Equipment
The initial fleet consists of two electric cargo bicycles purchased for approximately $2,000 each. Each bicycle is equipped with an insulated delivery bag, phone mount, helmet, reflective vest, and safety lighting.
Additional bicycles are added only when delivery volume and staffing expansion justify the added capital expense. Year 2 includes 3 additional bikes. Year 3 expands the fleet to 8 bikes total. All bikes follow the same model to simplify maintenance and parts replacement.
Technology Infrastructure
QuickEats operates through a custom-built website supporting ordering, menu display, payment processing, and administrative oversight. Website development costs total $15,000. Hosting expenses are approximately $50 per month.
Payment processing follows standard Stripe pricing of 2.9 % plus $0.30 per transaction. SMS notifications average approximately $50 per month. Accounting is handled through QuickBooks with contract accountant support at $200 per month.
No mobile application is used during the pilot phase.
Insurance and Compliance
QuickEats maintains required business insurance coverage appropriate for founder-operated bicycle delivery services. General liability insurance is carried through a California-licensed commercial insurer at an estimated annual cost of approximately $3,500.
Commercial bicycle courier coverage is carried through a specialty courier insurance provider at an estimated annual cost of approximately $6,000, resulting in total Year 1 insurance costs of approximately $9,500.
Both founders hold valid California Food Handler Certificates issued in accordance with San Francisco Department of Public Health requirements. The business complies with applicable local operating regulations for food delivery services and independent courier activity.
Route planning prioritizes residential streets and lower-traffic corridors where feasible to reduce delivery risk exposure and support safe bicycle operations.
Year 1 Staffing
| Role | Responsibility | Compensation |
|---|---|---|
| Jordan Vega | Logistics, food delivery | Deferred until Month 9 |
| Mia Torres | Restaurant relations, operations, food delivery | Deferred until Month 9 |
| Contract accountant | Monthly reconciliation, tax filings | $200 monthly |
| Backup courier | On-call coverage as needed | Variable, as used |
During Year 1, all delivery activity is founder-operated, with backup courier labor ($18 per hour) used on a contingency basis only. In Year 2, part-time couriers are added to support geographic expansion and increased delivery density.
Financial Plan
QuickEats Delivery operates a founder-delivered, neighborhood-scale food delivery model during the pilot phase. Financial projections are intentionally conservative and reflect a gradual ramp toward founder delivery capacity rather than immediate scale.
The pilot year is planned to be loss-making, as fixed startup costs and early marketing spend precede the stabilization of delivery volume. As a result, the business records negative retained earnings and negative equity during the pilot phase, which is expected and financed through a combination of revenue-based financing and limited founder support.
The financial model prioritizes liquidity preservation, a variable cost structure, and disciplined expansion. No fleet loans, term debt, or full-time payroll commitments are assumed during Year 1.
Startup Costs
QuickEats Delivery requires $64,000 in total startup funding to launch operations and support the pilot ramp period. Funding consists of $14,000 in founder capital and $50,000 in revenue-based financing from ClearFund Growth Capital.
Startup costs include one-time setup expenses, required insurance, initial marketing, and working capital reserves intended to absorb planned pilot-phase operating losses during the early ramp period.
| Category | Amount ($) |
|---|---|
| Website and ordering backend | 15,000 |
| Fleet purchase (2 electric bikes) | 4,000 |
| Insurance (general liability + courier) | 9,500 |
| Delivery gear and safety equipment | 3,500 |
| Restaurant onboarding and menu setup | 6,000 |
| Launch marketing | 8,000 |
| Backup courier cost reserve (contingency only) | 6,000 |
| Working capital reserve | 12,000 |
| Total Startup Cost | 64,000 |
There is no mobile app development, no dispatch software financing, and no vehicle loan included in Year 1. Fleet expansion, additional bikes, and recurring courier hiring are deferred until delivery volume and cash flow support the added cost.
Key Financial Assumptions (Pilot Year)
Restaurant payouts are excluded from revenue and, therefore, excluded from cost of sales.
| Assumption | Value |
|---|---|
| Average daily deliveries (at capacity) | 20 |
| Operating days per year | 360 |
| Annual delivery capacity (stabilized) | 7,200 |
| Average food order value (customer spend) | $35 |
| Average delivery fee and surcharge | $6 |
| Gross receipts per order (customer pays) | $41 |
| Retained revenue per order (platform take) | $10.50 |
| Payment processing (Stripe) | 2.9% + $0.30 per order |
| Average Stripe cost per delivery | ~$0.60 |
| Courier labor (pilot year average) | ~$0.34 per delivery |
| Total variable cost per delivery | ~$0.95 |
| Net contribution per delivery | ~$9.55 |
- Courier labor per delivery increases in Years 2–3 as the business transitions from founder-delivered operations to paid part-time couriers to support geographic expansion and higher delivery volume.
- Total fixed operating expenses (including founder compensation and baseline marketing): approximately $4,998 per month during Year 1.
Delivery Volume (Year 1)
Realized Year 1 delivery volume is projected at approximately 5,850 deliveries, reflecting a gradual ramp toward founder delivery capacity during the first five months of operation.
Operations begin at lower utilization during the initial months, with delivery volume increasing as restaurant partnerships and repeat customer demand are established. Financial projections reflect this ramp rather than immediate operation at full capacity.
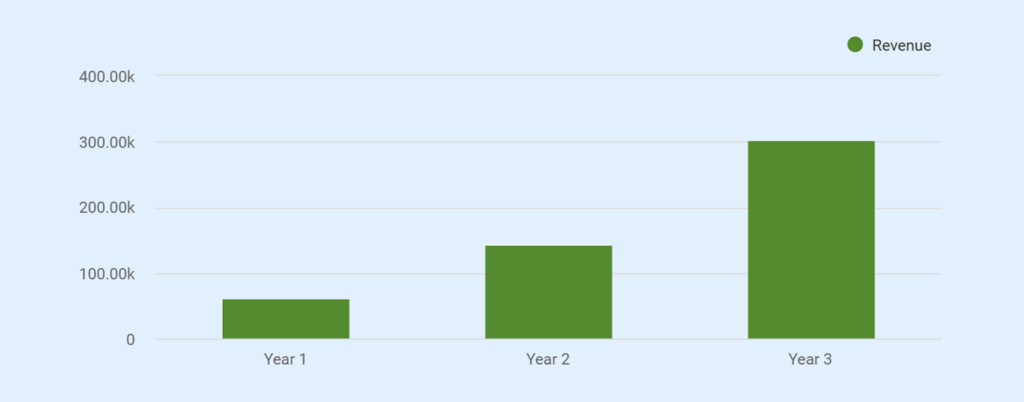
Revenue Forecast (3-Year)
| Year | Year 1 (Pilot ramp) | Year 2 (Conditional expansion) | Year 3 (Conditional local scale) |
|---|---|---|---|
| Estimated Revenue | 61,425 | 142,560 | 302,400 |
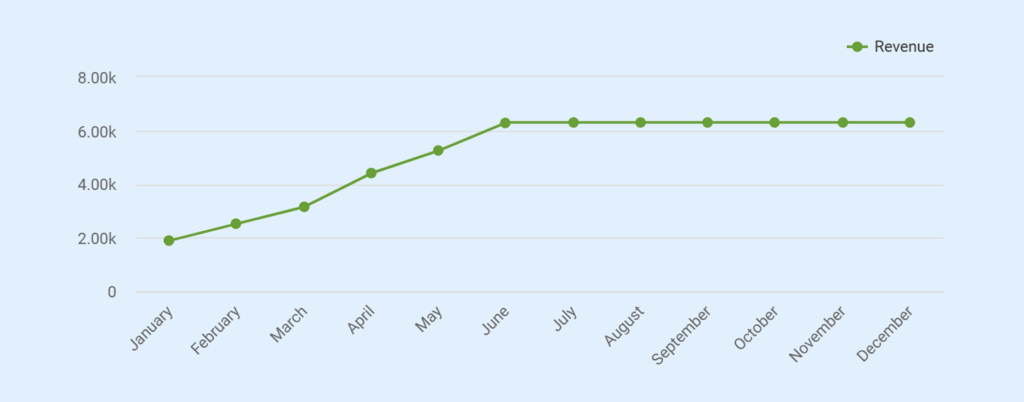
Monthly Projections (Year 1)
| Month | Avg Deliveries / Day | Revenue ($) |
|---|---|---|
| January | 6 | 1,890 |
| February | 8 | 2,520 |
| March | 10 | 3,150 |
| April | 14 | 4,410 |
| May | 17 | 5,355 |
| June | 20 | 6,300 |
| July | 20 | 6,300 |
| August | 20 | 6,300 |
| September | 20 | 6,300 |
| October | 20 | 6,300 |
| November | 20 | 6,300 |
| December | 20 | 6,300 |
| Total Year 1 Revenue | — | 61,425 |
Note: Annual revenue represents approximately 5,850 completed deliveries at an average retained revenue of $10.50 per order.
Revenue reflects retained platform revenue.
Projected Profit & Loss Statement (3 Years)
| Category | Year 1 ($) | Year 2 ($) | Year 3 ($) |
|---|---|---|---|
| Revenue (retained) | 61,425 | 142,560 | 302,400 |
| Payment processing (Stripe) | 3,536 | 8,207 | 17,409 |
| Courier labor (variable) | 2,000 | 48,000 | 96,000 |
| Total Variable Costs | 5,536 | 56,207 | 113,409 |
| Gross Profit | 55,889 | 86,353 | 188,991 |
| Gross Margin | 91% | 61% | 63% |
| Insurance (general + courier) | 9,500 | 11,000 | 13,000 |
| Licenses, permits & compliance | 2,500 | 3,000 | 3,500 |
| Marketing & advertising | 24,000 | 30,000 | 36,000 |
| Phone, hosting & SMS | 1,200 | 1,500 | 1,800 |
| Accounting & admin | 6,600 | 8,000 | 10,000 |
| Founder compensation | 12,000 | 36,000 | 48,000 |
| Miscellaneous operating expenses | 4,180 | 6,000 | 8,000 |
| Total Fixed Expenses | 59,980 | 95,500 | 120,300 |
| Operating Income (Loss) | (4,091) | (9,147) | 68,691 |
| Depreciation (non-cash) | 4,000 | 4,000 | 4,000 |
| Pre-Tax Income | (8,091) | (13,147) | 64,691 |
| Estimated taxes | — | — | 8,900 |
| Net Income (Loss) | (8,091) | (13,147) | 55,791 |
Projected Balance Sheet
| Category | Year 1 ($) | Year 2 ($) | Year 3 ($) |
|---|---|---|---|
| Assets | |||
| Cash & cash equivalents | 38,346 | 5,000 | 5,252 |
| Accounts receivable | 2,000 | 5,000 | 4,000 |
| Prepaid expenses & deposits | 3,000 | 5,500 | 4,000 |
| Total Current Assets | 43,346 | 11,500 | 13,252 |
| Website & software (gross) | 15,000 | 15,000 | 15,000 |
| Delivery bikes & equipment (gross) | 4,000 | 10,000 | 16,000 |
| Less: accumulated depreciation | (4,000) | (8,000) | (12,000) |
| Net Fixed Assets | 15,000 | 17,000 | 19,000 |
| Total Assets | 58,346 | 28,500 | 32,252 |
| Liabilities | |||
| Accounts payable | 3,500 | 4,000 | 5,000 |
| Accrued expenses | 2,500 | 3,000 | 3,500 |
| Total Current Liabilities | 6,000 | 7,000 | 8,500 |
| Revenue-based financing (net balance) | 46,437 | 38,169 | 20,630 |
| Founder’s advance (working capital) | — | 14,569 | 14,569 |
| Total Liabilities | 52,437 | 59,738 | 43,699 |
| Owner’s Equity | |||
| Owner capital contribution | 14,000 | 14,000 | 14,000 |
| Retained earnings (cumulative) | (8,091) | (21,238) | 34,553 |
| Owner draws (cumulative) | — | (24,000) | (60,000) |
| Total Owner’s Equity | 5,909 | (31,238) | (11,447) |
| Total Liabilities + Equity | 58,346 | 28,500 | 32,252 |
Projected Cash Flow (3 Years)
| Category | Year 1 ($) | Year 2 ($) | Year 3 ($) |
|---|---|---|---|
| Operating Activities | |||
| Net income (loss) | (8,091) | (13,147) | 55,791 |
| Add back: Depreciation | 4,000 | 4,000 | 4,000 |
| Change in accounts receivable | (2,000) | (1,000) | (1,000) |
| Change in prepaid expenses | (3,000) | (500) | (500) |
| Change in accounts payable | 3,500 | 500 | 1,000 |
| Change in accrued expenses | 2,500 | 500 | 500 |
| Net Cash from Operating Activities | (3,091) | (9,647) | 59,791 |
| Investing Activities | |||
| Website & backend development | (15,000) | — | — |
| Delivery bikes & equipment (initial 2 bikes) | (4,000) | — | — |
| Additional bikes & equipment (3 bikes) | — | (6,000) | (6,000) |
| Net Cash from Investing Activities | (19,000) | (6,000) | (6,000) |
| Financing Activities | |||
| Revenue-based financing proceeds | 50,000 | — | — |
| Founder capital contribution | 14,000 | — | — |
| Founder advance (working capital support) | — | 14,569 | — |
| RBF repayments (5.8% of retained revenue) | (3,563) | (8,269) | (17,539) |
| Owner draws | — | (24,000) | (36,000) |
| Net Cash from Financing Activities | 60,437 | (17,699) | (53,539) |
| Net change in cash | 38,346 | (33,346) | 252 |
| Beginning cash balance | 0 | 38,346 | 5,000 |
| Ending Cash Balance | 38,346 | 5,000 | 5,252 |
Break-Even Analysis
| Metric | Value |
|---|---|
| Average retained revenue per delivery | $10.50 |
| Average variable cost per delivery (Stripe + labor) | $0.95 |
| Net contribution per delivery | $9.55 |
| Monthly fixed operating costs (from P&L fixed expenses ÷ 12) | ~$4,998 |
| Break-even deliveries per month | ~523 |
| Break-even deliveries per day (360 days) | ~17.5 |
| Break-even monthly retained revenue | ~$5,494 |
| Founder delivery capacity (daily) | ~20 deliveries |
| Break-even status at capacity | Slightly above break-even (steady-state), below break-even during ramp |
Business Ratios
| Ratio | Year 1 | Year 2 | Year 3 |
|---|---|---|---|
| Gross Margin | 91% | 61% | 63% |
| Operating Margin | -6.7% | -6.4% | 22.7% |
| Net Margin | -13.2% | -9.2% | 18.4% |
| Current Ratio (Current Assets ÷ Current Liabilities) | 7.2 | 1.6 | 1.6 |
| Debt-to-Equity Ratio | n.m. | n.m. | n.m. |
| Break-Even Coverage (capacity 20 ÷ BE ~17.5) | 1.14× | 1.14× | 1.14× |
- n.m. = not meaningful due to negative equity in early years
- Gross margin reflects Stripe at ~5.8% of retained revenue
- Ratios now reconcile fully with the corrected financial statements
*Gross margin is calculated on retained platform revenue and excludes restaurant payouts, which are not included in reported revenue.
The high gross margin reflects a platform revenue definition rather than total customer food spend.

Don’t waste time using spreadsheets
Simplify financial forecasting & reporting w/ Upmetrics
Funding Requirements
Scenario Type: Founder-funded startup with revenue-based financing
Business Model: Founder-operated local food delivery service
Entity: QuickEats Delivery
Location: San Francisco, California
QuickEats Delivery requires $64,000 in total startup funding to launch operations in the Bayview District and support the pilot ramp period. Funding is structured to minimize fixed financial obligations and preserve flexibility during early-stage demand validation.
Funding Sources
| Source | Amount ($) |
|---|---|
| Revenue-based financing | 50,000 |
| Founder capital contribution | 14,000 |
| Total Funding | 64,000 |
Revenue-based financing is structured as 5.8% of retained platform revenue, with a capped repayment amount. Repayments flex with delivery volume and do not impose fixed monthly debt service during the pilot ramp.
Use of Funds
Startup funding is allocated to core operational requirements and working capital during the pilot ramp.
| Use | Amount ($) |
|---|---|
| Website and ordering backend | 15,000 |
| Fleet purchase (2 electric bikes) | 4,000 |
| Insurance (general liability and courier) | 9,500 |
| Delivery gear and safety equipment | 3,500 |
| Restaurant onboarding and menu setup | 6,000 |
| Launch marketing | 8,000 |
| Courier backup payroll buffer | 6,000 |
| Working capital reserve | 12,000 |
| Total Uses | 64,000 |
Working capital reserves are intended to absorb early operating losses during the ramp period and are not committed to fixed payroll or long-term obligations.
Funding Notes
- No vehicle loans, fleet financing, or term debt are included in Year 1.
- No full-time courier payroll is assumed during the pilot phase.
- Expansion capital is not assumed and will be pursued only after delivery volume supports additional fixed costs.
The Quickest Way to turn a Business Idea into a Business Plan
Fill-in-the-blanks and automatic financials make it easy.
Upmetrics
Upmetrics is the #1 business planning software that helps entrepreneurs and business owners create investment-ready business plans using AI. We regularly share business planning insights on our blog. Check out the Upmetrics blog for such interesting reads. Read more