Executive Summary
GreenEdge Landscaping is an owner-operated, start-up landscaping services business with its headquarters located at 1462 Industrial Park Road, Suite 3, Columbus, OH 43228. The firm offers routine lawn care and seasonal landscape services to residential homeowners and other small commercial properties within a 20 to 25-mile area of Columbus, Ohio.
The major services are lawn mowing, edging, trimming, and blowing (with seasonal services to install mulch, clean up leaves, overseeding, and even snow removal). GreenEdge is a field-based service company that does not have a retail storefront and relies on direct service provision to local customers.
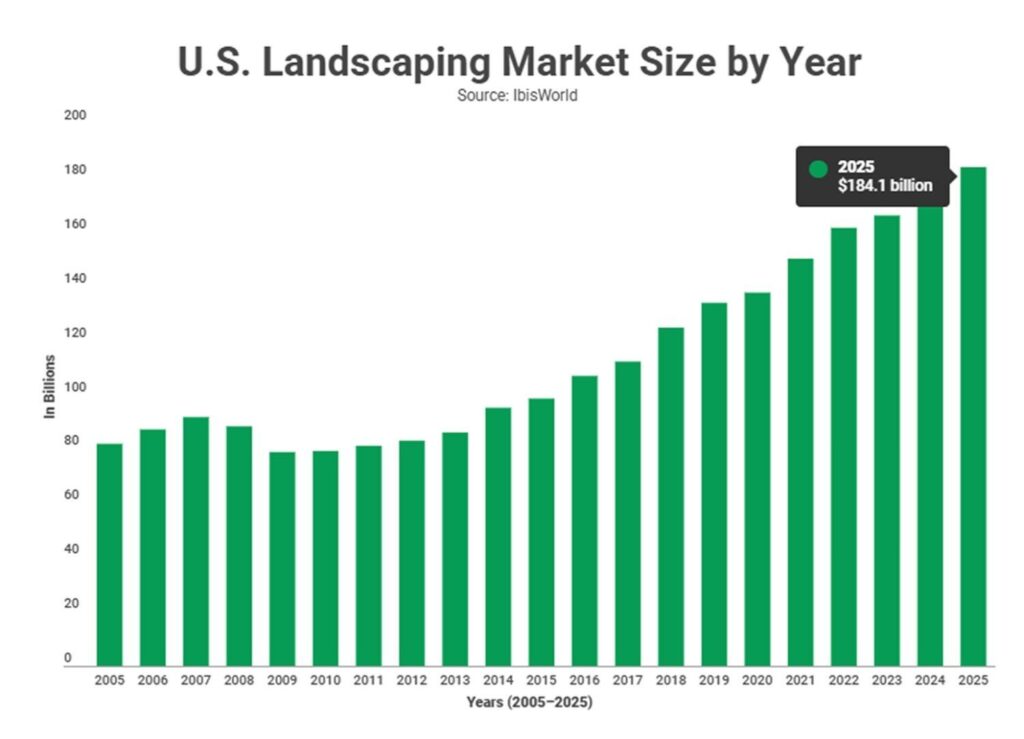
The U.S. landscaping services industry generates over $180 billion in annual revenue and employs more than 1 million workers, according to IBISWorld’s Landscaping Services industry profile. Despite its size, the industry remains highly fragmented, with the four largest firms accounting for less than 5% of total market revenue.
The strategy of GreenEdge Landscaping is aligned with these industry conditions by placing the focus on weekly recurring maintenance contracts as the key source of income. The seasonal and one-time services are only used in times of increased demand.
The owner does the field work, scheduling, estimating, and communication with the customers, and a part-time hourly laborer is only engaged during high-volume months. There is no plan to add a second crew or expand geographically in the first 3 years.
The startup capital is $55,000, including a $50,000 bank term loan from Fifth Third Bank and a $5,000 cash contribution by the owner. The major amount is allocated to a used pickup truck, utility trailer, commercial mower, other necessary landscaping equipment, insurance, marketing, and initial working capital. The owner will not take compensation in Year 1 to keep early cash flow, and small amounts of draw will occur in Year 2 as recurring revenue stabilizes.
The financial forecast is a median-case projection (conservative) of the owner-operated, one-crew landscaping model. Although Year 1 records a positive net income and EBITDA, this is mainly due to the owner working in the field without compensation in the first year of operation.
Cash-wise, the business is in a position to make a high operating surplus in Year 1 because of low fixed overhead and deferred owner pay. With the addition of owner compensation in Years 2 and 3, margins stabilize, recurring routes mature, and operational efficiency is increased. This design is consistent with the economics of a small-scale landscaping firm.
| Metric | Year 1 ($) | Year 2 ($) | Year 3 ($) |
|---|---|---|---|
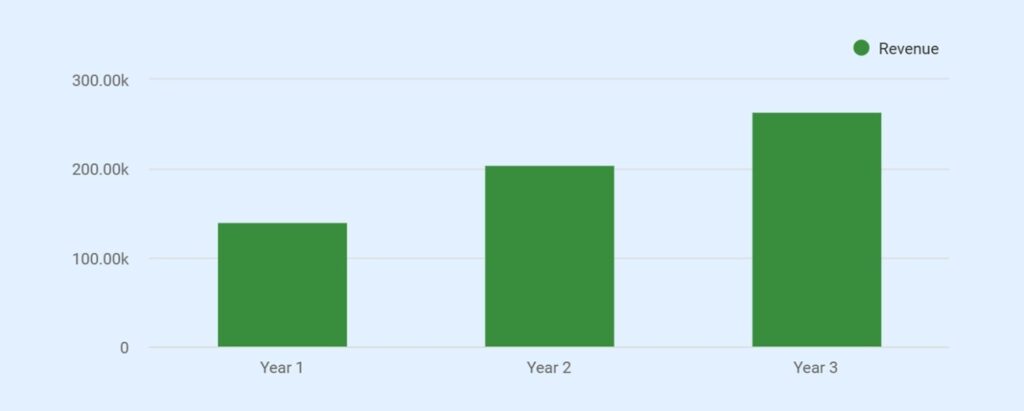
| Total Revenue | 140,000 | 205,000 | 264,000 |
| Gross Profit | 85,200 | 133,500 | 177,000 |
| Total Operating Expenses | 14,700 | 52,000 | 65,300 |
| Net Income (Pre-Tax) | 57,400 | 69,200 | 100,200 |
*Year 1 profitability should be interpreted as owner-operated cash flow rather than fully loaded operating profit.
The low fixed-cost structure allows the business to reach break-even early in the operating season and adjust to changes in workload without financial strain.
Business Description and Structure
Legal Structure and Ownership
GreenEdge Landscaping is a limited liability company with one member, Nolan Pierce, who owns 100% of the company. It’s an owner-managed firm with all the core business functions being handled by Nolan, which includes on-site landscaping services, scheduling and routing, estimating, customer communication, and vendor coordination.
Nolan Pierce, as a first-time business owner, runs the company on a hands-on, one-crew system that provides direct control of service quality and daily operations. Such a structure enables quicker decision-making, uniform implementation, and tight control of operating expenses in the initial phases of the business.
Startup Status
GreenEdge is a startup business with no operating history. Financial estimates are based on practical assumptions for a first-time owner performing all core work, serving a limited local area, and operating with a single crew during the initial years. Revenue assumptions reflect a gradual build-up of recurring maintenance clients over the first operating season rather than full utilization at launch.
Service Area and Routing Limits
GreenEdge Landscaping is a small-scale residential company (or business that deals with small-scale clients) and has a geographic radius of about 20-25 miles around Columbus, Ohio. The service area is strictly narrowed to facilitate compact routing and minimize travel time and fuel consumption. Also, it allows the business to serve multiple properties effectively on a working day.
By limiting the services to specific neighborhoods, the business will be able to have regular service dates, react faster to scheduling shifts or weather delays, and provide quality weekly service without overloading the operational bandwidth.
Business Objectives
GreenEdge Landscaping’s objectives are structured around operational stability, predictable cash flow, and controlled growth rather than rapid expansion.
- Build and stabilize recurring routes: Reach and maintain 45–50 weekly recurring maintenance clients by Year 3 within the defined service area, forming the core revenue base.
- Maintain disciplined profitability: Achieve near break-even performance in Year 1, followed by sustainable profitability in Years 2 and 3 without adding additional crews or fixed overhead.
- Maintain low-risk cost structure: Maintain low levels of fixed operating costs and make most of the costs variable and directly dependent on service volume.
- Increase cash resilience: Develop adequate cash reserves in the peak seasons in order to maintain throughout the off-season months without the use of short-term funding.
Operating Structure and Crew Model
GreenEdge Landscaping operates as a single-crew, owner-led business. The owner performs on-site services and manages scheduling, estimates, and customer communication to maintain direct control over daily operations and service quality. This centralized operation helps with faster decision-making, without transfers or management levels.
The part-time hourly laborer is only hired during peak months to facilitate field work in case of excessive workload, and the owner cannot manage it reasonably alone. Work is applied on a job-related, flexible basis, and no second layer or supervision is provided in the first three years. This model facilitates stable implementation and maintains a low operational complexity and staffing risk.
Services and Revenue Model
Recurring Maintenance Services (Core)
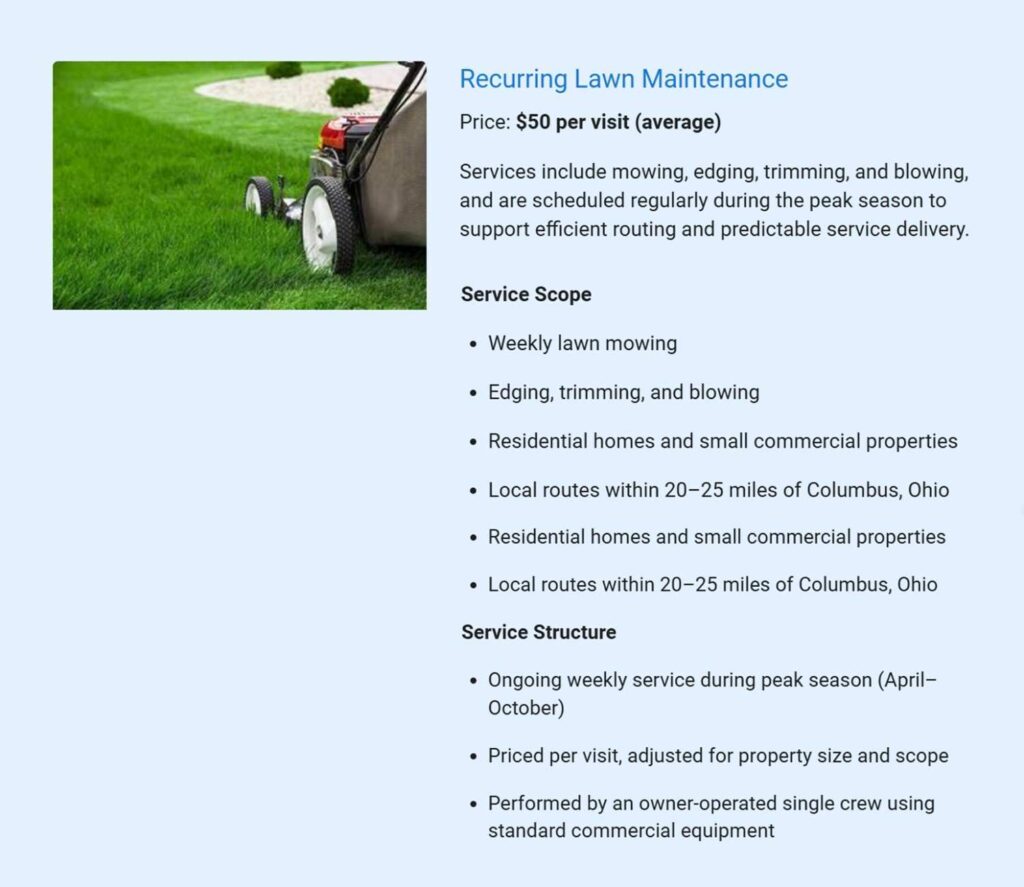
The core service that GreenEdge Landscaping LLC will provide to the market is weekly lawn care to homes and small businesses. These services include lawn mowing, edging, trimming, and blowing.
Recurrent maintenance contracts are the backbone of the business because of predictability, route efficiency, and low cost of acquiring customers as compared to one-time jobs. The majority of the recurring customers are attended to weekly within the peak operating period.
Seasonal and One-time Services (Secondary)
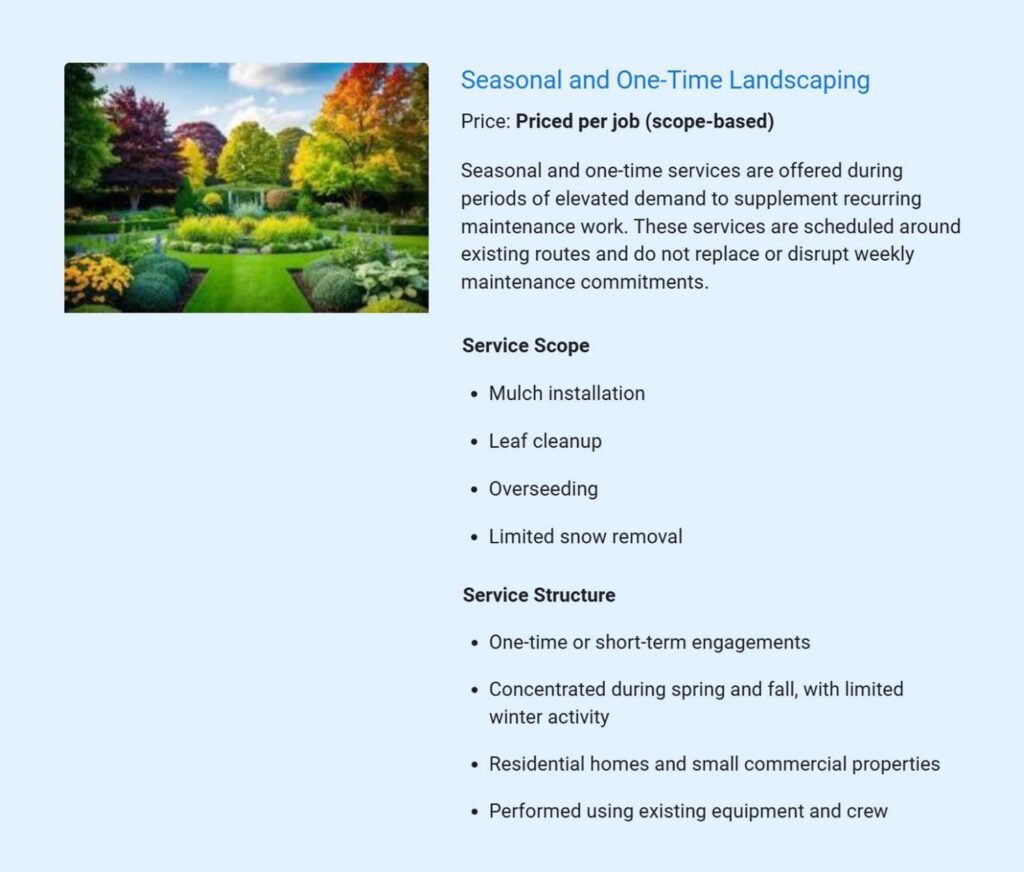
Besides the regular maintenance, the business also offers seasonal and one-time landscaping services when the demand is high. These services consist of mulch installation, leaf cleanup, overseeding, and limited snow removal.
Seasonal work is planned in accordance with the routes of maintenance performed and is not sought at the cost of the same service agreements. These services are sources of incremental revenue, but do not change the underlying operating structure.
Revenue Mix Logic
Recurring maintenance services are the largest portion of the annual revenue and are considered the main source of cash flow. One-time and seasonal services are added during the estimated ~30-35% of the total annual revenue and are clumped in spring and fall months. This combination helps maintain a stable base income and enables the business to take up more profitable seasonal opportunities without incurring additional costs.
Pricing Approach
Recurring maintenance visits are priced at an average of approximately $50 per service, based on property size, service scope, and local market rates. Seasonal services are priced per job according to labor requirements, materials, and disposal needs. Pricing assumptions are intentionally conservative, and the plan does not rely on aggressive price increases during the first 2 years of operation.
Contract Cadence and Payment Timing
Recurring maintenance clients are serviced on a weekly contract basis during the peak season, with billing occurring at the time of service or on short payment terms. Seasonal and one-time services are invoiced upon completion. The business assumes net-0 to net-15 collection timing, reflecting a residential-focused client base and minimizing exposure to delayed receivables.
Local Market Demand and Target Customers
GreenEdge Landscaping’s revenue model is built around locally based homeowner and small commercial demand for recurring outdoor maintenance services. National industry and consumer data confirm strong ongoing demand for these services, particularly among residential property owners.
Residential Homeowners Drive Core Demand
As mentioned earlier, the U.S. landscaping and lawn care industry is estimated to be over $180 billion in 2025, with residential maintenance accounting for a significant share of recurring service revenue. The industry remains highly fragmented, with more than 650,000 landscaping businesses nationwide, most of which operate at a local, owner-managed scale.
GreenEdge does not compete on scale or specialization. Instead, it positions itself as a local maintenance provider focused on a limited service radius. This mirrors how most residential landscaping demand is already served and allows the business to win clients based on availability, reliability, and proximity rather than price competition or branding spend.
Homeowner Willingness to Pay for Services
Industry statistics indicate that homeowners always spend money on lawn care and landscaping under outdoor property maintenance. Recent studies in the industry showed that the average American family spends around $503 yearly on lawn care and similar landscaping services, as a sign of both regular maintenance and other infrequent improvements.
About 40% of homeowners with a yard also utilize professional services at least some of the time for landscape or lawn maintenance. This expenditure justifies the demand for routine, repeat services such as the ones provided by GreenEdge Landscaping.
Behavioral and Local Preferences
In addition to pure spending data, consumer behavior patterns also help to underline the significance of curb appeal and the quality of outdoor spaces to homeowners. According to a recent national survey, most homeowners are under pressure to keep their yards looking nice, and they do spend time and money on appearance and exterior maintenance.
These behavioral drivers support the practical reasoning behind routine, recurrent services as compared to once-only projects, particularly in suburban and residential areas in the Columbus region.
For GreenEdge, this behavioral alignment supports:
- Increased retention rate as the homeowners believe in continuity rather than short-term upgrades.
- Reduced sales friction, as the service is dealing with an unresolved problem and not an optional upgrade.
- Scheduling and routing, which are a must in a single-crew operation, are predictable.
By matching service structure to homeowner behavior, GreenEdge converts general curb-appeal pressure into stable, repeat demand without expanding scope, pricing complexity, or operational risk.
Local Service Area Dynamics
The 20–25 mile service area surrounding Columbus, Ohio, includes a dense concentration of suburban residential neighborhoods. This development pattern supports consistent demand for routine lawn and landscape maintenance, particularly services performed on a weekly schedule.
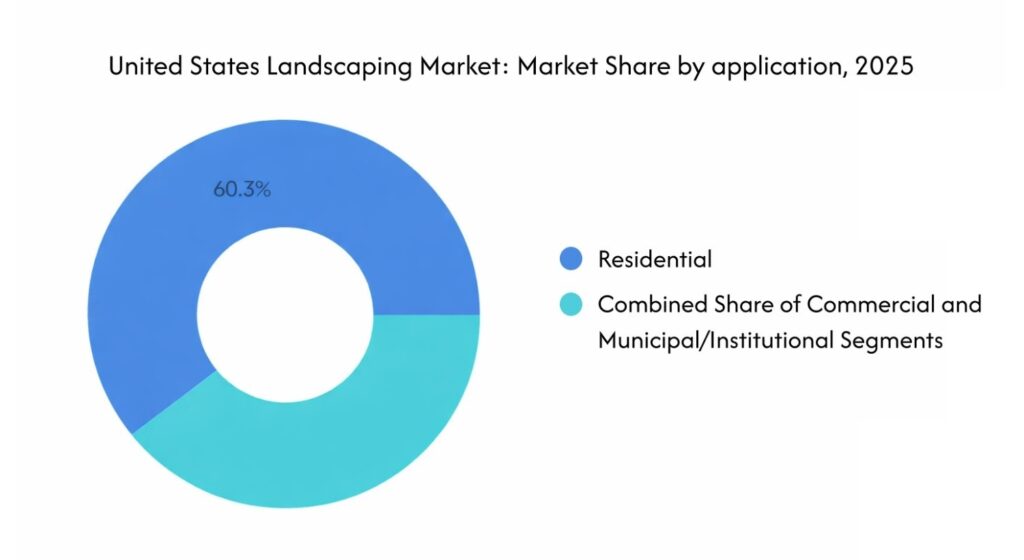
National landscaping market research shows that residential properties accounted for approximately 60% of the total U.S. landscaping market value in 2025. Within this segment, maintenance services such as lawn care represent the largest share of revenue, reflecting homeowner preference for recurring service contracts rather than one-time landscaping projects.
Together, these conditions support a stable demand base for recurring lawn maintenance within GreenEdge Landscaping’s defined service area, aligning local market characteristics with broader national demand patterns.
These conditions mirror broader national patterns where subscription-like recurring lawn care services have become a stable revenue source for small landscapers like GreenEdge.
Competitive Positioning
The American landscaping sector is extremely fragmented, and there is no dominating player in the market, even though the industry has a number of large national players. According to industry research by Mordor Intelligence, the concentration in the landscaping market remains low, with most services provided by small, local companies rather than consolidated national firms.
National companies like BrightView, TruGreen, and Davey Tree operate at scale, but their business models primarily focus on large commercial contracts, institutional properties, or specialized service segments.
Minimal-access residential routes that require frequent scheduling and neighborhood-level responsiveness are generally less profitable for these large operators, given higher coordination costs and thinner per-unit revenue. This means most recurring residential and small commercial maintenance is supplied by local landscapers.
Here are a few local competitors of GreenEdge:
| Competitor | Primary Focus | Service Scope | Positioning vs GreenEdge |
|---|---|---|---|
 |
Residential maintenance | Lawn mowing, mulch, seasonal cleanup | Similar service mix; operates across a wider service area with multiple crews |
 |
Residential + commercial | Maintenance, design, installation | Broader scope and higher complexity; less focused on small recurring routes |
 |
Commercial-heavy | Property maintenance, renovations | Larger contracts and commercial focus; not optimized for dense residential routes |
 |
Residential & small commercial | Lawn care, landscape maintenance | Established local provider with mixed job sizes |
 |
Design-build oriented | Landscape construction and maintenance | Project-based work; less emphasis on weekly recurring maintenance |
Local Housing Characteristics and Competitive Advantage
In the Columbus metropolitan region and its suburbs, a considerable proportion of housing is owner-occupied. Renting families tend to invest in continued exterior maintenance and retain service providers throughout their lives, whereas owner-occupied households tend to support recurring service relationships in place of one-time projects.
The service area includes many suburban neighborhoods with homeowner associations or informal standards that emphasize lawn appearance and regular upkeep. These conditions favor reliable weekly service and predictable scheduling over price competition, supporting providers that offer consistency and responsive communication.
Residential density in these neighborhoods allows smaller operators to build compact routes that reduce travel time and support consistent service schedules. This routing advantage improves cost control and responsiveness, areas where owner-operated businesses can compete more effectively than larger providers managing wider territories.
Marketing and Customer Acquisition Strategy
GreenEdge Landscaping’s marketing strategy is designed to support gradual route build-up within a fixed service area, rather than rapid customer acquisition. Marketing activity is paced to match single-crew capacity and seasonal demand.
Targeted Local Acquisition
Customer acquisition focuses on homeowners within the 20–25-mile service radius. Primary channels include:
- Google Business Profile and local search visibility
- Yard signage at serviced properties
- Customer referrals and neighborhood word-of-mouth
- Limited use of flyers and community boards
The plan assumes 2–4 new recurring maintenance clients per month during peak season, primarily driven by local visibility and referrals rather than paid advertising.
Marketing Spend Assumptions
Marketing expenses are intentionally modest and stable.
- Average monthly marketing spend: ~$400
- Annual marketing budget: ~$4,800–$6,000
- Spend is weighted toward peak season, with reduced activity during winter months
This level of spend is sufficient to maintain local awareness without generating demand beyond service capacity.
Conversion Focus on Recurring Services
The marketing activity is focused on turning new leads into weekly recurring maintenance accounts, which offer predictable revenues and efficiency in routes. Seasonal and one-time services are used selectively as entry points, with suitable properties encouraged to transition into ongoing maintenance when feasible.
The business does not assume aggressive conversion rates or rapid client onboarding. Client growth is expected to occur steadily as routes are built and service consistency is established.
Retention as a Growth Driver
Customer retention is a core component of the acquisition strategy. Direct owner communication, consistent service days, and reliable execution are relied upon to limit churn and generate referrals. Because recurring maintenance relationships are long-term in nature, retained clients reduce the need for ongoing marketing spend.
Operation Plan
Scope and Operating Boundaries
The company does not seek significant landscaping installations, multi-week construction jobs, or speedy geographical growth. This limited coverage will minimize operational risks, reduce the amount of capital required, and enable the predictability of timing and cash flow.
Owner’s Day-to-Day Role
GreenEdge Landscaping is an owner-managed company. The owner, Nolan Pierce, does on-site landscaping, weekly scheduling and routing, estimates, client communication, and billing and collections. He directly deals with all operational and financial decisions to retain control of the quality of service and cost.
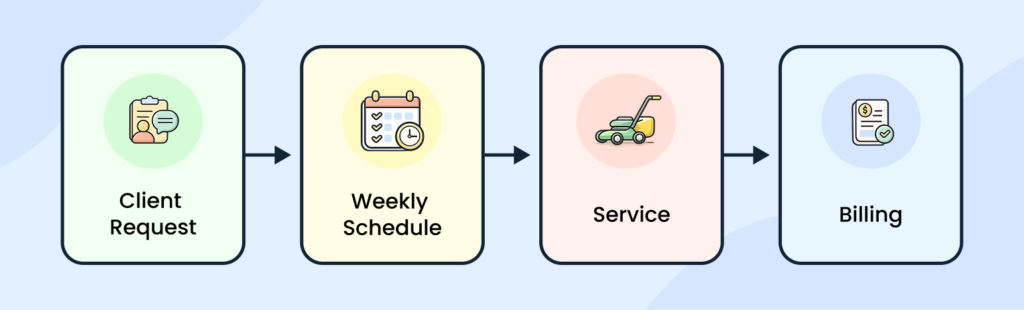
Weekly Scheduling and Routing
Services are scheduled on a weekly cadence during the peak operating season. Clients are bundled into small routes within the specified service area in order to minimize travel time and fuel consumption. The routing decisions are made on the basis of consistency, where properties of the same type are serviced on the same days of the week whenever achievable.
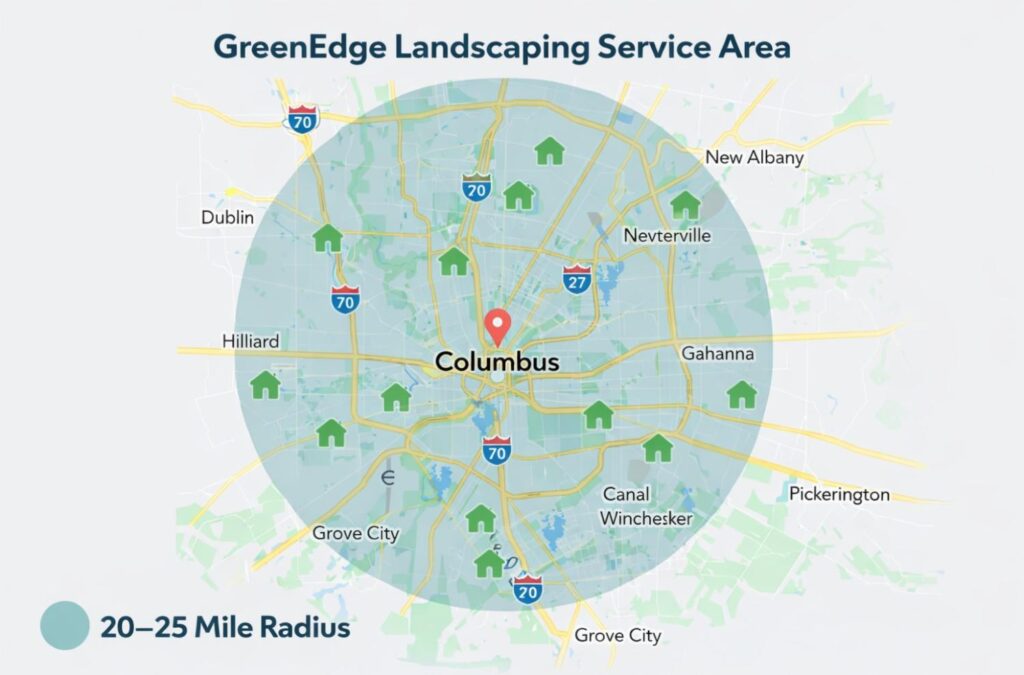
*Illustrative service area showing a 20–25 mile operating radius centered on Columbus, Ohio. The compact service area supports efficient weekly routing and cost control.
Peak vs Off-Season Operations
The peak operations are between April and October when weekly maintenance routes are operational, and the most common are seasonal services. The off-season decreases the activity of service because of adverse weather conditions. Winter activities involve limited services, maintenance of equipment, administration, and the next season preparation as opposed to the complete deployment of routes.
Seasonal Labor Usage and Limits
A part-time hourly laborer is hired during peak months only when workload volume exceeds what the owner can reasonably handle alone. Labor is used strictly for field support and is scheduled on a job-by-job basis. No full-time employees or second crew are planned within the first three years of operation.
Equipment Usage and Storage
The business operates with a single set of core equipment, including a used pickup truck, utility trailer, commercial mower, trimmer, and blower. Equipment is used across both recurring and seasonal services. Storage is maintained at a small yard or designated storage location, with no separate facility required.
Customer Communication and Collections
Customer communication is handled directly by the owner through phone, text, or email to manage scheduling updates, service confirmations, and issue resolution. Billing is simple and immediate, with most services invoiced at the time of completion or on short payment terms.
Collections are assumed at net-0 to net-15, reflecting a residential customer base and minimizing exposure to delayed payments or complex invoicing.
Cost Structure and Economics
GreenEdge Landscaping’s cost structure emphasizes variable costs over fixed obligations to limit financial risk during uneven demand. Because most direct expenses are incurred only when work is performed, costs decline naturally during weather delays or seasonal slowdowns, reducing pressure on cash flow.
Fixed expenses are kept minimal and predictable. The business avoids full-time payroll, multiple crews, and facility-based leases that would require consistent revenue regardless of workload. This approach protects downside performance by ensuring the business does not need to maintain high monthly sales levels simply to cover overhead.
Projected margins may appear elevated relative to larger landscaping firms, particularly in the first year. This is driven by the owner-operator structure, where the owner’s labor is not fully expensed in Year 1 and is introduced gradually in later years. As owner compensation increases, margins normalize while cash flow remains stable. These margins reflect operational efficiency and cost control rather than scale-driven advantages.
Cost Classification Framework
Costs are deliberately separated to track job-level profitability and control overhead.
Cost of Goods Sold (COGS)
Direct costs that vary with service volume:
- Job materials (mulch, seed, seasonal supplies)
- Disposal fees
- Fuel directly tied to job execution
- Hourly field labor used during peak periods
- Job-specific rentals (if required)
Operating Expenses (OPEX)
Overhead costs that exist regardless of job volume:
- Insurance (general liability and auto)
- Marketing and advertising
- Software and administrative costs
- Fixed vehicle and equipment expenses (non-job-related)
- Yard or storage costs
- Owner compensation (once initiated)
Variable Cost Behavior During Peak Season
During the peak operating season, variable costs increase in proportion to service volume.
Peak season (April–October):
- Variable costs increase with weekly routes and seasonal jobs
- Hourly labor is added only when the workload exceeds the owner’s capacity
- No permanent payroll commitments
Off-season (November–March):
- Job-related costs decline sharply
- Labor usage is minimal or eliminated
- Fixed costs remain limited and manageable
This structure allows expenses to contract naturally during slower months without forcing revenue targets.
| Cost Category | Nature of Cost | Behavior | Management Approach |
|---|---|---|---|
| Materials & disposal | Variable (COGS) | Scales with jobs | Purchased per job |
| Job-related fuel | Variable (COGS) | Route-dependent | Controlled via routing |
| Hourly field labor | Variable (COGS) | Seasonal only | No full-time staff |
| Insurance | Fixed (OPEX) | Year-round | Predictable monthly cost |
| Marketing | Semi-fixed (OPEX) | Adjustable | Reduced off-season |
| Vehicle & equipment (fixed portion) | Fixed (OPEX) | Year-round | Preventive maintenance |
| Owner compensation | Discretionary (OPEX) | Deferred initially | Introduced after stabilisation |
Break-Even Considerations
Because the business avoids full-time labor, multiple crews, and dedicated facilities, fixed monthly expenses remain low relative to revenue capacity during the operating season.
Recurring maintenance routes provide a predictable baseline income, while variable costs rise only when revenue is generated. This relationship supports early operating break-even during peak months without requiring aggressive growth.
Owner Compensation Treatment
The owner does not take compensation in Year 1 to preserve working capital and reduce fixed obligations during startup. Modest owner compensation begins in Year 2 and increases gradually as recurring routes stabilize. Owner pay is treated as discretionary rather than structural, reflecting the owner-operator nature of the business.
Startup Costs and Funding Plan
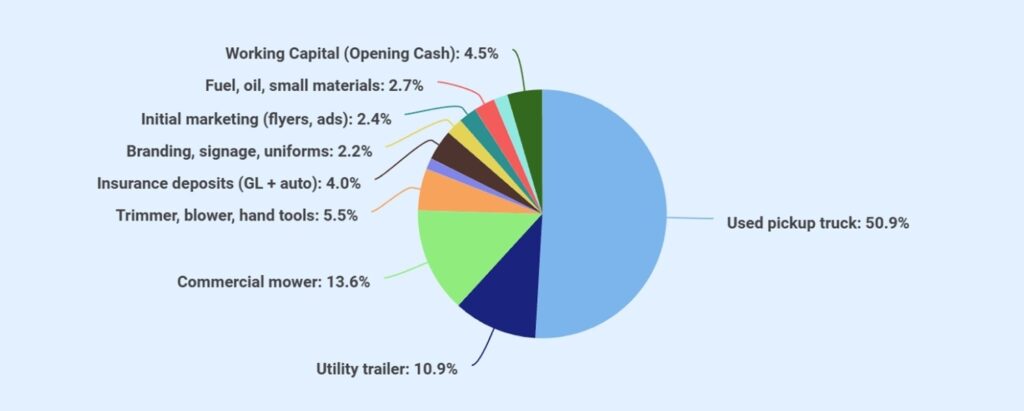
The startup budget of GreenEdge Landscaping is designed to cover the initial operations in the field and maintain minimal obligations upfront. Startup expenditure is directed toward the necessary equipment, setup costs, and a small cash cushion to address early running variability.
Capital Equipment Purchases
The business launches with a single set of core equipment sized for one crew.
Capital equipment includes:
- Used pickup truck
- Utility trailer
- Commercial mower
- Trimmer, blower, and basic hand tools
All equipment purchases are intended to support routine maintenance and seasonal services without assuming early expansion or additional crews.
Pre-Launch and Setup Costs
Pre-launch expenses cover regulatory requirements and basic market entry needs.
Setup costs include:
- Business registration and local licensing
- Insurance deposits (general liability and auto)
- Branding, signage, and uniforms
- Initial local marketing and advertising
These costs are one-time in nature and do not materially increase monthly overhead.
Opening Working Capital
Opening working capital is included to support:
- Fuel and consumable supplies
- Minor equipment servicing
- Early operating cash needs during route build-up
The working capital amount is intentionally limited, reflecting short billing cycles and a low fixed-cost structure.
| Category | Cost ($) |
|---|---|
| Vehicles & Major Equipment (capitalised) | |
| Used pickup truck | 28,000 |
| Utility trailer | 6,000 |
| Commercial mower | 7,500 |
| Trimmer, blower, hand tools | 3,000 |
| Subtotal – Vehicles & Equipment | 44,500 |
| Pre-Launch & Setup | |
| Business registration & licenses | 800 |
| Insurance deposits (GL + auto) | 2,200 |
| Branding, signage, uniforms | 1,200 |
| Initial marketing (flyers, ads) | 1,300 |
| Subtotal – Pre-Launch | 5,500 |
| Opening Supplies & Deposits | |
| Fuel, oil, and small materials | 1,500 |
| Yard/office setup & storage | 1,000 |
| Subtotal – Supplies & Deposits | 2,500 |
| Working Capital (Opening Cash) | 2,500 |
| Total Startup Costs | 55,000 |
Source of Funds
| Funding Source | Amount ($) |
|---|---|
| Bank term loan (Fifth Third Bank) | 50,000 |
| Owner cash contribution | 5,000 |
| Total Funding | 55,000 |
Loan Structure Assumptions
The bank loan is assumed to follow standard small-business lending terms:
- Term length of 5 to 7 years
- Fixed interest rate of approximately 8.5%
- Standard amortization schedule
- Loan proceeds applied primarily to equipment and startup expenses
These assumptions are used for planning purposes and reflect common terms for owner-operated service businesses.
Does your plan sound generic?
Refine your plan to adapt to investor/lender interests
Financial Plan
The budget below is a 3-year projection that is conservative and based on an owner-operated, one-crew operating model of GreenEdge Landscaping LLC. The forecasts include realistic client ramp-up, seasonal demand, and cost behavior assumptions, and are not meant to represent aggressive growth, but the dynamics of the cash flow and financial viability.
Core Financial Assumptions (Lender-Only)
| Category | Assumption |
|---|---|
| Operating season | Peak: April–October; Off-season: November–March |
| Recurring clients (average during peak) | 55–65 (Year 1); ~70–80 (Year 2); ~85–95 (Year 3) |
| Average maintenance pricing | ~$50 per visit |
| Service frequency | Weekly during peak season |
| Seasonal revenue share | ~30–35% of annual revenue |
| Cost structure | Variable COGS tied to jobs; limited fixed overhead |
| Owner compensation | $0 in Year 1; modest draw begins in Year 2 |
| Collection timing | Net-0 to Net-15 |
| Loan amount | $50,000 term loan |
| Loan terms | 5–7 years; ~8.5% fixed interest |
| Profit profile | Near break-even Year 1; improved profitability Years 2–3 |
*Year 1 recurring revenue reflects a ramp-up in weekly clients over the peak season rather than a fixed client count throughout the year.
Income Statement
| Year 1 ($) | Year 2 ($) | Year 3 ($) | |
|---|---|---|---|
| Revenue | |||
| Recurring Maintenance Services | 96,000 | 150,000 | 198,000 |
| Seasonal & One-Time Jobs | 44,000 | 55,000 | 66,000 |
| Total Revenue | 140,000 | 205,000 | 264,000 |
| Cost of Goods Sold (COGS) (job materials, disposal fees, job-variable fuel, hourly field labor) | |||
| Materials & Disposal Fees | 16,800 | 23,500 | 29,000 |
| Job-Variable Fuel | 10,000 | 13,000 | 16,000 |
| Part-Time Field labor (Hourly) | 28,000 | 35,000 | 42,000 |
| Total COGS | 54,800 | 71,500 | 87,000 |
| Gross Profit | 85,200 | 133,500 | 177,000 |
| Gross Margin | 60.9% | 65.1% | 67.0% |
| Operating Expenses (OPEX) | |||
| Owner Compensation | 0 | 36,000 | 48,000 |
| Insurance (GL + Auto) | 3,300 | 3,500 | 3,700 |
| Marketing & Advertising | 4,800 | 5,400 | 6,000 |
| Software & Admin | 1,200 | 1,300 | 1,400 |
| Fixed Vehicle & Equipment Costs | 3,000 | 3,300 | 3,600 |
| Yard / Storage / Office | 2,400 | 2,500 | 2,600 |
| Total Operating Expenses | 14,700 | 52,000 | 65,300 |
| EBITDA | 70,500 | 81,500 | 111,700 |
| EBITDA Margin | 50.4% | 39.8% | 42.3% |
| Depreciation | 8,900 | 8,900 | 8,900 |
| EBIT | 61,600 | 72,600 | 102,800 |
| Interest Expense | 4,200 | 3,400 | 2,600 |
| Net Income (Pre-Tax) | 57,400 | 69,200 | 100,200 |
Cash Flow Statement
| Year 1 ($) | Year 2 ($) | Year 3 ($) | |
|---|---|---|---|
| Operating Activities | |||
| Net Income (Pre-Tax) | 57,400 | 69,200 | 100,200 |
| Add: Depreciation (non-cash) | 8,900 | 8,900 | 8,900 |
| Change in Working Capital | (6,000) | (4,000) | (3,000) |
| Net Cash from Operations | 60,300 | 74,100 | 106,100 |
| Investing Activities | |||
| Capital Expenditures | (52,000) | (2,000) | (2,000) |
| Net Cash from Investing | (52,000) | (2,000) | (2,000) |
| Financing Activities | |||
| Loan Proceeds | 50,000 | 0 | 0 |
| Owner Equity Contribution | 5,000 | 0 | 0 |
| Loan Principal Repayment | (8,500) | (8,500) | (8,500) |
| Owner Distributions | 0 | (15,000) | (25,000) |
| Net Cash from Financing | 46,500 | (23,500) | (33,500) |
| Net Change in Cash | 54,800 | 48,600 | 70,600 |
| Beginning Cash | 2,500 | 57,300 | 105,900 |
| Ending Cash | 57,300 | 105,900 | 176,500 |
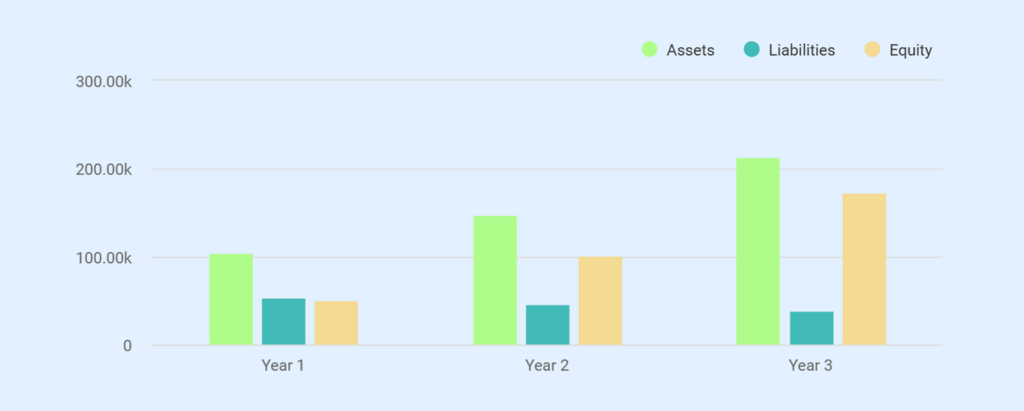
Balance sheet
| Year 1 ($) | Year 2 ($) | Year 3 ($) | |
|---|---|---|---|
| Assets | |||
| Cash | 57,300 | 105,900 | 176,500 |
| Accounts Receivable | 3,000 | 4,000 | 5,000 |
| Prepaid Expenses | 1,500 | 1,700 | 1,900 |
| Total Current Assets | 61,800 | 111,600 | 183,400 |
| Vehicles & Equipment (Gross) | 52,000 | 54,000 | 56,000 |
| Accumulated Depreciation | (8,900) | (17,800) | (26,700) |
| Net Fixed Assets | 43,100 | 36,200 | 29,300 |
| Total Assets | 104,900 | 147,800 | 212,700 |
| Liabilities | |||
| Accounts Payable & Accruals | 4,000 | 5,000 | 6,000 |
| Current Portion of Term Loan | 8,500 | 8,500 | 8,500 |
| Long-Term Term Loan | 41,500 | 33,000 | 24,500 |
| Total Liabilities | 54,000 | 46,500 | 39,000 |
| Equity | |||
| Owner Capital Contribution | 5,000 | 5,000 | 5,000 |
| Retained Earnings | 45,900 | 96,300 | 168,700 |
| Total Equity | 50,900 | 101,300 | 173,700 |
| Liabilities + Equity | 104,900 | 147,800 | 212,700 |
*Certain vehicle-related costs, such as registration, sales taxes, upfitting, and initial repairs, are capitalized as part of Vehicles & Equipment in accordance with standard accounting practice. These costs are included in total capital expenditures but may not be itemized separately in startup cost summaries.
Break-Even Analysis
| Metric | Value / Range |
|---|---|
| Monthly Fixed Operating Costs (OPEX) | $1,200 – $1,400 |
| Owner compensation (averaged) | $0 (Yr 1), ~$3,000 (Yr 2+ absorbed separately) |
| Insurance (GL + auto) | ~$275 |
| Marketing & advertising | ~$400 |
| Software & admin | ~$100 |
| Fixed vehicle & equipment costs | ~$250 |
| Yard/storage/office | ~$200 |
| Fixed Cost Base Used | ~$1,300 / month |
| Variable Cost Ratio (COGS % of Revenue) | ~38–42% |
| Job materials & disposal | ~12% |
| Job-variable fuel | ~7% |
| Hourly field labor | ~20–23% |
| Contribution Margin | ~58–62% |
| Base Monthly Break-Even Revenue | ~$2,100 – $2,300 |
| Conservative break-even point | ~$2,300 |
| Optimistic low-end break-even | ~$2,100 |
| Annualized break-even revenue | $25,200 – $27,600 |
| Avg. Monthly Revenue — Year 1 | ~$11,700 |
| Avg. Monthly Revenue — Year 2 | ~$17,100 |
| Avg. Monthly Revenue — Year 3 | ~$22,000 |
Break-Even and Cash Sensitivity
GreenEdge Landscaping’s break-even profile is shaped by its owner-operated structure and limited fixed overhead. The company eliminates the need to make permanent labor commitments, multiple crews, and facility-related costs, which reduces monthly fixed costs in comparison to the service capacity during peak season.
Key break-even drivers
- Fixed operating costs remain limited due to the absence of full-time staff and dedicated facilities
- Variable costs scale directly with service volume and can be adjusted quickly during weather disruptions
- Recurring maintenance routes provide a predictable baseline of monthly revenue during the operating season
Seasonal break-even behavior
- Break-even is typically achieved early in the peak season as weekly routes stabilize
- Off-season months may operate below break-even without placing pressure on liquidity
- Seasonal services provide incremental revenue without increasing fixed costs
Cash sensitivity and buffer
- Cash balances are intentionally built during peak months
- Reserves are used to absorb seasonal revenue declines
- The company does not use short-term borrowing to finance the off-season cash requirements.
This structure gives the business room to run on a lean budget, but without compromising on adequate liquidity over seasonal periods.
Business Ratios
| Ratio | Year 1 | Year 2 | Year 3 |
|---|---|---|---|
| Gross Margin | 60.9% | 65.1% | 67.0% |
| EBITDA Margin | 50.4% | 39.8% | 42.3% |
| Net Margin (Pre-Tax) | 41.0% | 33.8% | 38.0% |
| COGS as % of Revenue | 39.1% | 34.9% | 33.0% |
| OPEX as % of Revenue | 10.5% | 25.4% | 24.7% |
| Current Ratio | 1.14x | 2.40x | 4.70x |
| Cash Coverage (Months of OPEX) | ~4.6 | ~7.0 | ~9.7 |
| Debt-to-Equity | 1.06x | 0.46x | 0.22x |
| Debt-to-EBITDA | 0.71x | 0.41x | 0.22x |
| Interest Coverage (EBIT / Interest) | 14.7x | 21.4x | 39.5x |

Don’t waste time using spreadsheets
Simplify financial forecasting & reporting w/ Upmetrics
Risks and Practical Mitigations
GreenEdge Landscaping is a seasonal and service-oriented business where predictable threats are mostly operational in nature. The business model is designed in such a way that it restricts exposure with a limited scope, adaptable labor utilization, and low fixed costs.
Weather Variability
The weather variability is the closest operational risk that might occur, especially during the growing season, when the scheduled services are likely to be affected, either by rain or extreme conditions.
To reduce this exposure, GreenEdge provides flexible weekly scheduling and also focuses on the recurrent routes. Thus, the missed services can be carried out within the same service window once the conditions improve. No single weather activity is dependent upon, since seasonal services are planned opportunistically.
Equipment Downtime
Since service delivery requires minimal core equipment, unforeseen downtimes may limit capacity temporarily.
This risk is handled by using standard and easily maintainable equipment, periodic preventive maintenance, and conservative daily use. Repair and maintenance costs are incorporated into operating assumptions to avoid cash strain when issues arise.
Labor Availability
Labor availability during peak months can constrain workload for small operators. GreenEdge mitigates this risk by designing the business such that owner labor is the first priority, and part-time hourly services are only hired when the business is too big to handle by the owner.
This will lower the dependency on constant access to labor and eliminate fixed payroll expenses that may be unwieldy in slow seasons.
Seasonal Revenue Gaps
Landscaping businesses in the Midwest regions are known to have seasonal revenue gaps. GreenEdge responds to this risk by staying structurally low in fixed costs and deliberately accumulating cash reserves in the high-month periods.
A low-intensity service, equipment maintenance, and administrative planning are prioritized in off-season operations that enable the business to run in the winter period without short-term funding.
Customer Churn
Customer churn is a more long-term threat, since the loss of repeat buyers can decrease route efficiency and minimum revenue. The company addresses this by focusing on regular service delivery, regular timelines, and communication between owners.
The emphasis on routine maintenance over one-time projects favors more lasting relationships with the clients and minimizes the volatility of revenues.
Owner Dependency
As an owner-operated business, GreenEdge is dependent on the owner’s availability for daily operations. This risk is managed by keeping the scope of services narrow, avoiding overcommitment, and using part-time labor to provide limited operational support during high-demand periods.
The business does not pursue growth strategies that would increase operational strain beyond what the owner can reasonably manage.
The Quickest Way to turn a Business Idea into a Business Plan
Fill-in-the-blanks and automatic financials make it easy.

Vinay Kevadia
Vinay Kevadiya is the founder and CEO of Upmetrics, the #1 business planning software. His ultimate goal with Upmetrics is to revolutionize how entrepreneurs create, manage, and execute their business plans. He enjoys sharing his insights on business planning and other relevant topics through his articles and blog posts. Read more