Executive Summary
Willow & Thread Studio LLC is a home-based, direct-to-consumer women’s boutique apparel company offering a small, curated assortment of comfortable everyday wardrobe items with consistent fit and minimal design.
The business operates entirely online through a Shopify storefront and is intentionally structured as a sole, founder-managed operation to keep overhead and operational complexity tightly controlled.
It offers a small set of versatile styles at a price range of between $18 and $58, without any seasonal trends, with an emphasis on a consistent fit and repeat buying.
Revenue is driven primarily by core apparel sales. Limited-edition drops support repeat visits while keeping permanent inventory limited. The average order value is approximately $74, and gross margins average 45%.
The founder, Emily Carter, has relevant experience with the Everlane Commerce Group, where she has been employed in areas such as online orders, customer communication, returns, and inventory management. This directs the operational needs of direct to consumer apparel company.
Business Model
The boutique will launch with 14 SKUs, which will include 12 main apparel items and 2 accessories. The brand focuses on wearable neutral basics priced between $18 and $58. The average order value is approximately $74, with most customers purchasing two items per order.
Revenue is generated from two streams: ongoing online product sales and limited-edition drops released seasonally. Projected revenue is $57,000 in year one, increasing to $74,000 in year 2 and $93,000 in year 3.
Startup Costs and Funding
Total startup funding required is $25,500, funded through owner contribution and a small business term loan.
| Source | Amount | Share |
|---|---|---|
| Owner contribution | $7,000 | 27.5% |
| Small business loan | $18,500 | 72.5% |
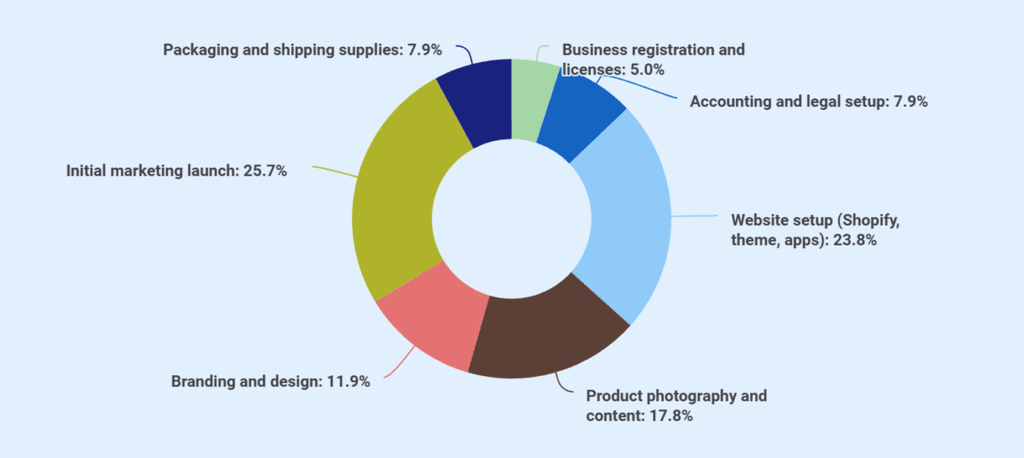
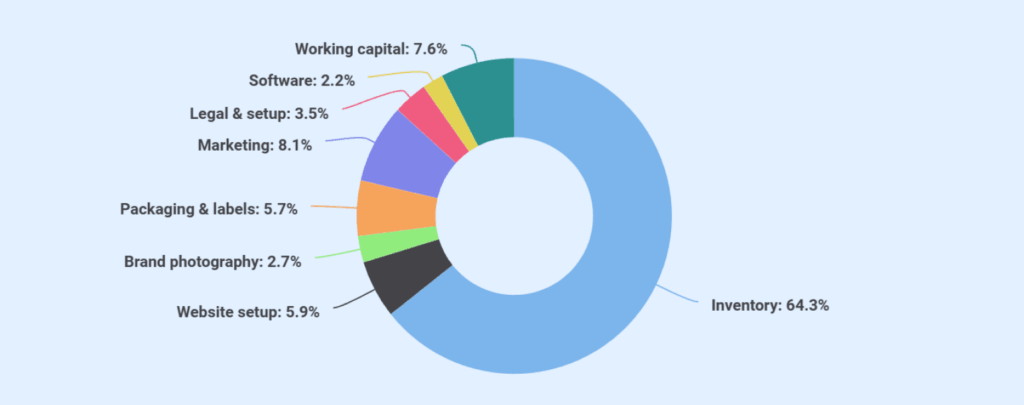
Startup funds are allocated to inventory ($11,900), website and ecommerce setup ($1,200), branding and photography ($1,500), marketing launch ($1,300), packaging and shipping materials ($400), professional fees ($400), and working capital reserve ($1,400).
Loan Request
Willow & Thread Studio requests an $18,500 small business term loan from OnPoint Community Credit Union as part of a $25,500 total startup funding plan.
| Term | Detail |
|---|---|
| Amount | $18,500 |
| Term | 5 years |
| Interest rate | 10.5% |
| Monthly payment | ~ $395 |
Break-Even and Profitability
With a gross margin of approximately 45% and total monthly fixed cash outflows of about $2,045 (operating costs plus loan repayment), break-even occurs at roughly $4,550 in monthly revenue, or about 62 orders per month. Profitability improves gradually through repeat customer behavior and stable operating efficiency within a controlled scale.
| Metric | Amount |
|---|---|
| Average order value | $74 |
| Gross margin | 45% |
| Monthly fixed costs | $2,045 |
| Break-even revenue | $4,550/month |
| Break-even orders | 62 orders/month |
Growth is intentionally capped by founder capacity. Willow & Thread is not designed for rapid scaling, wholesale expansion, or third-party marketplace selling. The operating model is based on the principles of sustainability, predictable cash flow, and strict management of inventories rather than the maximum growth in revenues. Debt service and cash stability are still of more importance than any owner compensation and discretionary expenditure.

Does your plan sound generic?
Refine your plan to adapt to investor/lender interests
Company Overview
Willow & Thread Studio LLC is a single-member limited liability company registered in Oregon. The business operates as an online-only women’s apparel brand, selling directly to customers through its Shopify website and Instagram Shop. All operations are managed from a home-based office in Portland, Oregon.
The store sells easy-going, everyday styles for women with a simple, relaxed style. The product mix prioritizes wearable basics and layering pieces rather than trend-driven or seasonal fashion.
Operating Philosophy
The controlled product range is intended to limit inventory risk, protect cash flow, and allow time to refine branding and customer experience before any expansion. The operating approach favors planned, controlled growth rather than rapid expansion.
It is a philosophy that influences the operational decisions: small initial stock (about 350 to 380 units), small SKU count (14 items at launch), the concentration of restocking on proven sellers, and no deep size or color range in year 1.
Legal Structure
The single-member LLC structure provides liability protection while maintaining tax simplicity. All business income is reported on the owner’s personal tax return. Oregon requires annual report filing and maintains a relatively low regulatory burden for home-based ecommerce businesses.
Ownership
The Willow & Thread Studio’s only owner and operator is Emily Carter. Previously, she worked in customer operations and fulfillment at Everlane Commerce Group, handling online orders, customer communication, returns, and inventory coordination. This experience directly supports the operational requirements of a direct-to-consumer apparel business.
Simultaneously, she was running a personal online presence dedicated to style and wardrobe essentials with a fashion focus. The brand positioning and business model are informed by the combination of operational experience and audience familiarity.
No employees are planned in year 1. The business is designed to operate within a single person’s capacity.
Startup Summary
The business requires $25,500 in total startup capitalization, consisting of owner equity and a small business term loan. These funds support initial operating setup, inventory acquisition, and a modest working capital reserve.
Total uses of funds at launch amount to $18,350, covering startup expenses, initial inventory, and working capital reserve. And around $7,150 remains short-term operating liquidity. The remaining capital provides a conservative cash buffer to support early operations and loan servicing during the initial months.
| Item | Amount |
|---|---|
| Startup expenses to fund | $5,050 |
| Startup assets to fund | $11,900 |
| Working capital reserve | $1,400 |
| Total Funding Required | $18,350 |
Startup Expenses
| Category | Amount |
|---|---|
| Business registration and licenses | $250 |
| Accounting and legal setup | $400 |
| Website setup (Shopify, theme, apps) | $1,200 |
| Product photography and content | $900 |
| Branding and design | $600 |
| Initial marketing launch | $1,300 |
| Packaging and shipping supplies | $400 |
| Total Startup Expenses | $5,050 |
Startup Assets
| Category | Amount |
|---|---|
| Initial inventory purchase | $11,900 |
| Total Startup Assets | $11,900 |
Funding Sources
| Source | Amount | Share |
|---|---|---|
| Owner contribution | $7,000 | 27.5% |
| Small business loan | $18,500 | 72.5% |
| Total Funding | $25,500 | 100% |
Owner capital of $7,000 represents a meaningful personal commitment. The 27.5% equity contribution demonstrates a financial stake in the business outcome, not reliance solely on borrowed funds.
The working capital reserve of $1,400 provides approximately six weeks of operating expenses as a buffer against slower-than-projected early sales.
Key-Person Acknowledgment
As a solo-founder business, Willow & Thread Studio depends entirely on the owner’s capacity. Mitigations include realistic workload expectations, no forced growth targets, and documented processes for fulfillment and customer service. If demand exceeds solo capacity, the response is selective restocking and waitlists rather than overextension.
Products & Pricing
Launch Collection
Willow & Thread Studio will be opened under 14 SKUs: 12 main pieces of clothing and 2 accessories. The brand focuses on comfortable everyday wear in a neutral color scheme and is non-seasonal.
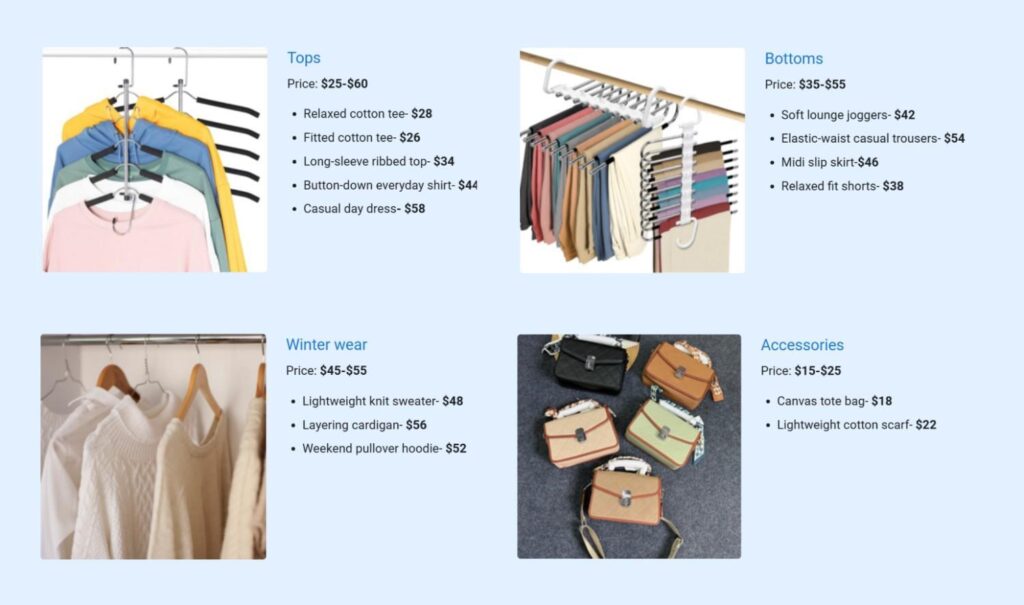
Accessories increase cart value without heavy inventory investment. They complement apparel purchases and encourage larger orders.
Pricing and Order Behavior
The pricing is between $18 and $58, and this puts the brand in the affordable quality segment. On average, customers buy two products with each order. Common combinations include:
- Tee and joggers
- Top and skirt
- Dress and tote
The average order value is about $74. Each order has a gross profit of about 30 before operating costs at a gross level of 45%.
Inventory Strategy
Opening inventory consists of approximately 350 to 380 units, with 20 to 40 units per SKU, depending on the item. Initial inventory represents the largest startup expense, totaling $11,900.
Inventory strategy is intentionally conservative: limited depth per style, close monitoring of sales velocity through Shopify, selective restocking of the top four to five sellers, and no expansion into additional colors or sizes during year 1. This approach protects cash flow and reduces the risk of markdown-driven margin erosion.
Suppliers
Goods are obtained from small batches of manufacturers in Los Angeles and Vietnam that are conducive to low minimum orders. The suppliers are chosen according to the criteria of constant fit during production cycles, quality of fabrics, and lead times. Relationships are non-exclusive, allowing flexibility to switch manufacturers if quality or reliability declines.
Brand Positioning
Willow & Thread does not compete on price or selection breadth. The market has abundant cheap basics and an overwhelming variety. Competing there requires scale and marketing spend that this business cannot support.
Instead, the brand competes on:
- Taste: A clear, cohesive aesthetic rather than everything for everyone
- Fit consistency: Reliable sizing across styles and production batches
- Brand feel: Calm, minimal presentation that resonates with the target customer
- Customer trust: Honest product descriptions, real measurements, responsive service
In niche fashion, customers buy into values and aesthetics as much as the physical product. The brand experience is part of what they pay for.
Customer Experience Focus
Brand investment goes beyond product into presentation and interaction:
- Simple website navigation without clutter
- Clear sizing guides with actual measurements
- Founder-written thank-you notes in early orders
- Considerable recyclable packaging.
- Easy order tracking and fast dispatch timelines.
- Simple return process.
The start-up costs of packaging and shipping are estimated at $750, and ongoing costs are estimated at approximately $300 per month (packaging, supplies, and shipping subsidies combined).
Limited Edition Drops
In addition to the core collection, the business plans limited edition drops released seasonally. These releases create urgency and encourage repeat purchasing. In the first year, limited-edition drops are projected to generate $9,000 in revenue in year 1, increasing to $12,000 in year 2 and $15,000 in year 3. This revenue stream is supplementary and not relied upon for baseline operating performance.
Market & Customer
Target Customer
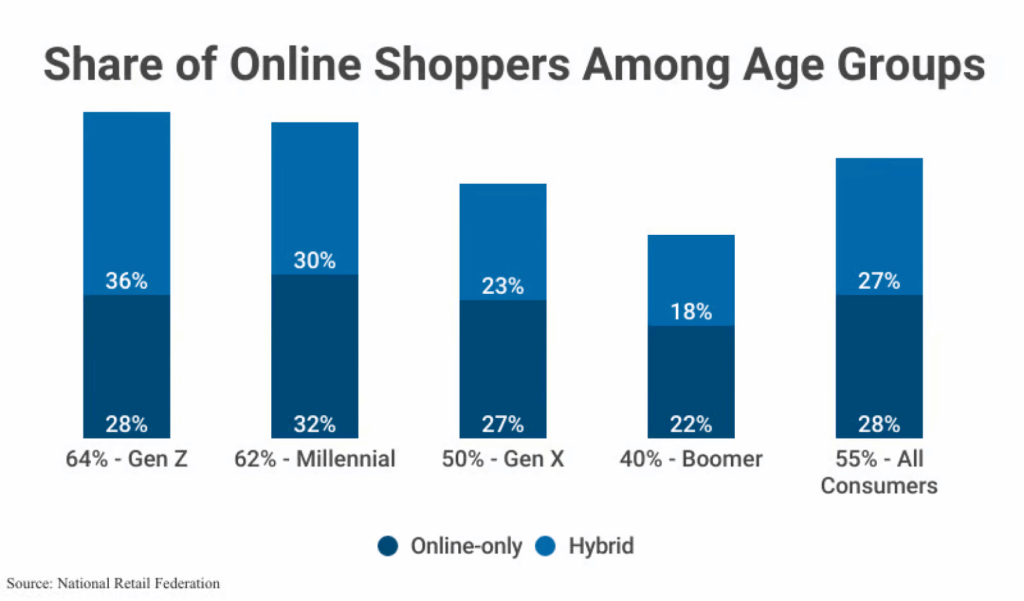
This data shows that Millennials and Gen Z account for a significant share of online apparel shoppers, with strong participation in both online-only and hybrid shopping behavior. These age groups represent a core segment of consumers who are comfortable purchasing clothing online and returning to familiar brands once fit and quality expectations are met.
Willow & Thread targets women between the ages of 24 and 40, who sit at the intersection of older Millennials and younger Gen Z shoppers. Online apparel remains one of the most frequently purchased ecommerce categories within these age groups, supporting sustained demand for well-defined, direct-to-consumer clothing brands.
The target customer values comfort, fit, and a cohesive wardrobe rather than constant product novelty.
| Characteristic | Profile |
|---|---|
| Age range | 24 to 40 |
| Income | Moderate, values quality over quantity |
| Shopping behavior | Online, follows small brands on Instagram and Pinterest |
| Style preference | Neutral palettes, minimal aesthetic, comfort-focused |
| Purchase motivation | Building a functional wardrobe, not chasing trends |
This customer is not looking for endless options. She wants a clear point of view and products she can trust to fit consistently.
Market Reality

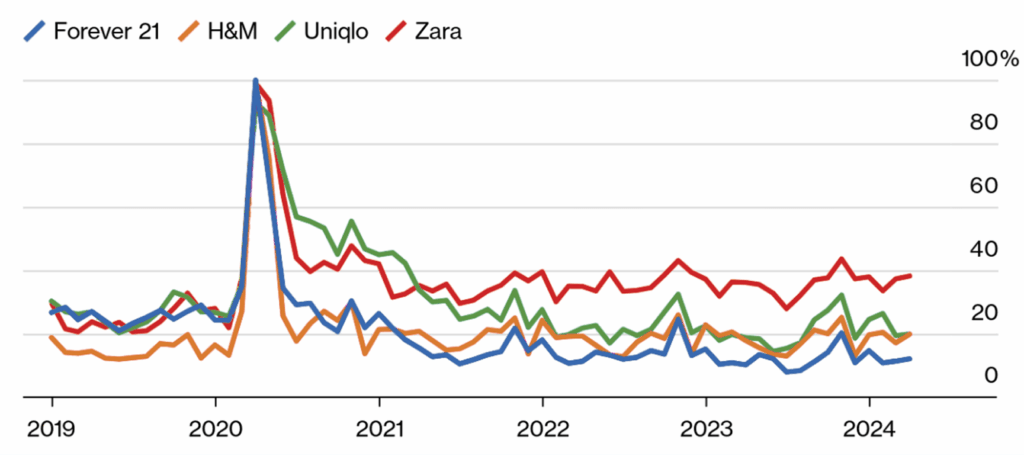
Online fashion is highly crowded. Low barriers to entry have led to a rapid increase in the number of online apparel brands, intensifying competition for customer attention and loyalty. New brands are launched continuously, making differentiation and customer trust more difficult to achieve without clear positioning and disciplined execution.
Most new online boutiques fail for predictable, operational reasons rather than a lack of demand:
- Undifferentiated products in an oversaturated market
- Marketing spend that grows faster than revenue
- Inventory purchases driven by assumptions rather than proven demand
- Attempts to serve broad audiences instead of a clearly defined customer segment
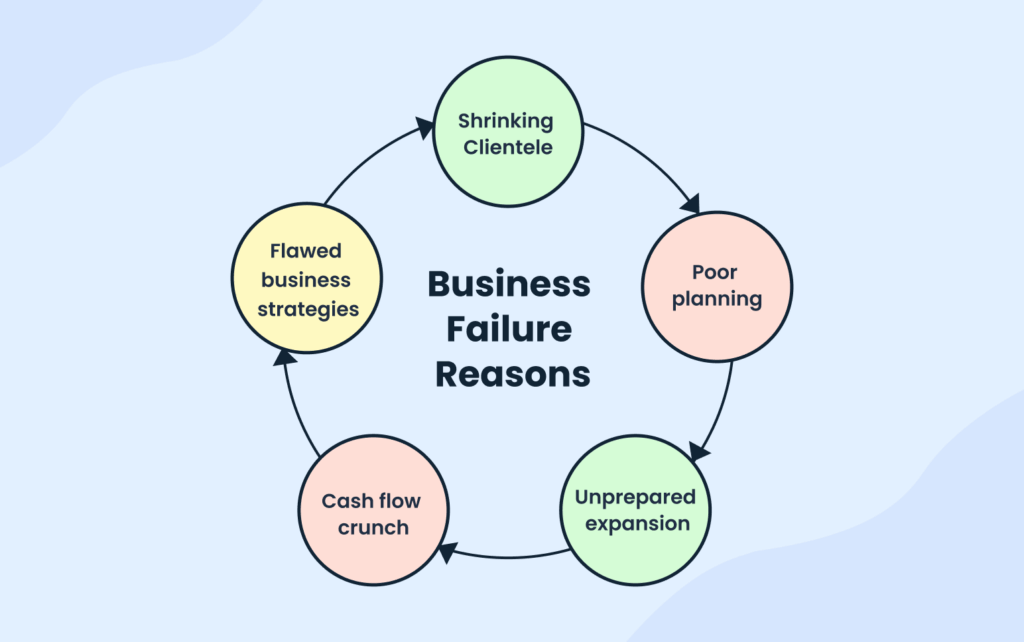
Willow & Thread is deliberately structured to avoid these failure modes. The business operates within a narrowly defined target market, maintains conservative inventory ownership, and prioritizes organic community building over high-cost paid acquisition.
This approach reduces financial strain, limits inventory risk, and supports steady, repeat-driven growth rather than short-term volume expansion.
Stop searching the internet for industry & market data
Get AI to bring curated insights to your workspace

Competitive Landscape
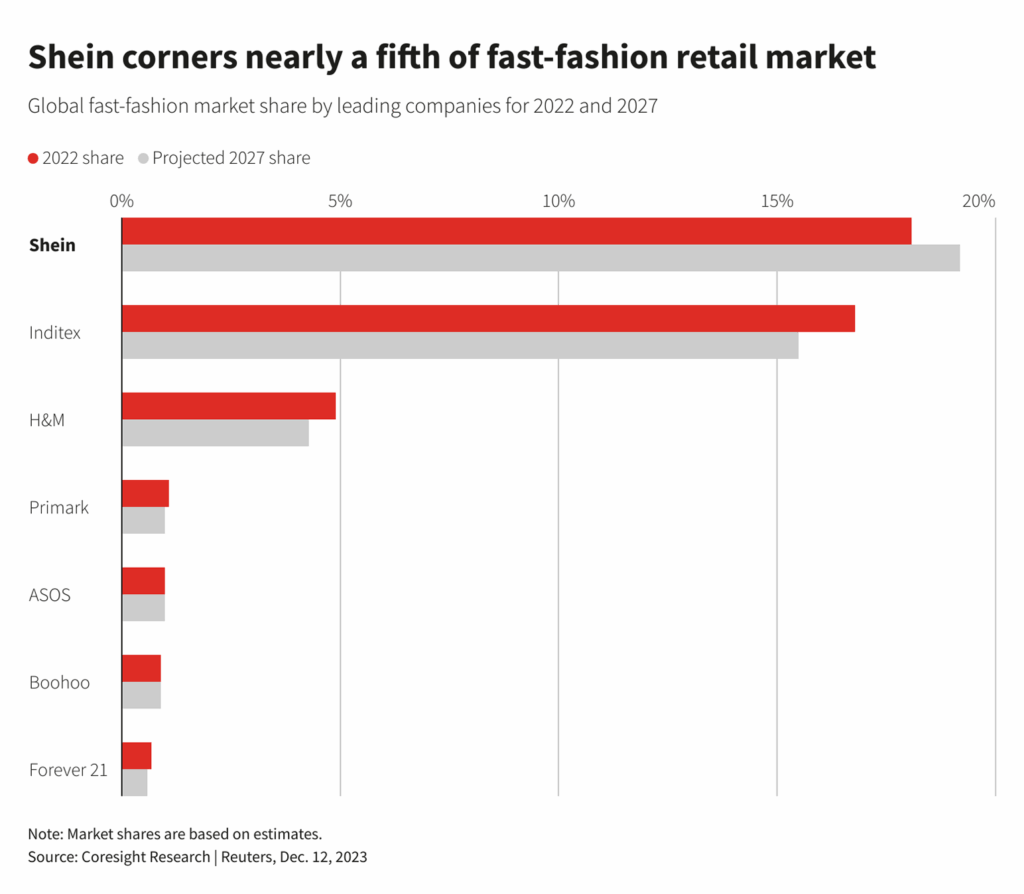
The business does not compete directly with fast fashion retailers or large online marketplaces. Competing on price or assortment against platforms such as Shein, H&M, or Amazon requires scale, supply-chain leverage, and marketing budgets that are not realistic or appropriate at this operating level.
Instead, Willow & Thread operates within a competitive set of small, aesthetic-driven direct-to-consumer brands that prioritize focus and brand clarity over breadth and volume.
Such brands tend to succeed or fail based on a limited set of execution factors rather than pricing power:
- Visual identity and consistency across products and content
- Customer trust built through accurate descriptions, fit reliability, and responsive service
- Community engagement on social platforms rather than paid reach
- Repeat purchase behavior rather than one-time promotional conversions
Positioning
Willow & Thread competes on taste, trust, and consistency rather than price or breadth.
| Dimension | Approach |
|---|---|
| Taste | Curated, cohesive aesthetic rather than broad selection |
| Trust | Honest descriptions, real sizing, responsive service |
| Consistency | Reliable fit across styles and restocks |
| Experience | Calm brand presence, no aggressive selling |
Such positioning appeals to the customers who are fed up with throwaway fashion and excessive selection. They will give a small premium for products that feel considered and a brand that respects their attention.
Market Risks
Three market-level risks are acknowledged:
Attention competition. Small brands vie for the limited attention of customers with large competitors who have huge marketing budgets. Mitigation is the content of founder-led organic community building and not the dependence on paid ads.
These brands can dominate paid visibility across search and social platforms, creating a structural disadvantage for small businesses attempting to compete for attention through advertising volume alone.
Customer acquisition cost. Paid advertising in fashion is expensive and often unprofitable for small brands. The strategy limits paid spend to a $500 monthly maximum, focusing instead on Instagram content and email retention.
Niche size constraints. The target market is intentionally narrow. This limits total addressable demand but also reduces competition and improves conversion among the right customers. The business is sized for this reality, not built on assumptions of mass market appeal.
Operating Assumptions
Revenue projections assume modest increases driven by repeat customers and incremental conversion improvement, without reliance on aggressive customer acquisition.
| Category | Year 1 | Year 2 | Year 3 |
|---|---|---|---|
| Revenue | $57,000 | $74,000 | $93,000 |
| Primary Growth Driver | Initial customer base, brand establishment | Repeat purchases, email list growth | Word of mouth, organic reach expansion |
These projections reflect modest expectations, appropriate for a bootstrapped niche brand, rather than venture-scale ambitions.
Marketing & Sales Strategy
Strategic Approach
Marketing capacity is constrained by founder bandwidth and a modest budget. The strategy prioritizes organic community building over paid acquisition. Paid advertising is supplemental and limited, not a primary revenue driver.
The monthly marketing budget is approximately $500, totaling about $6,000 in the first year. This expenditure is aimed at creating content and targeted paid promotion and advertisement of verified products instead of extensive customer acquisition.
Primary Channels
| Channel | Role | Effort Level |
|---|---|---|
| Primary awareness and engagement | High | |
| Email marketing | Retention and repeat purchases | Moderate |
| Long-term discovery traffic | Low | |
| Paid ads | Limited testing of top performers | Low |
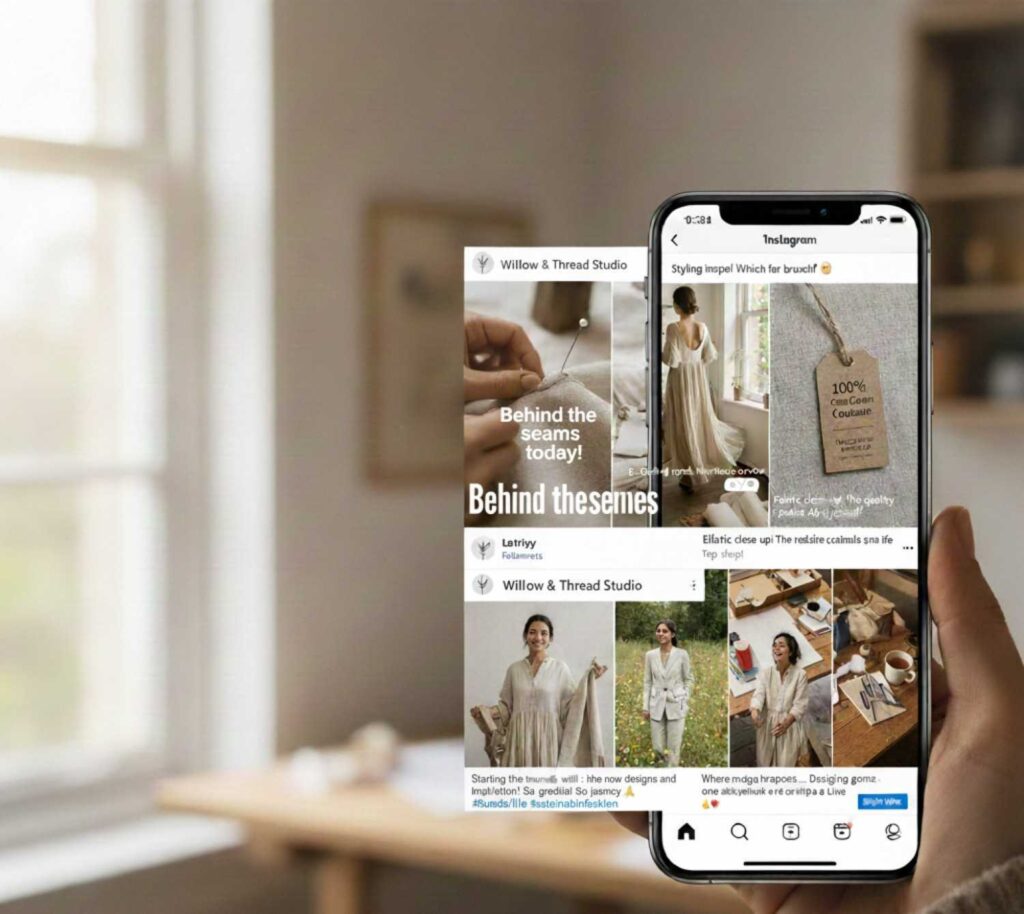
Instagram (Main Channel)
Instagram is used as the main brand presence. The content is geared toward creating trust and aesthetic consistency and not continuous selling.
Posting cadence:
- Daily stories: behind-the-scenes, styling ideas, fabric details
- Three to four feed posts per week, including product visuals and lifestyle content
The goal is to maintain consistent visibility without overwhelming followers. It is founder-led content, focusing on authenticity and not polished production.
Email Marketing
The repeat purchases brought about by emails are more profitable than the acquisition of new customers.
Approach:
- Weekly or bi-weekly sends
- New arrivals, styling, restock notices.
- No aggressive promotional frequency
The email list builds from website visitors and Instagram followers. Email retention is important since repeat customers do not need to be acquired and have better conversion rates.
Pinterest offers long-term discovery in terms of mood boards and outfit inspiration. The platform promotes longevity as opposed to viral moments.
Low investment, using existing product photography and lifestyle content, with returns that build gradually over time and continue to generate traffic months after initial posting.
Paid Advertising
Paid spend is deliberately limited. Advertising of fashion is costly, and small brands hardly attain profitable customer acquisition with the help of advertisements.
Approach:
- Minimal Instagram advertisement investment to experiment with creatives.
- Focus only on the best-performing products
- Maximum $500 monthly, scaled back if returns are poor
Paid ads are treated as experimentation, not a growth engine. If organic channels underperform, the response is content adjustment rather than increased ad spend.
Sales Process
The sales are easy and self-service:
- Through Instagram, Pinterest, or search, the customer learns about the brand.
- Visits the Shopify site, consults the sizing guide.
- Purchases one to two products per order, resulting in an average order value of approximately $74.
- Receives order with branded packaging and thank-you note.
- Joins email list for future releases and restocks.
Conversion depends on trust signals: clear photography, honest product descriptions, real measurements, and visible customer reviews as they accumulate.
Retention Focus
It is expensive to get a new customer when compared to retaining an existing customer. The plan focuses on the emphasis on repeat purchases rather than on the regular acquisition of new customers. Retention tactics:
- Email sequences for post-purchase engagement
- Early access to limited edition drops for existing customers
- Consistent brand experience that builds loyalty
Operations Plan
Fulfillment Model
Willow & Thread operates a home-based fulfillment model. Orders are packed and shipped from the founder’s Portland home office. No warehouse, fulfillment center, or third-party logistics provider is used in year 1.
This approach eliminates fixed facility costs and keeps the break-even threshold low. The primary trade-off is founder time, as each order requires manual processing, packing, and shipping.
Order Workflow
| Step | Process | Timeframe |
|---|---|---|
| Order received | Shopify notification | Immediate |
| Order picked and packed | Home office | Within 24 hours |
| Shipping label created | USPS or UPS | Same day as packing |
| Package dispatched | Local drop-off or pickup | 2 to 3 day processing |
| Customer notified | Automatic tracking email | On dispatch |
Processing time is communicated as 2 to 3 business days. This allows flexibility for order batching and founder schedule management without setting unrealistic same-day expectations.
Shipping
Depending on the size of the package and place of delivery, orders are delivered with either USPS Ground Advantage or UPS Ground. The average cost of shipping out is about $7.50 per order.
Shipping costs are partially offset by customer-paid shipping on most orders. Shipping subsidies of $1,200 annually are budgeted for promotional free shipping thresholds and cost absorption on larger orders.
Inventory Management
Inventory is tracked through Shopify’s built-in system. Weekly stock reviews identify:
- Fast-moving items approaching the reorder point
- Slow-moving items requiring attention
- Size or color gaps in popular styles
Restocking decisions focus on proven sellers only. The top 4 to 5 performing SKUs receive reorder priority. Slow movers are not replenished until existing stock clears.
Opening inventory totals approximately 350 to 380 units for $11,900. Inventory levels are adjusted gradually based on sell-through and cash availability, increasing modestly after the first year as demand is proven.
| Year 1 | Year 2 | Year 3 | |
|---|---|---|---|
| Inventory Value | $14,000 | $18,000 | $22,200 |
Inventory expansion is tied to demonstrated demand, not speculative growth.
Returns
The return policy is simple: 14-day returns for refund only. No exchanges are offered initially to reduce operational complexity.
Returns processing:
- Customer emails request
- Return shipping label provided, or customer ships at their own cost
- Refund issued upon receipt and inspection
- Returned inventory restocked if sellable
Return rates in online apparel typically run 15 to 25 percent. The financial projections assume returns within this range, factored into gross margin calculations.
Customer Support
Customer service is email-only, handled by the founder. Response window is 24 to 48 hours.
Common inquiries include:
- Sizing questions
- Order status checks
- Return requests
- Product availability
A solo operator can afford to handle volume at projected order rates (60 to 70 orders per month in the first year). When the volume of inquiries is greater than capacity, then per-inquiry time can be decreased by templated responses and expansion of frequently-asked questions.
Founder Workload
Operations are designed around realistic founder capacity. Estimated weekly time allocation:
| Function | Hours Weekly |
|---|---|
| Order fulfillment | 6 to 8 |
| Customer service | 3 to 4 |
| Marketing and content | 8 to 10 |
| Inventory and admin | 2 to 3 |
| Total | 19 to 25 |
This workload allows the business to operate as a substantial part-time commitment or flexible full-time role without burnout. Peak periods (product launches, holiday season) require temporary increases.
Capacity Constraints
The model starts getting strained at a ratio of about 100 to 120 orders per month. If order volume approaches this level, potential responses include:
- Batch processing and fixed shipping days
- Part-time packing assistance
- Third-party fulfillment evaluation
These decisions are deferred until demand justifies them. Year 1projections (60 to 70 monthly orders) remain well within solo capacity.
Technology
| System | Purpose | Monthly Cost |
|---|---|---|
| Shopify | E-commerce platform, inventory tracking | $39 |
| Shopify apps | Email capture, reviews, shipping | $30 to 50 |
| Google Workspace | Email, documents | $12 |
Annual website and software expenses total approximately $1,800, with modest increases as functionality expands.
Financial Plan
Break-Even Analysis
To break even, the business requires approximately 62 orders per month, that is, 15 to 16 orders every week. The 60-70 monthly order forecasts in the first year give a buffer of the break-even, but likely early months will be below average as the brand settles down.
| Item | Amount |
|---|---|
| Average order value | $74 |
| Gross margin | 45% |
| Monthly fixed costs | $2,045 |
| Break-even revenue | ~$4,550/month |
| Break-even orders | 62 orders/month |
Use of Funds
| Item | Amount |
|---|---|
| Inventory | $11,900 |
| Website setup | $1,100 |
| Brand photography | $500 |
| Packaging & labels | $1,050 |
| Marketing | $1,500 |
| Legal & setup | $650 |
| Software | $400 |
| Working capital | $1,400 |
| Total | $18,500 |
The $1,400 working capital reserve covers approximately six weeks of operating expenses and serves as a buffer against slower-than-expected early sales.
Struggling with numbers? Upmetrics’ financial forecasting tool helps you create clear, realistic financial projections for your plan.
Loan Terms
| Term | Detail |
|---|---|
| Loan amount | $18,500 |
| Term | 5 years |
| Interest rate | 10.5% |
| Monthly payment | Approximately $395 |
| Annual debt service | $4,740 |
Monthly installments of approximately $395 commence upon funding. The five-year term balances manageable payments with total interest cost.
Revenue Model
Revenue comes from two streams:
| Stream | Description |
|---|---|
| Online product sales | Core apparel and accessories through Shopify |
| Limited edition drops | Seasonal releases create urgency and repeat visits |
Average order value is $74. At projected order volumes of 60 to 70 monthly in year 1, monthly revenue ranges from $4,440 to $5,180.
Gross Margin
| Component | Amount |
|---|---|
| Average order value | $74 |
| Product cost (COGS) | ~ 55% |
| Gross margin | ~ 45% |
| Gross profit per order | ~ $33 |
Gross margin of 45% accounts for product cost, packaging, fulfillment materials, and payment processing fees. This margin supports operating expenses and debt service at projected volumes.
Financial Summary
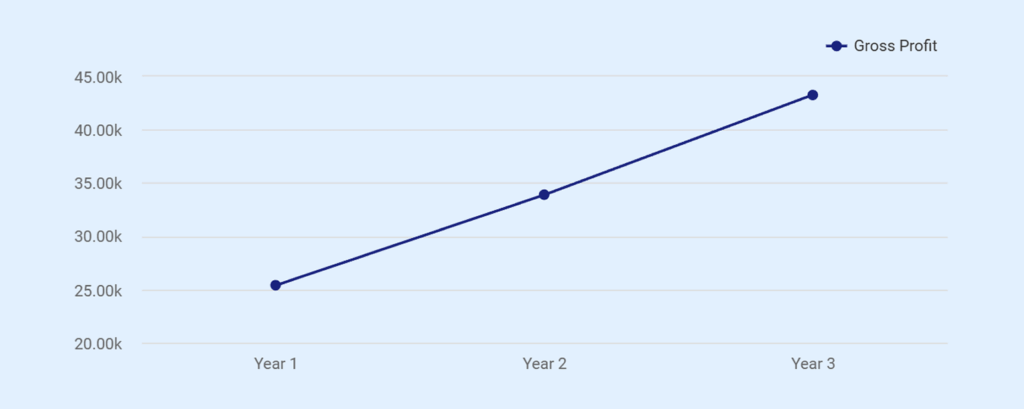
The first year will have a revenue of 57,000, gross profit of 25,400, and net income of 7,400. In years two and three, revenue will increase to $74,000 and $93,000, respectively, as repeat customer volume increases and conversion rates improve.
| Metric | Year 1 | Year 2 | Year 3 |
|---|---|---|---|
| Total revenue | $57,000 | $74,000 | $93,000 |
| Gross profit | $25,400 | $33,900 | $43,300 |
| Gross margin | 44.6% | 45.8% | 46.6% |
| Net income | $6,400 | $9,500 | $12,500 |
Gross margin improves modestly over three years through better purchasing efficiency and reduced per-unit costs at higher volumes.
Spreadsheets are exhausting & time-consuming
Build accurate financial projections w/ AI-assisted features

Projected Income Statement
| Revenue Streams | Year 1 | Year 2 | Year 3 | Total |
|---|---|---|---|---|
| Online product sales | $48,000 | $62,000 | $78,000 | $188,000 |
| Limited edition drops | $9,000 | $12,000 | $15,000 | $36,000 |
| Total Revenue | $57,000 | $74,000 | $93,000 | $224,000 |
| Cost of Sales | $31,600 | $40,100 | $49,700 | $121,400 |
| Product cost | $26,200 | $33,300 | $41,000 | $100,500 |
| Packaging & fulfillment | $3,600 | $4,500 | $5,800 | $13,900 |
| Payment processing fees | $1,800 | $2,300 | $2,900 | $7,000 |
| Gross Profit | $25,400 | $33,900 | $43,300 | $102,600 |
| Gross Margin (%) | 44.60% | 45.80% | 46.60% | 45.80% |
| Operating Expenses | $17,100 | $22,400 | $28,700 | $68,200 |
| Marketing & ads | $6,000 | $7,500 | $9,000 | $22,500 |
| Website & software | $1,800 | $2,100 | $2,400 | $6,300 |
| Shipping subsidies | $1,200 | $1,500 | $1,800 | $4,500 |
| Professional fees | $900 | $1,000 | $1,100 | $3,000 |
| Office & misc | $1,200 | $1,300 | $1,400 | $3,900 |
| Owner draw | $6,000 | $9,000 | $6,000 | $27,000 |
| EBITDA | $8,300 | $11,500 | $14,600 | $34,400 |
| Interest expense | $1,900 | $1,400 | $900 | $4,200 |
| Taxes | $0 | $600 | $1,200 | $1,800 |
| Net Income | $6,400 | $9,500 | $12,500 | $30,800 |
Projected Cash Flow Statement
| Year 1 | Year 2 | Year 3 | |
|---|---|---|---|
| Net income | 7.40k | 10.30k | 13.10k |
| Depreciation | 0.50k | 0.50k | 0.50k |
| Inventory change | -1.90k | -4.00k | -4.00k |
| Working capital changes | -1.20k | -1.40k | -1.60k |
| Net Operating Cash Flow | 1.90k | 4.60k | 7.20k |
| Equipment & tech purchases | -2.50k | -0.50k | -0.50k |
| Net Investing Cash Flow | -2.50k | -0.50k | -0.50k |
| Owner contributions | 5.00k | 0.00k | 0.00k |
| Loan proceeds | 18.50k | 0.00k | 0.00k |
| Loan principal payments (principal and interest) | -4.74k | -4.74k | -4.74k |
| Owner distributions | -6.00k | -9.00k | -6.00k |
| Net Financing Cash Flow | 13.90k | -12.60k | -10.70k |
| Opening cash | 2.00k | 16.30k | 8.60k |
| Net cash change | 13.30k | -8.50k | -8.90k |
| Ending Cash | 15.30k | 6.80k | -2.6k |
Projected Balance Sheet
| Year 1 | Year 2 | Year 3 | |
|---|---|---|---|
| Cash | 16.30k | 8.60k | 0.30k |
| Accounts receivable | 1.20k | 1.50k | 1.80k |
| Inventory | 10.00k | 14.00k | 18.00k |
| Prepaid & other assets | 1.50k | 1.70k | 1.90k |
| Total Current Assets | 33.00k | 29.80k | 26.20k |
| Equipment & tech | 3.00k | 3.50k | 4.00k |
| Accumulated depreciation | (0.50k) | (1.00k) | (1.50k) |
| Net Fixed Assets | 2.50k | 2.50k | 2.50k |
| Total Assets | 35.50k | 32.30k | 28.70k |
| Accounts payable | 5.80k | 6.40k | 7.20k |
| Accrued expenses | 1.40k | 1.60k | 1.80k |
| Long-term debt | 14.80k | 11.10k | 7.40k |
| Total Liabilities | 22.00k | 19.10k | 16.40k |
| Total Equity | 13.50k | 8.20k | 7.30k |
| Owner contributions | 7.00k | 0.00k | 0.00k |
| Retained earnings | 8.50k | 4.40k | 3.40k |
| Total Liabilities & Equity | 35.50k | 32.30k | 28.70k |
Cash Position
Year 1 ending cash of $16,300 reflects startup capitalization and modest operating cash flow. Cash declines in years two and three as owner distributions increase:
| Position | Year 1 | Year 2 | Year 3 |
|---|---|---|---|
| Opening cash | $2,000 | $16,300 | $8,600 |
| Ending cash | $16,300 | $8,600 | $300 |
Year 3 ending cash of $300 is tight. This reflects owner distributions of $12,000 in year 3. If revenue underperforms projections, distributions would need to be reduced to maintain adequate cash reserves.
Debt Service Coverage
Annual debt service is approximately $4,740, based on a five-year, $18,500 term loan at an estimated 10.5% interest rate. Year 1 EBITDA of $8,300 provides debt service coverage of approximately 1.75 times, improving steadily as revenue grows.
| Year 1 | Year 2 | Year 3 | |
|---|---|---|---|
| EBITDA | $8,300 | $11,500 | $14,600 |
| Debt Service | $4,740 | $4,740 | $4,740 |
| Coverage Ratio | 1.75x | 2.43x | 3.08x |
Coverage improves each year as revenue grows and operating leverage increases.
Key Assumptions
Revenue assumptions:
- Average order value remains approximately $74
- Order volume grows from 60 to 70 monthly (year 1) to 100 to 115 monthly (year 3)
- Limited edition drops contribute 15 to 16% of total revenue
- Growth driven by repeat customers, not aggressive acquisition spend
Expense assumptions:
- Marketing spend increases modestly with revenue ($6,000 year 1 to $9,000 year 3)
- Owner draw begins at $6,000 annually, increasing to $12,000 by year 3
- No employee hires through year 3
- Home-based operations continue (no facility costs)
Inventory assumptions:
- Inventory value grows proportionally with revenue
- Turnover remains consistent at approximately 2.5 times annually
- No significant markdowns or obsolescence assumed
Owner distributions are intentionally moderated in Year 3 to preserve liquidity and maintain adequate cash reserves during the loan repayment period.
The Quickest Way to turn a Business Idea into a Business Plan
Fill-in-the-blanks and automatic financials make it easy.
Upmetrics
Upmetrics is the #1 business planning software that helps entrepreneurs and business owners create investment-ready business plans using AI. We regularly share business planning insights on our blog. Check out the Upmetrics blog for such interesting reads. Read more