Executive Summary
Horizon Ridge Solar LLC develops and operates a 2.0 MW DC ground-mounted solar photovoltaic farm in Buckeye, Arizona. The project sells electricity under a long-term contracted agreement to a utility, municipal buyer, or community solar administrator.
Michael Turner and Rachel Nguyen formed the company as a multi-member LLC. Michael holds 60% of the company ownership, while Rachel owns 40%. They’ve secured a 25-year ground lease on 15 acres of flat land. The lease includes two optional five-year extensions.
The lease grants access for construction, maintenance rights, and long-term site security. Flat land and existing road access reduce build risk and ongoing upkeep effort.
We focus on one thing: generating reliable solar power. We are not doing rooftop installations or adding battery storage at launch. We also avoid risky merchant power sales. Instead, we sell electricity through long-term contracts to a reliable buyer, creating steady and predictable revenue.
Market Opportunity
Arizona gets more than 300 sunny days per year. Utilities and municipalities need renewable energy to meet their clean power goals. Small-scale solar projects like ours fill a sweet spot in the market.
Large developers chase 50+ MW projects. They skip smaller sites because the returns don’t justify their overhead. Community-scale buyers need projects between 1 and 5 MW. We deliver exactly what they want: Manageable size, faster permitting, and simpler construction.
Moreover, the competitive landscape works in our favor. Regional developers compete for similar-sized projects. But most lack the streamlined approach we bring. Larger developers avoid our market segment entirely. We face competition without saturation.
Our Target Customers
Horizon Ridge Solar LLC serves energy buyers that value stable pricing, long-term supply, and low execution risk.
- Local electric utilities
- Municipal utilities and public power agencies
- Community solar program administrators
- Creditworthy commercial energy buyers
Financial Summary
The project shows steady revenue and a clear path to profit. Total revenue is $1,034,709 over three years, starting at $340,000 in Year 1, staying almost the same in Year 2 at $338,300 due to normal panel wear, and rising to $356,409 in Year 3 after a contracted price increase.
EBITDA stays positive every year, ranging from $219,000 to $232,217. The project reaches operating break-even in Year 1, generating positive EBITDA and operating cash flow. However, because 70% of the capital stack is debt, and interest expense is highest in the early years, full debt-service coverage and accounting profitability do not occur within the first three years.
Funding Requirements
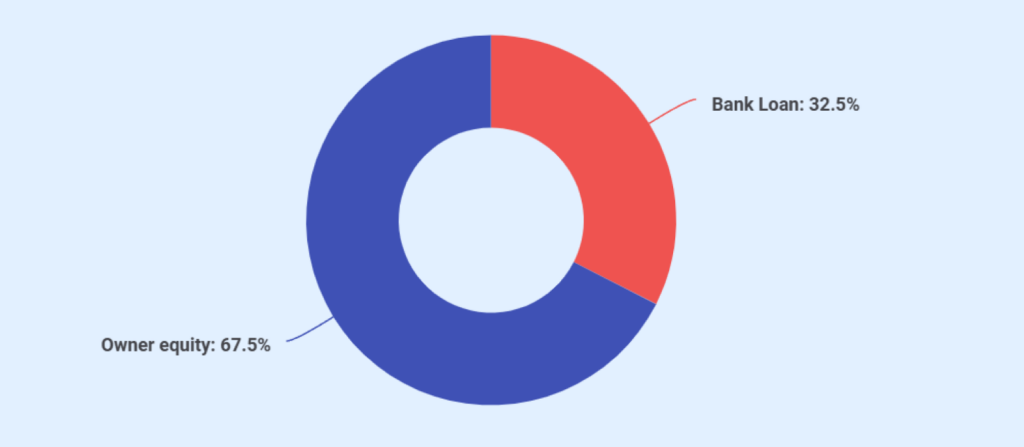
Our total project cost is $3,600,000. We fund this through:
| Source | Amount |
|---|---|
| Bank loan | $2,520,000 |
| Owner equity | $1,080,000 |
| Total Sources | $3,600,000 |

Company Overview
Horizon Ridge Solar is a single-purpose solar energy business operated on a stable, predictable, and long-term value basis. The business holds and operates a ground-mounted solar farm generating contracted power to creditworthy customers, keeping expenses under strict control and directed by owner supervision.
Legal Structure and Formation
Horizon Ridge Solar operates as a multi-member limited liability company registered in Arizona.
The structure isolates risk, simplifies financing, and meets lender requirements. The company exists to own, operate, and manage a single ground-mounted solar farm under long-term contracts.
Core Business Activity
We produce 2.0 MW DC solar photovoltaic power, which generates electricity, and sell the power on a long-term contract. The only thing that holds revenue is energy production and contracted pricing. The model doesn’t go through the exposure to spot markets, short-run fluctuations in prices, and churning of customers.
Mission and Vision
Mission: To produce clean, reliable solar electricity for Arizona utilities and communities under long-term contracts that ensure predictable revenue, disciplined cost control, and consistent asset performance.
Vision: To be a reliable small-scale solar power provider to utilities in the Southwest by providing 2-5 MW contracted projects and generating stable cash flow, risk control, and predicting a consistent value over time.
Ownership Structure
Horizon Ridge Solar is owned by two members. Michael Turner holds 60%, while Rachel Nguyen owns 40%. Both members actively participate in management and operations.

Michael Turner: Managing Member
Michael brings 15+ years of renewable energy development experience. He’s developed and financed solar projects totaling 47 MW across Arizona, California, and Nevada. Previous roles include project manager at a regional solar developer and director of business development at a renewable energy finance firm.
Rachel Nguyen: Member
Rachel adds 12+ years of renewable energy finance and operations management. She’s managed financial reporting and compliance for solar portfolios exceeding 100 MW. Her background includes roles as controller at a solar asset management firm and senior financial analyst at a clean energy investment fund.
Business Location and Site Control
The solar farm occupies 15 acres at B7420 County Route 16, Buckeye, AZ 85326, USA. Buckeye is 30 miles west of Phoenix, located in the county of Maricopa. The region boasts of 300 or more sunny days per year and little cloud cover. Peak solar irradiance is greater than 6.5 kWh/m²/day.
We acquired a 25-year ground lease with a private landowner to have control over the land. Rent is worth $30,000 annually without an inflation clause. There were no lease payments that were to be increased by both parties.
The nature of the sites will be to our advantage. Here’s what the sites offer:
- The topology of the flats does not need much grading.
- Agricultural zoning allows the right to solar installations.
- No wetlands in the property.
- The area does not have any endangered species.
- Road access does not have any upgrades for the construction vehicles.
Operating Philosophy
The company runs as an owner-managed asset with no payroll. Third-party contractors handle construction, operations, and maintenance. Owners retain control over decisions, budgets, and performance reviews. The approach keeps costs low and accountability clear.
Market Analysis
Horizon Ridge Solar operates in Arizona, a prime solar market with strong utility demand and high solar output. The project’s location in Buckeye positions the business to benefit directly from the state’s active solar procurement and favorable market conditions.
Here are the insights that show the opportunity for Horizon Ridge Solar in Arizona:
Regional Market and Opportunity
Arizona ranks 4th among the fastest-growing solar energy markets in the U.S. The state currently hosts over 11,060 MW of solar capacity, enough to power more than 1.6 million homes, and installations are expected to exceed 12,545 MW in the next five years.
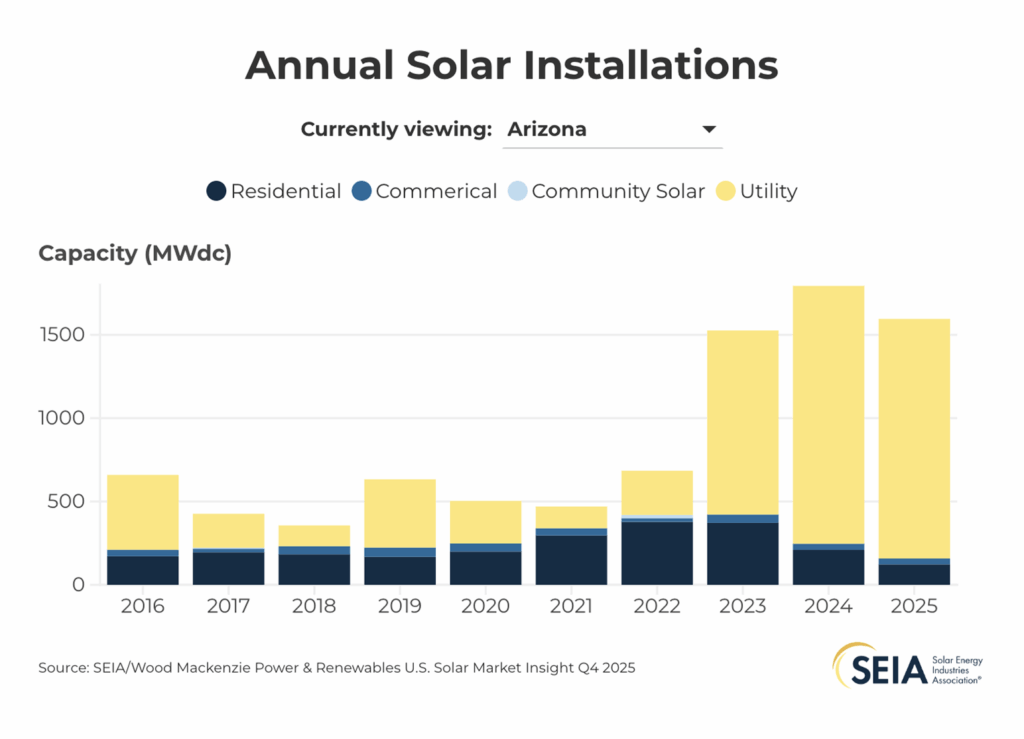
The solar industry of Arizona has experienced recent growth, with almost 4,550 new installations in 2025 by itself, and with solar providing over 50% of the new electric generating capacity in 2025.
Solar sustains a growing labor force and economic foundation of more than 9,768 direct employees in the solar electricity industry, and high investment throughout the industry.
Long-term utility plans show potential additional solar capacity procurement to meet future demand, plus significant storage additions, creating a large opportunity pipeline for developers with ready assets and contracts.
Competitive Landscape
The solar development market includes a range of national and regional players. Larger utility-scale developers dominate capacity building and procurement deals:
| Logo | Company | Strengths | Weaknesses |
|---|---|---|---|
 |
NextEra Energy Resources | Massive capital, deep pipelines, proven execution | Focus on very large (>50 MW) projects limits small farm involvement |
 |
Cypress Creek Renewables | Strong financing and community solar expertise | Less direct presence in single-asset merchant contracts |
 |
Recurrent Energy | International backing and utility partnerships | Limited small project focus |
 |
First Solar | Innovation in PV tech and performance in heat | Supply chain reliance and scale economics |
 |
McCarthy Building Companies | High installation volume in AZ | Primarily EPC, not long-term asset operator |
These companies rank among the top solar installation partners in the state based on DC capacity installed, covering utility-scale and EPC work. They help build projects but do not always retain ownership post-construction, limiting direct competition for power contracting.
Competitive Positioning
Horizon Ridge Solar LLC competes based on project structure and scale advantages rather than internal staffing or informal relationships.
1. Smaller Footprint
The 2.0 MW solar farm requires approximately 15–18 acres. Large utility-scale projects often exceed 100 acres. A smaller land requirement reduces site constraints, lowers environmental impact risk, and simplifies community acceptance.
2. Simpler Permitting
Smaller projects face fewer regulatory hurdles than large utility-scale developments. Local approvals, zoning reviews, and environmental assessments move faster due to reduced land disturbance and infrastructure scope.
3. Faster Development Timeline
The development schedule runs significantly shorter than large-scale projects. Utility-scale projects can take several years from site control to operation. A 2 MW facility progresses more quickly through engineering, interconnection review, and construction due to lower grid impact and reduced design complexity.
4. Lower Construction Complexity
A fixed-tilt ground-mounted system avoids the mechanical complexity of tracking systems used in large farms. Smaller capacity reduces substation upgrades, heavy civil work, and transmission requirements. Construction risk declines as system scale and design complexity decrease.
Strategic Position
Large developers focus on multi-hundred-megawatt portfolios where economies of scale justify overhead. Horizon Ridge Solar focuses on community and small utility-scale capacity where agility, simplified approvals, and controlled construction scope create measurable execution advantages.
Barriers to Entry
Several challenges could slow our growth or reduce profitability:
- Utility interconnection backlogs in Arizona can delay new solar projects by 18–24 months.
- Equipment pricing and availability can shift due to trade rules and supply constraints.
- Higher interest rates increase debt service and reduce project returns.
- Changes in federal or state solar policies can affect long-term project economics.
- Revenue depends on a single contracted buyer, making counterparty credit strength critical.
Services Offered
The production of grid-connected solar electricity by Horizon Ridge Solar LLC is based on a 2.0 MW DC ground-mount photovoltaic system. The facility transforms sunlight into direct current power; inverters transform it into alternating current, and the system feeds the power to the local utility grid through an approved interconnection point. The revenue will be based on the measured kilowatt-hours being exported to the grid with a long-term contract.
How We Produce Energy
- Solar panels capture sunlight and generate DC electricity.
- String inverters convert DC power to AC power.
- Transformers adjust voltage to utility standards.
- Utility-grade meters record exported energy.
- Power flows directly into the grid under a contracted agreement.
Pricing and Production
Horizon Ridge Solar sells electricity under a contracted price structure that keeps revenue stable and predictable.
The contracted price is $0.085 per kWh in Years 1 and 2. In Year 3, the price increases to $0.090 per kWh based on a planned step-up in the contract. There are no other price increases beyond this change.
On the production side, the system is projected to generate:
| Year | Energy Produced (kWh) |
|---|---|
| Year 1 | 4,000,000 |
| Year 2 | 3,980,000 |
| Year 3 | 3,960,100 |
| 3-Year Total | 11,940,100 |
Billing is done monthly, with payments typically collected within 30 days, helping maintain steady cash flow.
Project Size and Development Plan
The solar farm occupies approximately 15 acres in Buckeye, Arizona. The parcel supports solar use under agricultural or industrial zoning, either by right or through conditional approval. The scale fits small utility development without triggering large-scale land impact concerns.
The property includes existing public road access suitable for construction vehicles and long-term maintenance traffic. The location supports safe equipment delivery and routine Operations and Maintenance (O&M) visits without infrastructure upgrades.
Technology and System Design
Here is the technology and system design that supports reliable energy generation and grid delivery:
PV System Configuration
The project uses a 2.0 MW DC ground-mounted fixed-tilt photovoltaic system. Fixed-tilt racking reduces mechanical complexity and lowers maintenance exposure compared to tracking systems.
Solar Modules
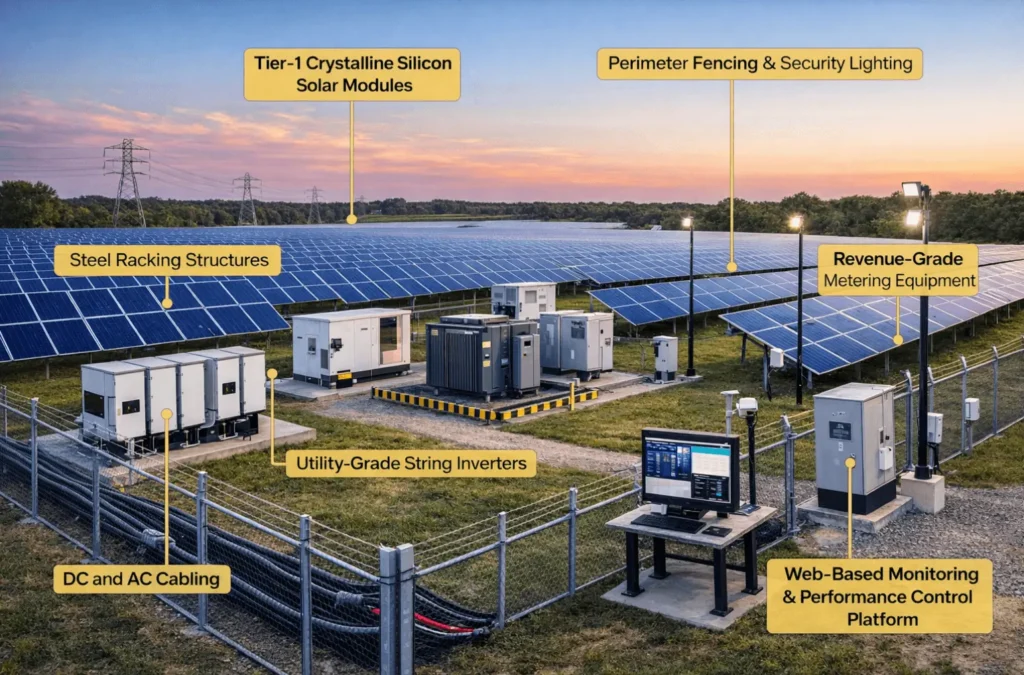
Tier-1 crystalline silicon modules power the system. Modules carry a 25-year performance warranty and follow industry reliability standards.
Inverters
Utility-grade string inverters convert DC electricity to grid-compliant AC power. Redundant inverter configuration limits production losses during servicing. Remote monitoring allows immediate fault detection.
Balance of System Components
- Steel racking structures
- DC and AC cabling
- Step-up transformers and switchgear
- Perimeter fencing and security lighting
- Revenue-grade metering equipment
Each component meets utility interconnection and safety standards.
Monitoring and Performance Control
A web-based monitoring platform provides real-time production data. Automated alerts flag underperformance or equipment faults. Meter data supports billing accuracy and lender reporting.
Development Plan
The project follows a fixed-price Engineering, Procurement, and Construction (EPC) contract. Fixed pricing reduces cost uncertainty during build-out.
Engineering
Licensed engineers prepare and stamp all electrical and civil designs. Engineering complies with utility requirements, National Electrical Code standards, and local building codes.
Construction Scope
- Site preparation and grading
- Racking installation
- Module mounting
- Electrical wiring and inverter setup
- Transformer installation and switchgear connection
- Utility interconnection
- Testing and commissioning
Construction Timeline
Construction runs approximately seven months from Notice to Proceed to mechanical completion. Utility testing follows before final permission to operate. The smaller system size shortens the development cycle compared to large utility-scale projects.
Operation Plan
Horizon Ridge Solar LLC follows a simple operating model focused on reliability, cost control, and direct owner oversight. The plan relies on contracted service partners while keeping internal structure lean and predictable.
Operational Philosophy
Horizon Ridge Solar operates as an owner-managed asset with zero employees. We outsource all physical work to licensed service providers. Michael and Rachel focus on oversight, coordination, and strategic decisions.
The model works because solar farms require minimal human intervention. Panels generate power automatically. Inverters convert electricity without supervision, and monitoring systems detect problems remotely. Quarterly inspections catch issues before they become failures.
The business avoids the complexity and cost of maintaining a workforce. Service providers already carry insurance, employ trained technicians, and maintain safety programs.
Office Working Hours
| Office Function | Working Hours |
|---|---|
| Administrative operations | Monday–Friday, 9:00 AM – 5:00 PM |
| Owner availability | Business hours with on-call availability for urgent matters |
| On-site operations | Automated, monitored 24/7 via remote systems |
| Emergency response | As needed through the contracted O&M provider |
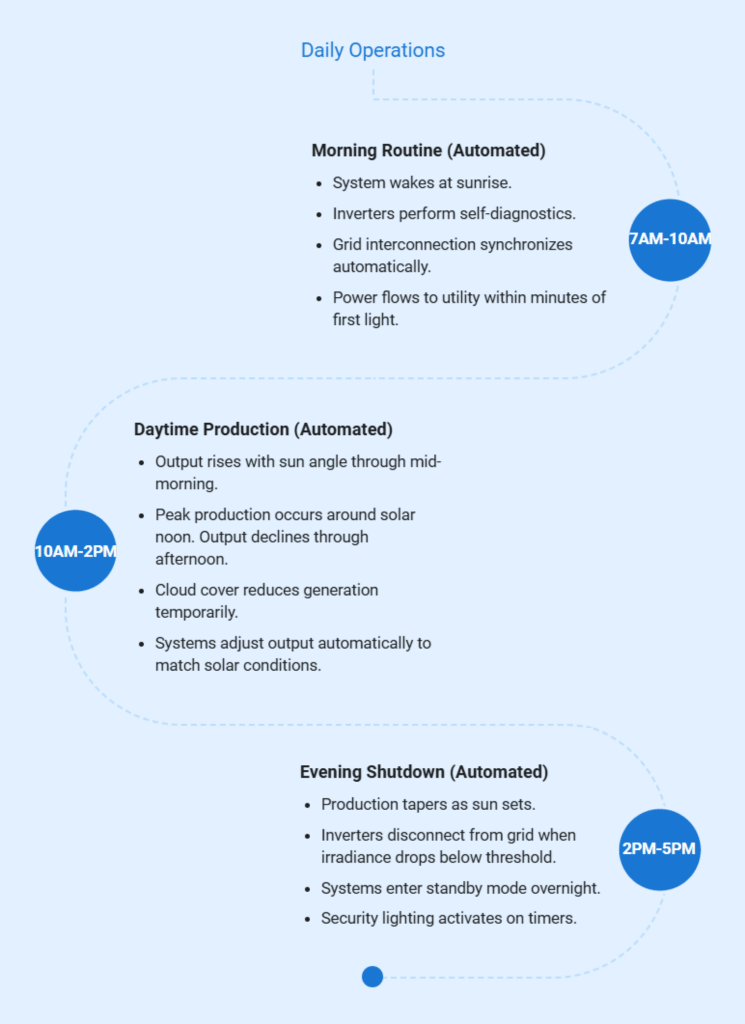
Daily Operations
Solar farms run autonomously under normal conditions. Sunrise triggers production, and panels convert sunlight to electricity. Then, inverters feed power to the grid, and at sunset, the cycle ends. The process repeats 365 days per year.
Energy Production Profile
Production varies by month based on sun angle, day length, and weather conditions. Arizona’s climate delivers exceptional solar resources year-round. Here are insights into our production profile:
| Energy Profile Factor | Details |
|---|---|
| Peak production period | April–September: 60% of annual output |
| Peak month example | June: 425,000 kWh from 2.0 MW system |
| Off-peak period | October–March: 40% of annual output |
| Lowest month example | December: 250,000 kWh |
| Daily generation pattern | Starts at sunrise, peaks at solar noon, ends at sunset |
| Summer production window | 14+ hours per day |
| Winter production window | 10 hours per day |
| Annual degradation rate | 0.5% per year |
| Annual energy output |
|
Quality and Reliability
Equipment selection prioritizes proven track records over cutting-edge innovation. We choose manufacturers with decades of operating history.
1) Tier-1 Components
Tier-1 designation means manufacturers maintain large-scale production, strong balance sheets, and long warranty histories. Bloomberg New Energy Finance maintains the Tier-1 manufacturer list. Only companies with proven reliability qualify.
2) Performance Warranties
Panel manufacturers guarantee 90% output after 10 years and 80% after 25 years. In case of poor performance, the manufacturers will change the panels without charging. There are a few instances of warranty claims because modern panels are always above specifications.
3) Testing and Commissioning
The EPC contractor tests every component before commercial operation. Utility engineers witness testing. Independent engineers verify performance. Systems must pass all tests before we start billing for power.
4) Monitoring Systems
Web-based platform tracks production in real time. String-level monitoring identifies underperforming panels immediately. Automated alerts notify O&M providers of faults. Most issues get flagged and fixed before affecting daily production.
5) Maintenance Protocols
Licensed O&M contractors inspect systems quarterly. Annual preventive maintenance includes panel washing, electrical testing, and inverter servicing. Vegetation management keeps plants from shading panels. Quick response times minimize downtime when equipment fails.
Does your plan sound generic?
Refine your plan to adapt to investor/lender interests
Marketing Approach
Marketing focuses on direct, one-to-one outreach to qualified energy buyers rather than public campaigns or lead generation. Our goal is to secure one long-term power buyer before construction funding. The business maintains the relationship through clear reporting and reliable delivery.
The business markets only to buyers who can sign long-term power contracts.
- Local electric utilities
- Municipal utilities
- Community solar program administrators
- Creditworthy commercial energy buyers
Each buyer values price certainty, contract stability, and low execution risk.
Go-to-Market Strategy
The company uses direct outreach instead of public advertising. Owners contact utilities and program administrators early in development. Discussions focus on site readiness, interconnection status, and pricing certainty. Contracts are finalized before loan funding.
Value Proposition
The project offers fixed-price solar power with no market risk. The asset sits in a high-output Arizona location. The system uses proven technology. Owners stay directly involved. Buyers receive predictable energy with low operational risk.
Sales Process
Sales follow a short and focused path:
- Identify a qualified buyer with an active procurement need
- Share site, interconnection, and production data
- Present fixed-price contract terms
- Finalize PPA or subscription agreement
- Lock the contract before construction financing
The process avoids speculative proposals and short-term deals.
Compliance and Insurance
Horizon Ridge Solar LLC secured all required approvals before construction and maintains active compliance throughout operations. The project meets county, utility, lender, and federal requirements specific to a 2.0 MW ground-mounted solar facility in Maricopa County, Arizona.
Regulatory Framework
The project complies with:
- Maricopa County Planning and Development land-use regulations
- National Electrical Code (NEC) standards for solar installations
- Environmental Protection Agency (EPA)
- Construction General Permit for stormwater discharge
- Occupational Safety and Health Administration (OSHA) construction safety standards
- Federal Aviation Administration (FAA) glare review requirements, where applicable
Permits and Approvals
All the required permits were received in advance. Importantly, permits remain valid through construction and operations, subject to compliance.
Land Use Permit
Maricopa County approved solar energy use on agricultural land. Permit conditions include setback requirements, perimeter screening, and a decommissioning plan. Annual reporting confirms continued compliance. Permit transfers automatically with the sale or assignment of a property.
Building Permits
The county building department gave permits for racking installation, the electrical system, and inverter pads. All structural and electrical drawings were stamped by licensed engineers. The inspections were made at the foundation, framing, electrical rough-in, and final stages. Commercial operation is allowed through a certificate of occupancy.
Electrical Permits
A separate electrical permit covers DC and AC wiring, inverters, transformers, and utility interconnection equipment. All work is done by licensed electricians, and compliance with the National Electrical Code (NEC) is checked by the county electrical inspector. Importantly, the permit is valid during the operation; any changes necessitate extra permits.
Environmental Permits
The EPA general permit involves stormwater release in construction activity. The site doesn’t support any wetlands, floodplains, or endangered species; thus, no extra environmental permits were necessary other than the usual local approvals. The application of herbicides requires a certified applicator licence, and environmental compliance is assured in yearly reports.
Utility Interconnection Requirements
Connecting to the utility grid requires extensive technical and contractual compliance. Standards protect grid reliability and worker safety.
Insurance Coverage
Comprehensive insurance protects against property damage, liability claims, and business interruption. Coverage requirements come from the lender, utility, and prudent risk management.
| Insurance Type | Coverage Limit/Cost | What It Covers | Purpose |
|---|---|---|---|
| Property Insurance | $3,600,000 limit; $10,000 deductible | Fire, lightning, wind, hail, vandalism, theft; replacement cost basis; excludes flood and earthquake | Protects solar equipment and physical assets |
| General Liability Insurance | $2,000,000 per occurrence; $4,000,000 aggregate | Bodily injury, property damage, legal defense; additional insureds; completed operations | Protects against third-party claims |
| Business Interruption Insurance | 12-month indemnity; 30-day waiting period | Lost revenue and ongoing expenses during repairs | Protects cash flow during outages |
| Excess Liability (Umbrella) | $5,000,000 limit; $3,000 annual premium | Claims exceeding primary liability limits | Covers catastrophic liability events |
| Environmental Liability | $1,000,000 limit | Cleanup costs, pollution claims, and regulatory defense | Manages environmental risk exposure |
| Cyber Liability | $500,000 limit; $2,000 annual premium | Data breaches, system attacks, investigations, and legal costs | Protects monitoring systems and data |
Staffing Model
The business does not plan to hire employees. The oversight and decision-making functions are controlled by owners, whereas all the field operations and maintenance functions are under the control of licensed third-party providers.
Internal Management
Michael Turner handles external relationships and technical coordination. His role focuses on asset performance, vendor oversight, and utility coordination. He takes the following responsibilities:
- Monitors system performance daily through web-based monitoring platforms
- Conducts monthly review calls with the O&M provider
- Coordinates maintenance schedules and corrective actions
- Holds quarterly meetings with the utility for interconnection compliance
- Oversees EPC follow-up and technical issue resolution
- Reviews annual operating budgets with Rachel to control costs
Rachel Nguyen manages financial administration and regulatory compliance. Her role ensures accurate reporting, timely payments, and contract adherence. Her responsibilities include:
- Processes monthly invoices from service providers
- Prepares and submits quarterly bank and lender reports
- Manages annual insurance renewals through competitive carrier bids
- Maintains compliance documentation and contract records
- Tracks permits, agreements, and correspondence
- Oversees financial controls and recordkeeping
After the first full operating year, the combined owner time commitment averages 10-15 hours per month. Early months require more attention as systems stabilize. By Year 2, operations become routine. Most weeks need just a few hours for monitoring and email correspondence.
External Service Providers
Licensed contractors handle all physical work. We select providers based on solar industry experience, insurance coverage, response time commitments, and references from similar projects.
Operations and Maintenance Provider
Technicians visit the site quarterly for preventive maintenance. Emergency response available 24/7 for critical failures. Services include panel inspections, inverter testing, electrical connections, vegetation management, and equipment repairs.
Vegetation Management
Local landscaping companies handle weed control and grass management. Sites require 3-4 visits annually, depending on rainfall. Herbicide application or mechanical mowing keeps plants from shading panels.
Accounting Services
A CPA (Certified Public Accountant) firm prepares tax returns and financial statements. Monthly bookkeeping stays in-house with Rachel. Annual audits happen if the lender requires them. Tax planning occurs in Q4 each year.
Legal Services
Energy law specialists on retainer for contract reviews and regulatory matters. Most years require minimal legal work. Major amendments to PPAs or lease terms trigger legal review.
Insurance Broker
Specialist broker familiar with renewable energy risks. Annual renewals include competitive bidding among carriers. The broker handles claims processing if equipment damage occurs.
Financial Plan
The financial plan shows how the business finances the construction, controls costs, and gets a stable cash flow in the long run. The structure supports the requirements of the lenders, maintains risk at low levels, and offers predictable returns.
Financial Assumptions
| Item | Assumption |
|---|---|
| Loan amount | $2,520,000 |
| Initial rate | 7.25% |
| Initial term | 15 years |
| Refinance timing | Beginning of Year 2 |
| Refinance rate | 5.25% |
| Refinance term | 14 years |
| Equity contribution | $1,080,000 |
| Opening reserve | $140,000 |
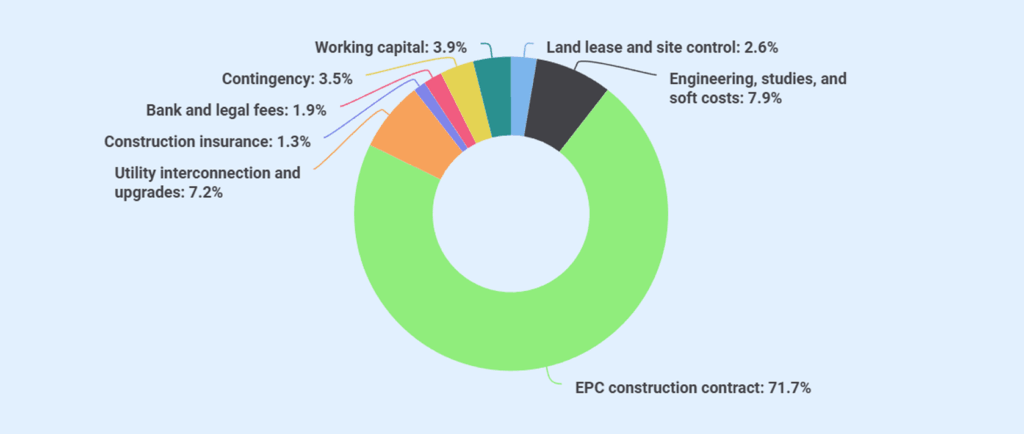
Startup Summary
| Category | Amount |
|---|---|
| Land lease and site control | $95,000 |
| Engineering, studies, and soft costs | $285,000 |
| EPC construction contract | $2,580,000 |
| Utility interconnection and upgrades | $260,000 |
| Construction insurance | $45,000 |
| Bank and legal fees | $70,000 |
| Contingency | $125,000 |
| Cash reserve at completion (working capital) | $140,000 |
| Total Startup Costs (Uses of Funds) | $3,600,000 |
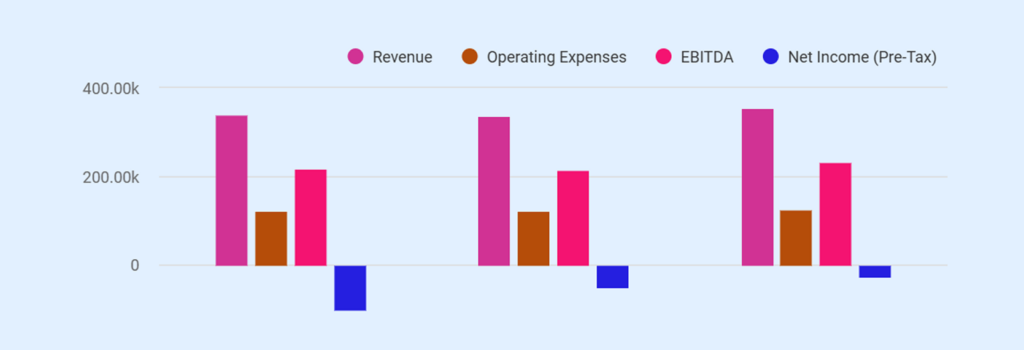
Profit & Loss Statement
| Item | Year 1 | Year 2 | Year 3 |
|---|---|---|---|
| Revenue | |||
| Electricity revenue | $340,000 | $338,300 | $356,409 |
| Total Revenue | $340,000 | $338,300 | $356,409 |
| Operating Expenses | |||
| O&M contract | $44,000 | $44,880 | $45,778 |
| Insurance | $35,000 | $35,700 | $36,414 |
| Land lease | $30,000 | $30,000 | $30,000 |
| Administrative & reporting | $12,000 | $12,000 | $12,000 |
| Total Operating Expenses | $121,000 | $122,580 | $124,192 |
| EBITDA | $219,000 | $215,720 | $232,217 |
| Depreciation | $138,400 | $138,400 | $138,400 |
| EBIT | $80,600 | $77,320 | $93,817 |
| Interest expense | $182,700 | $127,249 | $121,088 |
| Net Income (Pre-Tax) | ($102,100) | ($49,929) | ($27,271) |
Don’t waste time using spreadsheets
Cash Flow Statement
| Item | Year 1 | Year 2 | Year 3 |
|---|---|---|---|
| Net income | ($102,100) | ($49,929) | ($27,271) |
| Depreciation | $138,400 | $138,400 | $138,400 |
| Change in A/R | ($28,333) | $141 | ($1,509) |
| Operating CF | $7,967 | $88,612 | $109,620 |
| Principal repayment | ($96,200) | ($117,351) | ($123,512) |
| Net change in cash | ($88,233) | ($28,739) | ($13,892) |
| Opening cash | $140,000 | $51,767 | $23,028 |
| Ending cash | $51,767 | $23,028 | $9,136 |
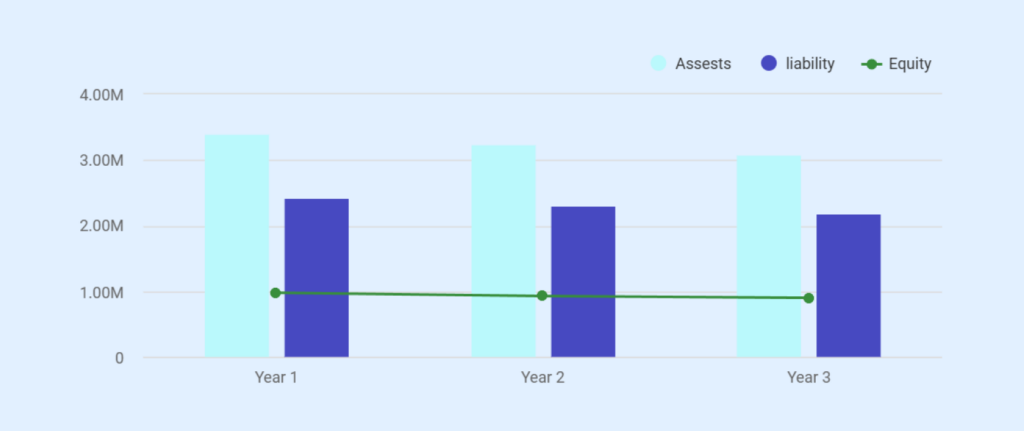
Balance Sheet
| Balance Sheet | Year 1 | Year 2 | Year 3 |
|---|---|---|---|
| Assets | |||
| Cash | $51,767 | $23,028 | $9,136 |
| Accounts Receivable | $28,333 | $28,192 | $29,701 |
| Net Fixed Assets | $3,321,600 | $3,183,200 | $3,044,800 |
| Total Assets | $3,401,700 | $3,234,420 | $3,083,637 |
| Liabilities | |||
| Loan Balance | $2,423,800 | $2,306,449 | $2,182,937 |
| Total Liabilities | $2,423,800 | $2,306,449 | $2,182,937 |
| Equity | |||
| Owner Capital | $1,080,000 | $1,080,000 | $1,080,000 |
| Retained Earnings | ($102,100) | ($152,029) | ($179,300) |
| Total Equity | $977,900 | $927,971 | $900,700 |
| Total Liabilities + Equity | $3,401,700 | $3,234,420 | $3,083,637 |
Break-even Analysis
| Break-Even Level | Threshold | Achieved |
|---|---|---|
| EBITDA | $121,000 revenue | Year 1 |
| Operating Cash Flow | Positive | Year 1 |
| Debt Service Coverage | EBITDA ≥ debt service | Not achieved by Year 3 |
| Net Income | ≥ 0 | Not achieved by Year 3 |
The project achieves operating break-even (positive EBITDA and operating cash flow) in Year 1. However, due to the 70% leveraged capital structure and front-loaded interest expense, full debt-service coverage and accounting profitability are not achieved within the three-year projection period. Based on the current amortization schedule and pricing assumptions, the project is expected to reach full financial break-even in the later operating years as interest expense declines and debt principal amortizes further.
The Quickest Way to turn a Business Idea into a Business Plan
Fill-in-the-blanks and automatic financials make it easy.
Upmetrics
Upmetrics is the #1 business planning software that helps entrepreneurs and business owners create investment-ready business plans using AI. We regularly share business planning insights on our blog. Check out the Upmetrics blog for such interesting reads. Read more