Executive Summary
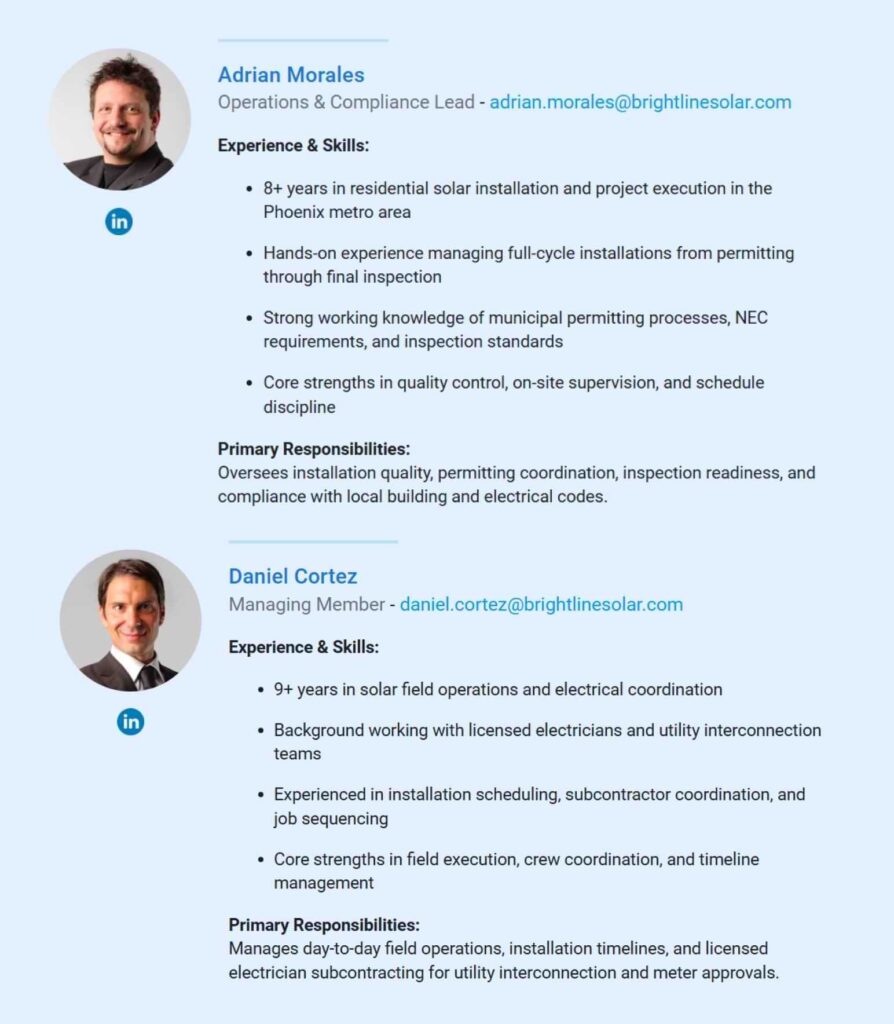
BrightLine Solar Services is a solar installation firm based in Phoenix that specializes in residential projects and will accept small commercial work upon availability of extra crew capacity. There are two licensed owner-operators, Adrian Morales and Daniel Cortez, operating the business. Together, they control the execution of panel installations, the coordination of subcontractors, and the control of quality.
The firm designs and installs residential photovoltaic systems and rules out utility-scale solar projects and solar financing products. This is a managed scope that curtails operational complexity and maintains predictable project schedules. The operations are centralized at one of the Phoenix facilities, which assists in inventory management and crew deployment, giving the work a localized and tightly controlled appearance.
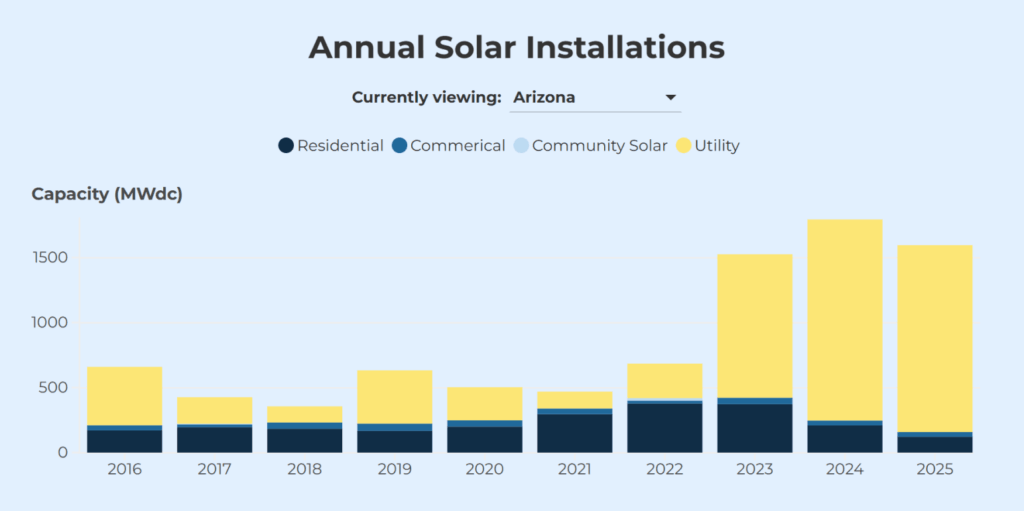
The Solar Energy Industries Association reports that Arizona ranks among the top U.S. states for installed solar capacity. This shows a mature residential solar market with established customer awareness and active installer competition.
BrightLine is requesting a $120,000 term loan to finance start-up assets and working capital, supported by $20,000 in owner equity. Total startup funding of $172,500 includes asset purchases and a $32,500 liquidity reserve built into the initial capitalization.
This reserve supports early cash-flow timing gaps during ramp-up. Loan proceeds fund installation vehicles and tools, initial materials inventory, required licensing and insurance, and core operating systems. No loan funds are allocated to owner compensation.
The company operates on a project-based model that requires upfront material purchases 30 to 45 days before customer payment. While overall inventory levels remain controlled, project-specific material outlays create temporary working capital pressure. Years 1, 2, and 3 revenues will amount to $450,000, $600,000, and $750,000, respectively, as the installation throughput increases. Gross margin stays constant at around 24% throughout the forecast period.
Although Year 1 reflects modest accounting profit, the business reaches steady-state operating break-even in early Year 3, once fixed costs, including normalized owner compensation, are fully absorbed by installation volume. The average monthly fixed costs are about $10,100, and the contribution margin is about 19% with consideration of operating inefficiencies.
The loan will amortize at an annual principal payment of $18,000, and annual debt service will remain below $23,000 during the forecast period. Cash flow will serve the debt service during all years, and the initial deficits will be handled by means of the opening cash buffer and deferral of the owner’s salary. Owners do not take compensation in Year 1. Salaries begin only after installation volume becomes consistent and operating cash flow stabilizes.
By the end of Year 3, the loan balance declines to approximately $66,000, and the business operates with improved cash stability and adequate coverage capacity.

Don’t spend weeks on your first draft
Complete your business plan in less than an hour
Company Description
Legal Structure & Ownership
BrightLine Solar Services operates as a member-managed limited liability company registered in Arizona. Ownership is held equally by two members, each with a 50% ownership interest, who are directly responsible for all operational and strategic decision-making. The company has no outside investors, preferred equity, or passive ownership interests.
Business Location & Service Area
The company operates from 4870 West Valley Parkway in Phoenix, Arizona. This facility supports equipment storage, material staging, and crew dispatch for installation operations.
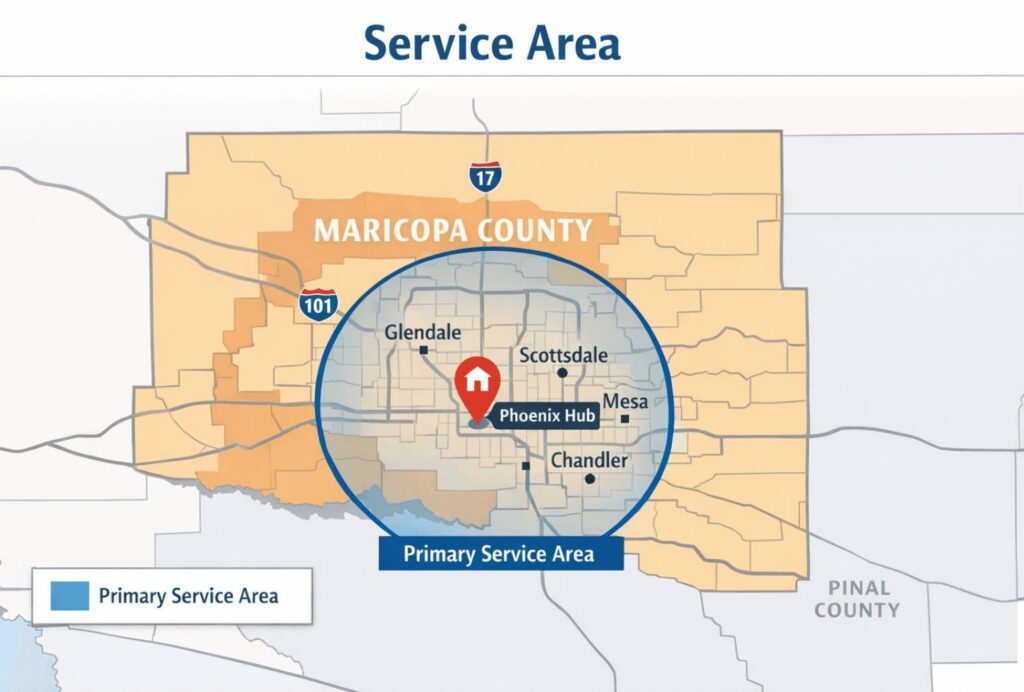
BrightLine’s service area is limited to the Phoenix metropolitan region, including surrounding municipalities within Maricopa County. Service boundaries are defined by drive-time efficiency to preserve installation productivity and cost control. The business does not pursue work outside this area during the forecast period.
Licensing & Regulatory Status
BrightLine maintains all required contractor licensing through the Arizona Registrar of Contractors and carries the necessary contractor bond, general liability, and commercial auto insurance for solar installation work.
Residential solar projects require local building and electrical permits. These permits typically include structural plans, electrical diagrams, and compliance with adopted safety codes such as the National Electrical Code (NEC). Many municipalities allow these permit applications to be submitted online for roof-mounted photovoltaic systems.
Solar systems must also receive utility interconnection approval before they can operate. Solar interconnection applications with utilities such as Arizona Public Service (APS) generally require a signed contract, site plans, electrical diagrams, and a Permission to Operate (PTO) before activation.
Licensed electricians handle grid tie-in work to meet electrical code and utility requirements. Workers’ compensation insurance will be activated when the business expands beyond owner-only labor. Also, the company maintains familiarity with applicable municipal codes governing residential solar installations within its service area.
Operating Model Overview
BrightLine operates on a project-based installation model, with each contract defined by fixed scope and pricing. The company does not offer lease arrangements or power purchase agreements, and customers independently arrange any third-party financing.
Revenue is generated exclusively from installation services. Equipment is purchased at wholesale rates and installed at market pricing, with job-level profitability driven by material costs and labor efficiency. No recurring revenue streams are assumed.
Installation capacity increases gradually over the forecast period as operational efficiency improves and additional crew capacity is added. Licensed electricians are subcontracted for grid interconnection work, allowing the business to maintain compliance while avoiding fixed electrician payroll overhead.
Long-Term Business Objectives
BrightLine’s long-term objectives focus on controlled growth, execution reliability, and financial stability rather than rapid expansion. Over the next three to five years, the company intends to achieve the following outcomes:
- Reach and sustain break-even operations by early Year 3, with consistent monthly installation volume sufficient to cover fixed operating costs and debt service without reliance on owner cash support.
- Increase annual installation revenue to a stable range of $700,000–$800,000, driven by higher throughput per crew rather than price increases or geographic expansion.
- Maintain gross margins at or above 24 percent by controlling material costs, limiting rework, and preserving pricing discipline in competitive bid environments.
- Add one additional installation crew only after backlog and cash flow support sustained utilization, ensuring labor expansion aligns with realized demand rather than projected volume.
- Reduce outstanding loan balance steadily and maintain positive operating cash flow, with the goal of improved liquidity and reduced leverage by the end of Year 3.
These objectives reflect a deliberate growth strategy that prioritizes execution discipline, predictable cash flow, and long-term operating stability.
A business plan shouldn’t take weeks
Service Offerings
Residential Solar Installation Services
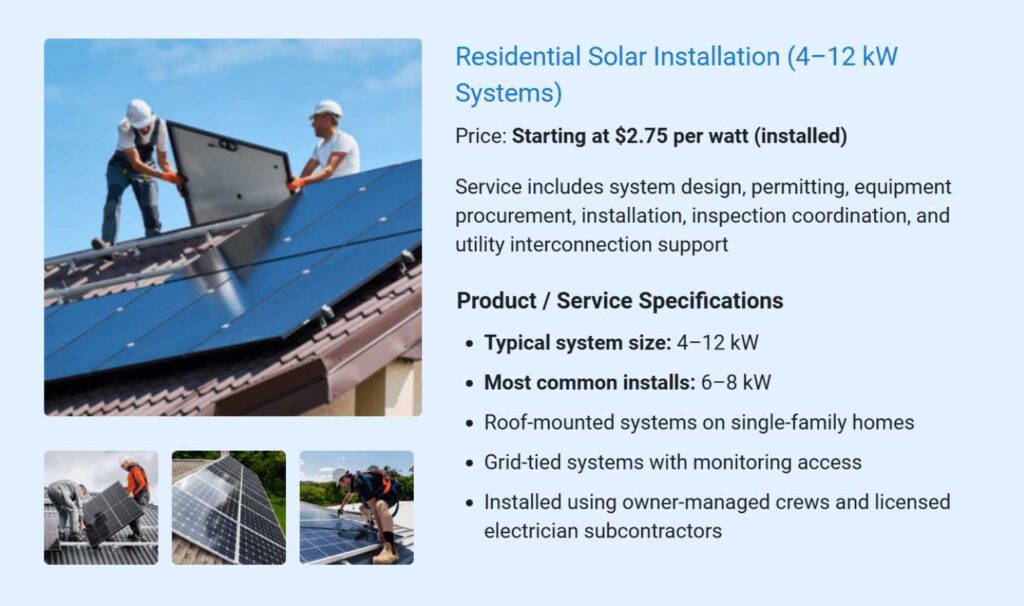
BrightLine designs and installs residential solar energy systems for single-family homes. These projects serve as the primary revenue source due to shorter cycles and faster payment timelines.
The short sales cycles, identical permitting procedures, and better predictability of site conditions make residential work easier to manage the available crew capacity of the business. This approach reduces operational risk and maintains consistent installation output in the early phase.
Small Commercial Installation Services
Small commercial installations are limited to small retail, office, and warehouse-style properties that align with current installation capacity.
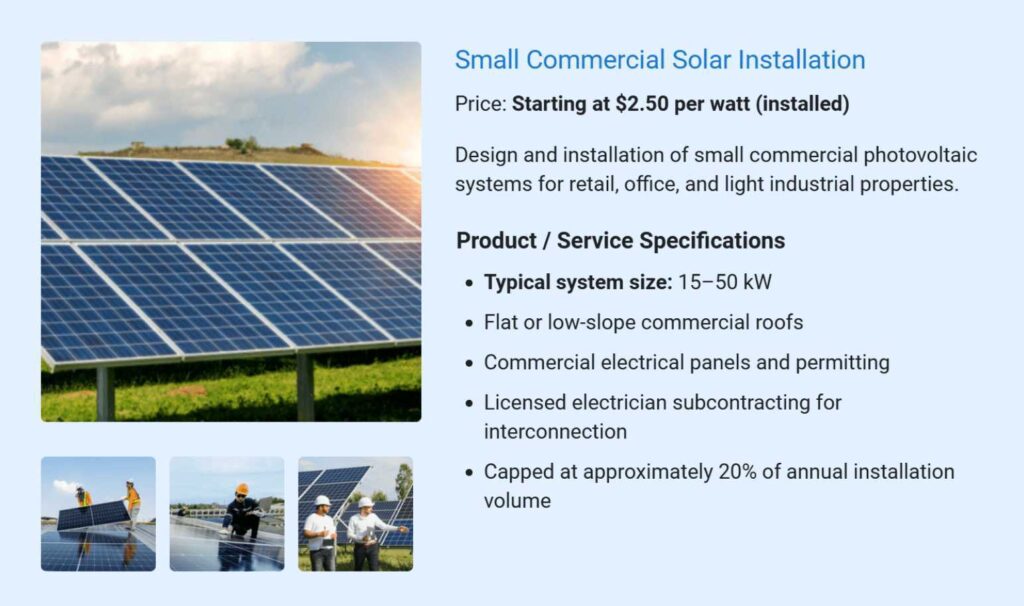
Commercial projects consist of longer permits and longer payment cycles, which make cash flow more sensitive. To manage this risk, the business limits commercial installations to straightforward projects and caps this service line at approximately 20% of total annual installation volume.
Project Scope Limits & Exclusions
BrightLine does not seek utility-scale solar projects or big ground-mount systems, which would demand bonding capacity, special equipment, and project management resources that are not currently in operation.
The company does not offer solar financing products, lease agreements, or power purchase arrangements. Customers arrange any third-party financing independently. This allows the business to avoid administering financial products and remain focused on installation execution.
Battery storage systems, ongoing maintenance contracts, and monitoring subscriptions are excluded during the forecast period. These services introduce additional permitting requirements, technical specialization, and long-term service obligations that fall outside the current operating scope.
Pricing Structure & Contract Terms
Each project is priced using a per-watt installed structure and contracted at a fixed price. Pricing reflects system size, equipment selection, and installation complexity. Small commercial projects benefit from economies of scale compared to residential installations.
The payment is to support cash flow stability. Customers provide a deposit at contract signing to fund material procurement. Final payment is due upon installation completion. Warranty coverage follows standard industry practice, with workmanship warranties provided by the installer and equipment warranties provided by manufacturers.
Market Analysis
Local Market Overview
BrightLine operates within the Phoenix metropolitan area, anchored by Maricopa County (population estimate of 4,726,247). It provides a dense concentration of addressable residential rooftops and small commercial properties within a single drive-time market. This concentration allows installation crews to operate efficiently while serving a large base of owner-occupied housing.
Local demand is reinforced by electricity cost pressure in a cooling-intensive market. According to the U.S. Energy Information Administration, Arizona’s average residential electricity price increased from 15.11¢/kWh (Nov 2024) to 15.66¢/kWh (Nov 2025). In Phoenix, where summer electricity usage is high, even modest rate increases materially affect household utility bills and increase homeowner interest in rooftop solar evaluations.
Phoenix is also an “experienced” solar market rather than an early-adoption market, which changes how competition works. SEIA reports Arizona has 11,060MW of installed solar, ranks 4th nationally for installed solar capacity, and has 324,523 solar installations statewide. For BrightLine, this indicates two things:
- Customers are generally familiar with solar purchasing and installer comparisons, and
- Competition is active, so growth is more dependent on execution speed, clean permitting, and reliable scheduling than on educating the market.
Supply-side conditions point to continued near-term addressable demand because the region is still adding households. Maricopa County continues to add housing at a national-leading pace, expanding the addressable rooftop market.
According to U.S. Census Bureau data cited by Axios, Maricopa County added approximately 38,000 new housing units in the most recent year, more than any other county in the United States. This ongoing housing growth supports near-term residential solar demand as new and recently built homes enter the utility billing cycle.
Target Customer Segments
BrightLine’s primary customer segment is owner-occupied single-family homeowners in the Phoenix metropolitan area. This segment provides the most consistent installation volume due to standardized system requirements, shorter sales cycles, and predictable permitting paths.
Here’s a detailed customer persona sample for BrightLine:
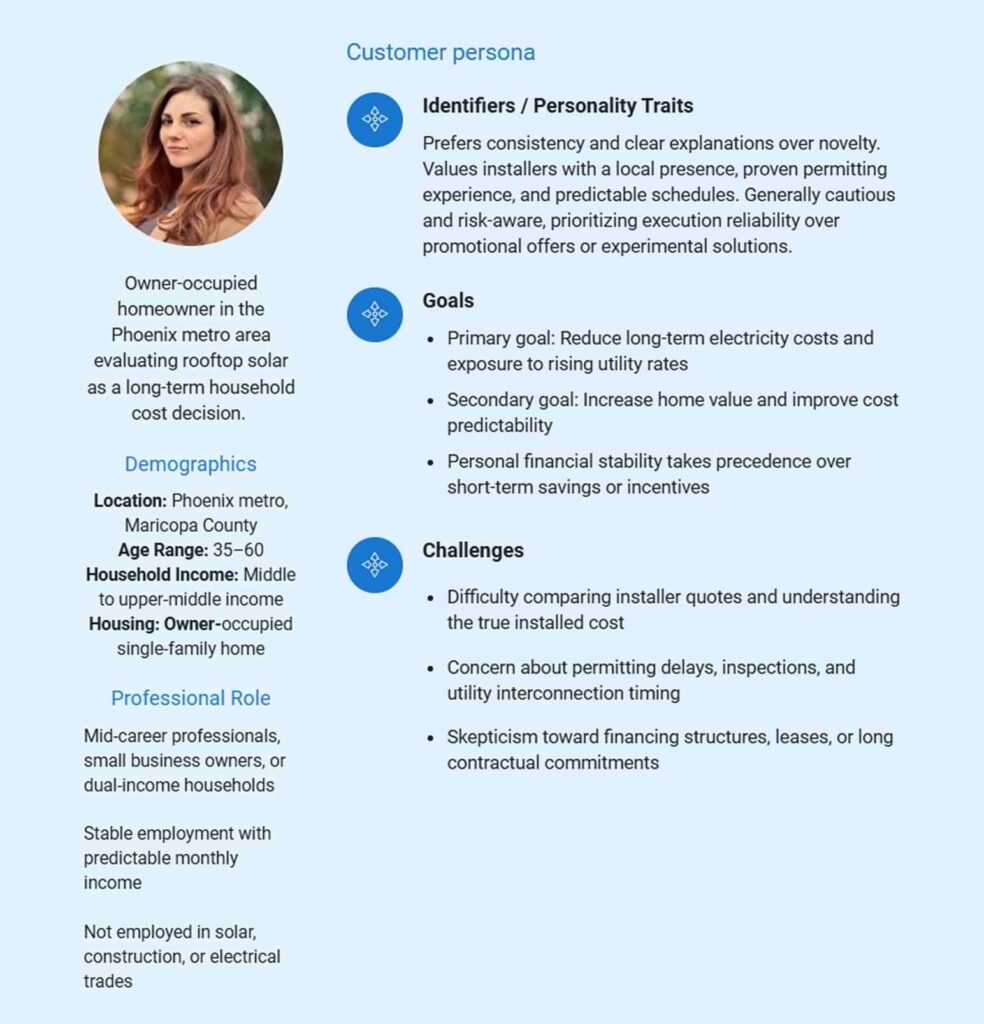
A secondary segment includes small commercial property owners operating retail, office, or light industrial facilities. These customers are more sensitive to scheduling and coordination risk, as installation delays can disrupt business operations. As a result, commercial projects are accepted selectively and limited to installations that align with existing crew capacity and working capital constraints.
Across both segments, the business prioritizes customers seeking fixed-scope installations with clear timelines and limited complexity. This focus supports execution reliability, cash-flow predictability, and controlled growth during the forecast period.
Customer Decision Factors
When selecting installers, Phoenix customers prioritize reliable execution over new or promotional offerings. Buyers are more aggressive in bid comparisons and seek definitive scope, consistent schedules, and exhibited permitting competency. When pricing is within a small market band, installer responsiveness, clarity in the quoting, and ability to handle inspections will often be decisive.
Local Demand Drivers
In Phoenix, residential solar demand is driven primarily by long-term electricity cost savings in a cooling-intensive climate. Rising summer utility bills push homeowners to evaluate solar panels as a household cost-control decision.
State and federal incentives, including the federal Investment Tax Credit (ITC), continue to support adoption by reducing upfront system costs, even as Arizona’s market matures. At the same time, sustainability considerations play a secondary role, particularly among homeowners seeking long-term energy independence or lower environmental impact.
Because the market is established, most buyers enter the process informed and actively comparing installers. As a result, competition centers on execution reliability, permitting competence, and schedule certainty rather than awareness building.
Competitive Landscape: Direct and Indirect Competitors
BrightLine also has to compete with national and regional installers, which are present in the Phoenix area, and with the local companies specializing in rooftops on houses. Most of the competitors are trying to rely on volume-based practices, which may decrease the flexibility of scheduling and the rate of response during permitting or service coordination.
| Company | Market Position | Competitive Impact |
|---|---|---|
 |
National residential solar installer | Competes on scale and financing options; standardized processes can reduce scheduling flexibility |
 |
Residential solar and storage provider | Competes on brand recognition and transparent pricing; limited customization |
 |
Premium residential solar systems | Competes on equipment quality and long warranties; typically higher pricing |
 |
Established Arizona-based installer | Competes on local reputation, permitting familiarity, and residential focus |
Indirect competition comes from electrical contractors and roofers that offer solar services as an add-on service, along with homeowners who defer projects due to roof replacement timing or financing coordination. These alternatives delay decisions rather than eliminate demand and increase bid comparisons across installers.
| Competitor Type | Role in Market | Impact on Demand |
|---|---|---|
| Electrical contractors | Offer solar services as an add-on service | Leverage existing customer relationships, but lack solar specialization |
| Roofing companies | Partner with solar installers | Delay installations until the roof replacement is completed |
| Utility rate structures | Utility pricing and rate changes | Influence customer urgency and timing without directly competing as installers |
Market Risks & Sensitivities
In this market, execution risk is more than demand risk. Installation volume is subject to variation in the permitting backlogs and inspection delays, and the margin is limited in active price competition. Policy and utility rule changes tend to shift customer timing rather than suppress long-term demand, reinforcing the need for cost discipline, schedule control, and conservative growth pacing.
Marketing & Sales Strategy
Lead Sources & Pipeline Development
BrightLine builds its sales pipeline through locally anchored, intent-driven channels rather than national lead marketplaces. Lead flow is designed to reach homeowners already comparing solar installation options, which shortens sales cycles and improves conversion predictability.
Primary lead sources include:
- Local search–driven inbound inquiries, generated through Google Business Profile visibility and service-area–specific search results
- Post-installation homeowner referrals, typically originating from neighbors and personal networks within the same residential areas
- Trade and professional relationships with electricians, roofers, and real estate contacts who encounter homeowners evaluating solar
- Re-engagement of previously quoted prospects who return as utility costs or timing considerations change
The business avoids third-party lead brokers and national solar marketplaces due to low intent quality, price-shopping behavior, and inconsistent acquisition costs. This approach keeps the pipeline aligned with installation capacity and pricing discipline.
Sales Process Ownership & Sales Cycle
Both owners manage sales directly during the forecast period. This keeps the quoting volume aligned with installation capacity and ensures technical accuracy from first contact.
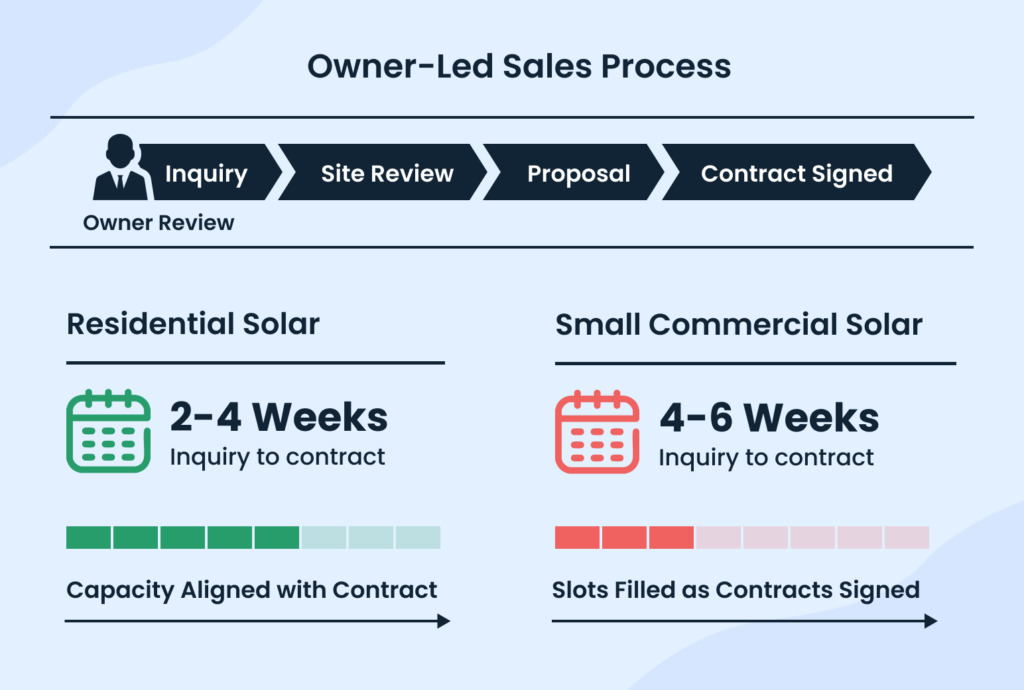
Owner-led sales reduce mispricing risk and prevent over-commitment during periods of limited crew availability.
Contract Conversion & Customer Qualification
BrightLine qualifies projects before contract execution to avoid scope and cash-flow risk. Each project is screened for:
- Roof condition and shading
- Electrical panel capacity
- Permitting feasibility
- Customer readiness and decision authority
Any projects that bring undue complexity or imprecision to timelines are rejected. Fixed-scope contracts enhance clarity and restrict the number of changes that can be made after the signature.
Pricing Discipline & Margin Protection
Pricing follows a per-watt installed methodology based on system size, equipment selection, and installation complexity. BrightLine prices at prevailing market levels rather than discounting to force volume. Owners review each proposal before approval to confirm that material costs, labor requirements, and subcontractor expenses meet minimum margin thresholds.
This discipline prevents underpricing in competitive bid situations and ensures that installation volume does not come at the expense of margin stability or cash flow predictability.
Referrals, Reviews & Repeat Business
Referrals function as a supplemental growth channel rather than a primary acquisition engine. Completed residential installations often generate follow-on inquiries from neighbors and personal networks. The business relies on clean project delivery and responsive service rather than paid referral incentives, which keeps acquisition costs low.
Marketing Spend Controls & Volume Alignment
Marketing spend remains modest and tightly linked to crew capacity and cash flow. BrightLine budgets for steady visibility rather than aggressive lead generation.
| Category | Amount |
|---|---|
| Launch marketing (one-time) | $5,000 |
| Ongoing marketing (annual) | $10,800 |
| Average monthly spend | ~$900 |
Marketing activity scales up or down based on backlog visibility. This control prevents pipeline congestion, limits customer wait times, and avoids overextending resources during peak demand.
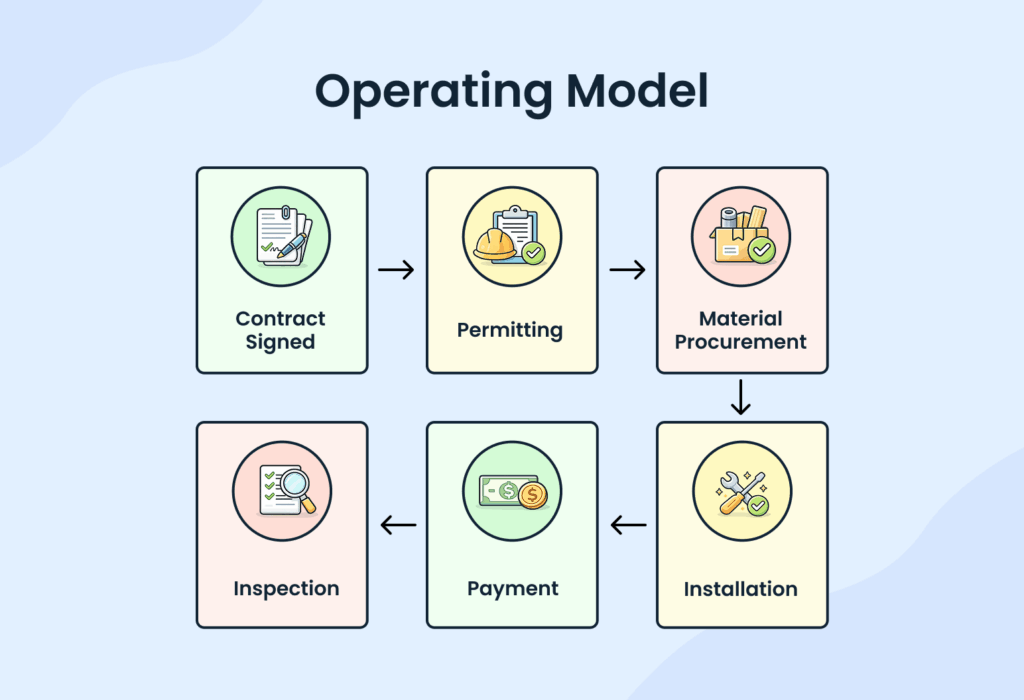
Operational Plan
Installation Workflow & Execution Control
BrightLine operates with a gated installation workflow designed to protect schedules, cash flow, and installation quality. Projects move forward only after contract execution, deposit receipt, and confirmation that installation capacity is available. Owners oversee job sequencing to ensure work stays within defined crew and scheduling limits.
Each installation progresses through defined execution gates rather than parallel activity. Design finalization precedes permitting. Materials release occurs only after permit approval. Installation begins only when inspections and utility coordination can be scheduled within a defined window. This structure prevents idle labor, stalled projects, and inspection bottlenecks.
Crew Structure & Labor Model
BrightLine uses an owner-managed business model during early operations to maintain direct oversight of installation quality, scheduling, and permitting coordination. Both owners supervise field activity, sequence jobs, and manage subcontracted electricians rather than serving as full-time installation labor.
The company adds installation crews only after a sustained backlog and revenue supports additional staffing. This approach keeps payroll aligned with realized installation volume and prevents premature hiring during the ramp-up period.
BrightLine subcontracts licensed electricians for grid interconnection and final electrical work to meet regulatory requirements without carrying fixed electrician payroll.
| Role | Structure | Cost Behavior |
|---|---|---|
| Owners | Full-time, hands-on | Fixed: no salary in year 1 |
| Install crew | Added gradually | Variable |
| Electricians | Subcontracted | Per-project |
Permitting, Inspections & Utility Coordination
For each project, permitting and inspection define the critical path. BrightLine manages these steps internally rather than outsourcing them, keeping schedules under direct control and avoiding third-party delays. Owners submit permits, track approvals, and coordinate inspections directly with municipal departments.
The Phoenix metro area includes multiple jurisdictions that require different permit submissions. Owner’s familiarity with the local requirements reduces resubmissions and speeds approvals. Inspection requests are submitted immediately after installation, while utility interconnection coordination occurs in parallel rather than sequentially.
Operational controls:
- Internal tracking of permit status
- Immediate inspection scheduling post-install
- Parallel utility coordination to reduce downtime
Materials Procurement & Inventory Management
BrightLine follows a controlled procurement model to balance job readiness with working capital discipline. Materials are purchased only after contract execution and deposit receipt. This will avoid excessive inventory build-up, which is speculative in nature, and will also match cash outflows with confirmed revenue.
The company maintains a small inventory of commonly used panels, inverters, and racking components to prevent supply delays from interrupting installations. Inventory levels remain intentionally limited and tied to short-term installation schedules.
| Stage | Timing | Cash Impact |
|---|---|---|
| Contract + deposit | Day 0 | Cash inflow |
| Material purchase | Days 3-7 | Controlled outflow |
| Installation | Weeks 2-4 | No additional material cost |
| Final payment | Post-install | Cash recovery |
Quality Control & Rework Prevention
Quality control starts before installation and continues until final inspection. Before installation begins, the owners review roof layout plans, electrical diagrams, and equipment compatibility. The owners observe major steps during installation, such as racking positioning, mounting of the panel, and conduit routing.
BrightLine verifies electrical integrity, system labeling, and monitoring functionality before scheduling inspections. This process reduces failed inspections, call-backs, and warranty claims.
By maintaining consistent in-house quality control, BrightLine reduces rework costs and protects margins in a price-competitive market.
Capacity Planning & Throughput Limits
Installation capacity defines the pace of growth. BrightLine bases throughput on how many installs concurrently the owners and crews can handle without schedule slipping. The business restricts active projects to the extent that they can be completed and inspected promptly.
Backlog visibility determines whether BrightLine accepts new contracts. Before signing additional projects, the owners review scheduled installations, crew availability, and permitting timelines to confirm capacity. This approach prevents overbooking, reduces customer delays, and protects service reliability.
Growth is achieved by adding more installs per month through familiarity with the process and gradual increment of the crew, not by expanding geographically or making prices discounted.
Subcontractor Management (Electricians)
BrightLine uses subcontracting services of licensed electricians to perform grid interconnection and final electrical work. This provides regulatory compliance without necessarily incurring fixed payroll expenses of having full-time electricians. The business has a limited number of approved subcontractors who are aware of local utility and inspection standards.
The time arrangement (done in advance) ensures that electricians are available when the installations are ready.
| Area | Approach |
|---|---|
| Licensing | Verified per project |
| Scheduling | Coordinated pre-install |
| Cost | Fixed per scope |
| Compliance | Inspector-aligned |
Operational Risks & Mitigation
Operational risk for BrightLine centers on three areas: material price volatility, permitting and inspection delays, and variability in installation volume.
Material price risk arises from fluctuations in panel, inverter, and racking costs. BrightLine mitigates this risk by limiting forward inventory purchases, maintaining a small buffer of commonly used components, and sourcing materials from multiple suppliers. Pricing is reviewed at the time of contract to ensure current material costs are reflected before commitments are made.
Permitting and inspection delays can extend project timelines and affect cash flow. The company mitigates this risk by submitting permit applications immediately after contract execution, tracking approvals internally, and scheduling inspections as soon as installations are completed. Owners manage permitting directly to reduce resubmissions and jurisdictional errors.
Installation volume risk stems from capacity constraints and demand variability. BrightLine controls this risk by accepting new contracts only after confirming available crew capacity, inspection windows, and backlog visibility. Growth is paced deliberately to avoid overbooking and schedule slippage.
Together, these controls limit operational volatility and support consistent project delivery.
Financial Plan
Projections revolve around following a plan, offering small prices, and cash flow plans. Preserving early cash flow and deferring owner pay will ensure that there is enough money at work during the start-up period. All financial statements align with installation capacity, labor structure, and controlled expansion.
Startup Costs
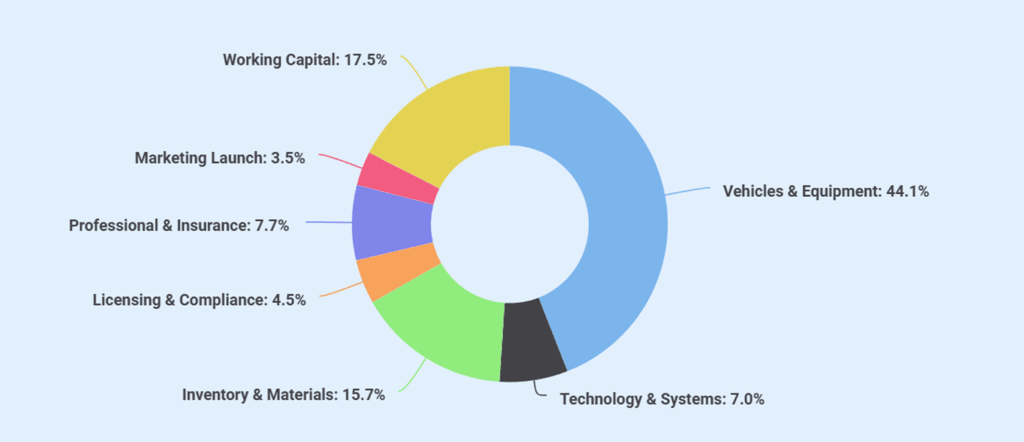
BrightLine requires $172,500 to start and receive the required working capital. The startup expenditure is focused on revenue-producing assets and standardization instead of discretionary overhead, which is a controlled launch strategy.
| Category | Line Item | Amount (in $) | Notes |
|---|---|---|---|
| Vehicles & Equipment | Installation vehicles (used) | 45,000 | Trucks/vans for install crews |
| Installation tools & safety gear | 18,000 | Ladders, harnesses, power tools | |
| Technology & Systems | Design & monitoring software | 6,000 | Solar design, diagnostics |
| IT hardware & setup | 4,000 | Laptops, tablets, networking | |
| Inventory & Materials | Initial solar materials buffer | 22,500 | Panels, inverters, racking stock |
| Licensing & Compliance | Permits, licensing, bonding | 6,500 | State/local requirements |
| Professional & Insurance | Insurance prepayment | 7,500 | General liability, vehicle |
| Legal & accounting setup | 3,500 | Entity setup, contracts | |
| Marketing & Launch | Branding, website, launch ads | 5,000 | Initial demand generation |
| Working Capital | Initial opening cash | 25,000 | Early operating expenses & cash timing needs |
| Total Startup Costs | 172,500 |
Funding
| Source | Amount (in $) |
|---|---|
| Bank Term Loan | 120,000 |
| Owner Capital Contribution | 20,000 |
| Initial Cash Deficit Coverage | 32,500 |
| Total Funding Amount | 172,500 |
Key Financial Assumptions
| Category | Assumption |
|---|---|
| Revenue Driver | Revenue growth comes from increased completed installations, not price increases |
| Pricing Discipline | Flat per-watt pricing; no price inflation or discounting assumed |
| Cost Structure | COGS averages ~76% of revenue, driven by equipment, labor, subcontracted electricians, and permits |
| Gross Margin | Gross margin remains stable at approximately 24% |
| Capacity Constraint | Installation volume is capped by crew availability and permitting timelines |
| Owner Compensation | Owners take no salary in Year 1; compensation begins only after volume stabilizes |
| Cash Flow Timing | Material purchases occur before customer payment, creating early working-capital pressure |
| Debt Structure | Single-term loan with scheduled principal repayment; no refinancing assumed |

Revenue Forecast
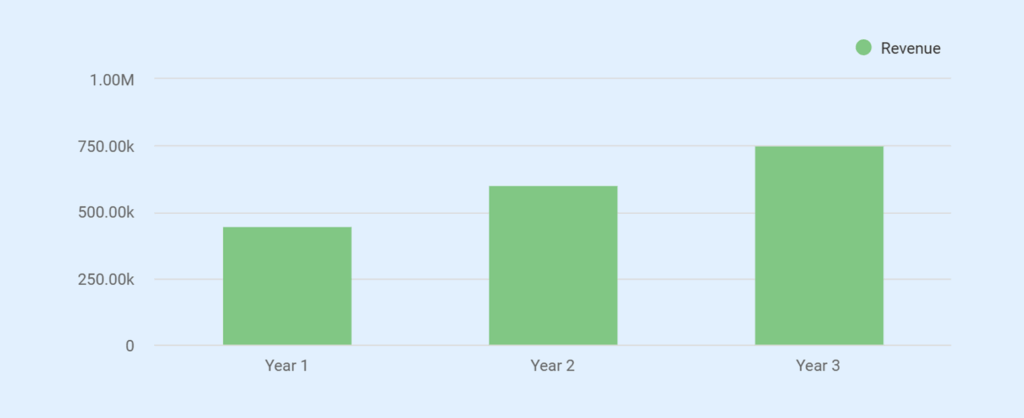
The growth during the forecast period is achieved through an increase in the number of projects the business will be able to accomplish, rather than through the increase in price or the addition of services.
| Revenue Category | Year 1 (in $) | Year 2 (in $) | Year 3 (in $) |
|---|---|---|---|
| Residential Solar | 360,000 | 480,000 | 600,000 |
| Small Commercial Solar | 90,000 | 120,000 | 150,000 |
| Total Revenue | 450,000 | 600,000 | 750,000 |
Income Statement
Projects are the only revenue source. Residential installs make up the majority of the revenue. The business will maintain a minimum number of small commercial jobs to have control over the cash flow and schedule.
| Line Item | Year 1 (in $) | Year 2 (in $) | Year 3 (in $) |
|---|---|---|---|
| Revenue | |||
| Residential solar installations | 360,000 | 480,000 | 600,000 |
| Small commercial installations | 90,000 | 120,000 | 150,000 |
| Total Revenue | 450,000 | 600,000 | 750,000 |
| COGS | |||
| Solar equipment & materials | 225,000 | 300,000 | 375,000 |
| Installer payroll (direct labor) | 72,000 | 96,000 | 120,000 |
| Subcontracted electrician fees | 27,000 | 36,000 | 45,000 |
| Permits, inspections, misc. job costs | 18,000 | 24,000 | 30,000 |
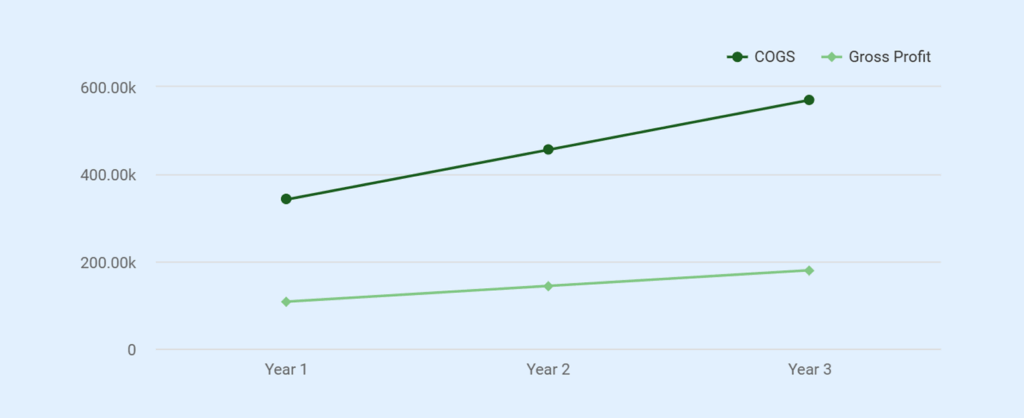
| Total COGS | 342,000 | 456,000 | 570,000 |
| Gross Profit | 108,000 | 144,000 | 180,000 |
| Gross Margin | 24% | 24% | 24% |
| Operating Expenses (OPEX) | |||
| Vehicle fuel & insurance | 15,600 | 16,200 | 17,400 |
| Insurance allocation | 7,440 | 7,800 | 8,160 |
| Software subscriptions | 3,560 | 3,480 | 3,600 |
| Marketing | 10,800 | 10,800 | 10,800 |
| Phone & internet | 2,160 | 2,220 | 2,280 |
| Storage rent | 5,400 | 5,400 | 5,400 |
| Office & admin | 5,000 | 5,400 | 6,000 |
| Owner salaries (2 owners combined) | 0 | 48,000 | 72,000 |
| Total OPEX (before drag) | 49,960 | 99,300 | 125,640 |
| Operational Drag / Leakage (5% of revenue) | 22,500 | 30,000 | 37,500 |
| EBITDA (Corrected) | 35,540 | 14,700 | 16,860 |
| Depreciation (vehicles, tools, IT) | 6,800 | 6,800 | 6,800 |
| Operating Income (EBIT) | 28,740 | 7,900 | 10,060 |
| Interest expense | 5,100 | 4,200 | 3,200 |
| Pre-Tax Income | 23,640 | 3,700 | 6,860 |
The margins are constant throughout the forecast period. Year 2 offers reduced profitability because owner compensation is introduced as an aspect of realistic operating behavior as opposed to assumptions of margin expansion.
Cash Flow Statement
The business experiences early cash pressure due to inventory-heavy operations and payment timing. Material purchases precede customer payment by approximately 30–45 days, requiring disciplined cash management.
| Line Item | Year 1 (in $) | Year 2 (in $) | Year 3 (in $) |
|---|---|---|---|
| Operating Activities | |||
| Pre-Tax Income | 23,640 | 3,700 | 6,860 |
| Depreciation | 6,800 | 6,800 | 6,800 |
| Change in Inventory | (22,500) | (18,000) | (12,000) |
| Change in Accounts Payable | 12,200 | 11,300 | 9,400 |
| Net Cash from Operations | 20,140 | 3,800 | 11,060 |
| Investing Activities | |||
| Equipment & vehicle purchases | (38,000) | (6,000) | (6,000) |
| Net Cash from Investing | (38,000) | (6,000) | (6,000) |
| Financing Activities | |||
| Bank loan proceeds | 120,000 | 0 | 0 |
| Owner capital contribution | 20,000 | 0 | 0 |
| Loan principal repayment | (18,000) | (18,000) | (18,000) |
| Owner distributions | 0 | 0 | (5,000) |
| Net Cash from Financing | 122,000 | (18,000) | (23,000) |
| Net Change in Cash | 104,140 | (20,200) | (17,940) |
| Beginning Cash | (42,000) | 62,140 | 41,940 |
| Ending Cash | 62,140 | 41,940 | 24,000 |
Loan proceeds, owner equity, and the opening cash buffer provide early liquidity. Stabilization of cash occurs by Year 3, in which the throughput and timing friction smooth out.
Balance Sheet
| Line Item | Year 1 (in $) | Year 2 (in $) | Year 3 (in $) |
|---|---|---|---|
| Assets | |||
| Cash | 62,140 | 41,940 | 24,000 |
| Inventory | 22,500 | 40,500 | 52,500 |
| Other current assets | 6,000 | 6,500 | 7,000 |
| Total Current Assets | 90,640 | 88,940 | 83,500 |
| Property & equipment (net) | 81,200 | 68,400 | 55,600 |
| Total Assets | 171,840 | 157,340 | 139,100 |
| Liabilities | |||
| Accounts payable | 12,200 | 23,500 | 32,900 |
| Bank loan balance | 102,000 | 84,000 | 66,000 |
| Total Liabilities | 114,200 | 107,500 | 98,900 |
| Equity | |||
| Owner capital | 20,000 | 20,000 | 20,000 |
| Retained earnings | 37,640 | 29,840 | 20,200 |
| Total Equity | 57,640 | 49,840 | 40,200 |
| Liabilities + Equity | 171,840 | 157,340 | 139,100 |
Loan balances decrease gradually because the principal is recovered, whereas equity is positive during the forecast period.
Break-Even Analysis
| Category | Item | Amount / Detail |
|---|---|---|
| Fixed Cost Base | Total Annual Fixed Costs | ~$121,160 |
| Total Monthly Fixed Costs | ~$10,100 | |
| Includes Owner Salaries | Yes (steady-state) | |
| Variable Cost Structure | Core COGS | ~76% of revenue |
| Operational Drag | 5% of revenue | |
| Total Variable Cost Ratio | ~81% of revenue | |
| Contribution Margin | Contribution Margin % | ~19% |
| Break-Even Point | Monthly Break-Even Revenue | ~$53,200 |
| Annual Break-Even Revenue | ~$638,400 | |
| Performance Context | Year 1 Revenue | $450,000 (below break-even) |
| Year 2 Revenue | $600,000 (near break-even) | |
| Year 3 Revenue | $750,000 (above break-even) | |
| Interpretation | Break-Even Timing | Early Year 3 |
| Educational Insight | Key Driver | Installation volume per crew |
| Risk Highlight | High variable cost sensitivity |
The Quickest Way to turn a Business Idea into a Business Plan
Fill-in-the-blanks and automatic financials make it easy.
Upmetrics
Upmetrics is the #1 business planning software that helps entrepreneurs and business owners create investment-ready business plans using AI. We regularly share business planning insights on our blog. Check out the Upmetrics blog for such interesting reads. Read more