Starting a pharmacy is not just about dispensing medications. Before a single prescription is filled, there are licensing requirements, capital commitments, inventory decisions, and a patient acquisition ramp that determines whether the business survives its first year. Most pharmacies that struggle do so not because the clinical side fails, but because the financial and operational planning wasn’t specific enough before the doors opened.
A business plan forces that specificity. It defines what the pharmacy will and won’t do, what it will cost to open, how long until break-even, and what happens if volume is slower than projected. In an industry where reimbursement rates are set by third parties, and margins leave little room for error, those details matter more than they do in most businesses. A plan also explains the market case to a lender: who the target patients are, why they would leave a chain pharmacy, and how the business will keep them.
The sample plan below covers all of it. Use it as a pharmacy business plan template, a reference, or a starting point for the conversations you’ll need to have with a bank.
Pharmacy Business Plan (CommunityCare Pharmacy)
Executive Summary
CommunityCare Pharmacy is opening at 3821 West William Cannon Drive, Suite 120, Austin, TX 78749. It’s 1,800 square feet in a neighborhood shopping center, serving residents within a 3-mile radius. Dr. Sarah Patel, a licensed Texas pharmacist with 8 years of community pharmacy experience, runs daily clinical operations as Pharmacist-in-Charge. Michael Patel handles finance, administration, and everything that would otherwise pull Sarah away from the counter. Both owners are providing personal guarantees on the loan.
The business is built around one constraint that shapes everything else: Sarah can’t leave her current role until the pharmacy is generating consistent revenue. That timeline drives how we’ve structured staffing, how aggressively we’re projecting Year 1, and how carefully we’ve sized the operating scope. It’s not a weakness in the plan. It’s the reason the plan looks the way it does.
Longer term, the pharmacy will evaluate extended hours, a second pharmacist, or a second location once cash flow is stable and prescription volume is consistent. Compounding is on the list, too, subject to capital and demand. We’ll know more at month 18 than we do right now.
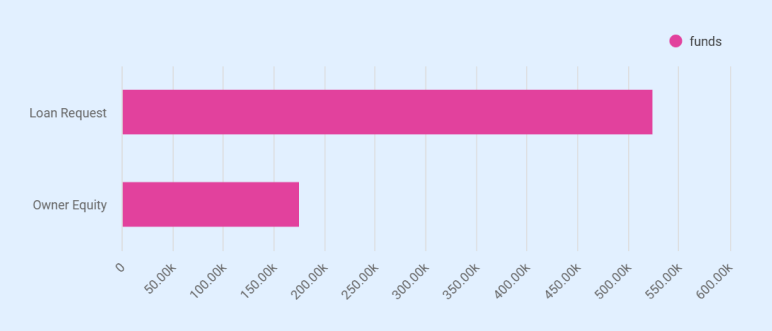
Loan Request
CommunityCare is requesting a $525,000 Small Business Term Loan from Bank of America, N.A., at 7.95% fixed over 10 years. The owners are contributing $175,000 in equity, bringing the total startup capital to $700,000.
Of that, $325,000 goes directly to prescription and OTC inventory. The remainder covers:
| Use | Amount |
| Leasehold build-out | $140,000 |
| Pharmacy fixtures and shelving | $70,000 |
| Pharmacy software and POS systems | $45,000 |
| Security systems and safes | $30,000 |
| Licenses, legal, consulting | $15,000 |
| Insurance premiums | $10,000 |
| Working capital reserve | $15,000 |
The $15,000 reserve is thin, and we know it. It’s sized to the reality of what we could raise, not what we’d ideally want sitting in the account.
Market Position and Services
CommunityCare Pharmacy is positioned as a neighborhood independent pharmacy focused on recurring prescription volume from chronic-care patients. These patients form the core of the pharmacy’s dispensing activity because their prescriptions refill regularly throughout the year.
CommunityCare is built around one patient type: chronic-care patients who refill monthly. Chronic conditions such as hypertension and diabetes drive consistent demand. Roughly 34 million U.S. adults have hypertension, and about 40.1 million have diabetes, conditions that often require monthly prescriptions and long-term medication management.
About 92% of projected revenue comes from prescription dispensing, with OTC and immunizations filling in the rest. Chronic-care patients on 2 or 3 medications generate 24-36 transactions a year each. That refill cycle is the business.
The pharmacy doesn’t compete with chains on price. PBM contracts set what patients pay; the copay is the same at CVS or here. The difference is everything else:
| What chains offer | What CommunityCare offers |
| Scale and extended hours | Wait times under 15 minutes |
| Drive-through pickup | Same pharmacist every visit |
| Broad OTC selection | Direct phone access during business hours |
| High prescription throughput | Medication sync for chronic-care patients |
We excluded compounding, specialty infusion, mail-order, and 24-hour operations to keep startup costs at approximately $700,000 and maintain a manageable operating model.
Financial Outlook
Year 1 projects total revenue of $1,043,460 with a net loss of ($160,587). The loss is expected during the ramp period as prescription volume grows from approximately 40 to 85 prescriptions per day. If volume growth is slower than projected, management will defer salary increases and reduce discretionary spending to preserve cash.
Ending cash is projected at $221,861, with an operating cash flow of $242,682. The net loss is driven in part by $65,000 in non-recurring startup costs, including prepaid rent, insurance, and licensing, which do not recur in later years. Year 1 debt service is supported by the initial capital structure rather than operating income.
The 3-year trajectory:
- Year 1: ($160,587) net loss. Volume ramps from 40 to 85 prescriptions per day. If growth is slower than projected, we defer salary increases and cut discretionary spending first.
- Year 2: $15,700 net income. Volume reaches 110 prescriptions/day, clearing the break-even of roughly 105/day. Debt service coverage ratio of 1.19x on EBITDA of $90,805.
- Year 3: $31,480 net income. Revenue reaches $2,071,600. DSCR improves to 1.35x.
Year 1 debt service is covered by the cash cushion from loan proceeds and equity, not operating income. That’s the honest sequencing.
Want a professional plan like this sample?
Upmetrics AI generate a complete, investor-ready plan for you

Company Description
CommunityCare Pharmacy is a multi-member LLC registered in Texas. The pharmacy will operate from a leased 1,800-square-foot retail unit at 3821 West William Cannon Drive, Suite 120, Austin, TX 78749. The location was selected for 3 practical reasons:
- Proximity to established residential neighborhoods in the 78749 corridor
- Nearby medical offices and urgent care clinics that generate prescription traffic
- Strong street visibility along West William Cannon Drive.
The unit sits in a neighborhood shopping center with shared parking and direct access from a major local roadway, making it convenient for patients picking up prescriptions during routine errands.
Ownership Structure
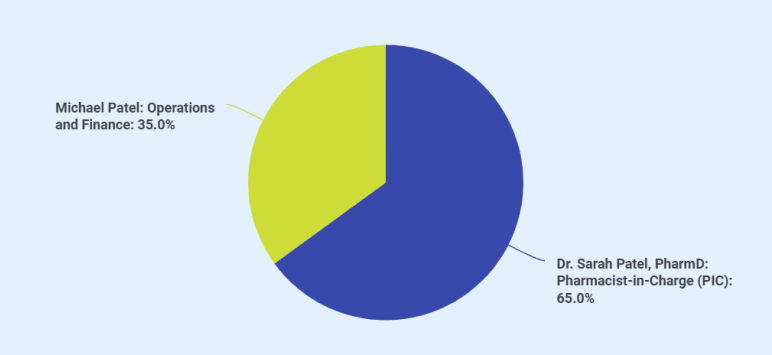
Dr. Sarah Patel holds 65% ownership, and Michael Patel holds 35%.
Dr. Sarah Patel holds a Doctor of Pharmacy (PharmD) degree and has 8 years of experience working in community pharmacy settings, where she managed prescription workflow, patient counseling, immunizations, and regulatory compliance. While this will be her first pharmacy ownership, her prior experience includes supervisory responsibilities within retail pharmacy environments, preparing her for the Pharmacist-in-Charge role.
Michael Patel has a background in small business finance and operations management. His responsibilities include bookkeeping oversight, vendor negotiations, payroll administration, insurance renewals, regulatory filings, and lender reporting. This pharmacy represents his first ownership position in the healthcare sector, though his operational experience supports the administrative and financial functions required to run the business.
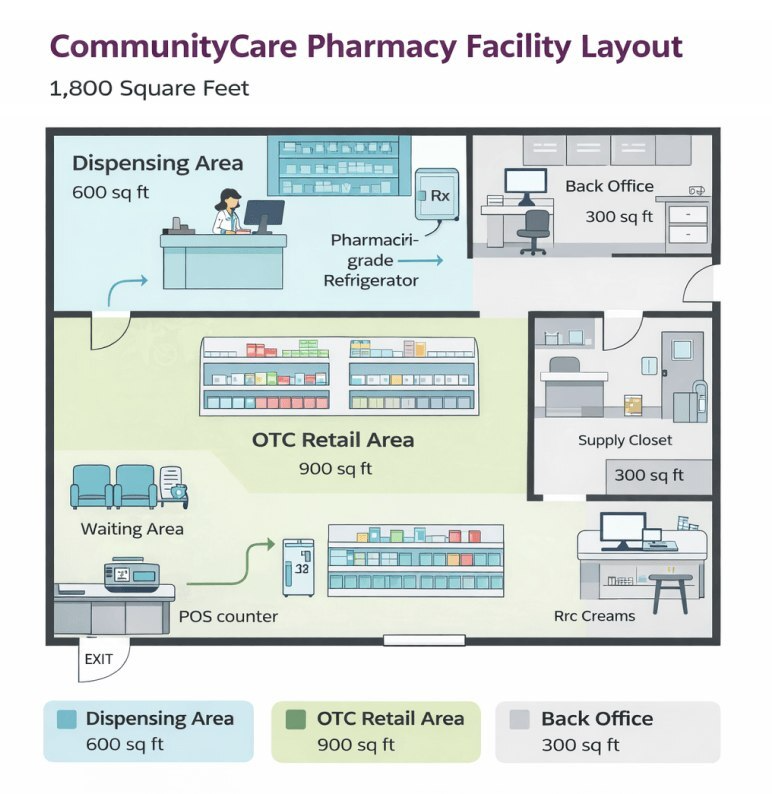
Facility and Operating Scope
The space is 1,800 square feet at $24 per square foot annually, $43,200 in Year 1 with 3% escalation. We chose small on purpose. A typical CVS runs 10,000 to 13,000 square feet. Lower rent, lower utilities, and patients aren’t waiting behind a dozen people.
| Zone | Square footage | Purpose |
| Dispensing area | 600 sq ft | Prescription intake, verification, counseling |
| OTC retail | 900 sq ft | Front-end product sales |
| Back office and storage | 300 sq ft | Inventory, admin, controlled substance safe |
The layout supports up to 130-150 prescriptions a day. If volume consistently exceeds that, the answer is more staffing and extended hours, not a bigger space.
Scope is intentionally narrow:
- In: Prescription dispensing, OTC retail, immunizations
- Out: Sterile compounding, specialty infusion, mail-order, 24-hour operations
The exclusions weren’t close calls. Compounding alone requires a clean room, a separate pharmacy license, and $150,000 to $250,000 in additional build-out. A 24-hour schedule means a second pharmacist at $130,000 or more a year, and overnight volume in a residential neighborhood doesn’t justify it. Keeping the scope narrow is what keeps the startup capital at $700,000 and the operation manageable for three clinical staff plus Michael.
Business Goals
The goals here are tied to specific numbers, not directional statements.
- Year 1: Build a base of at least 200 chronic-care patients and reach 85 prescriptions/day by year-end.
- Year 3: Exceed 130 prescriptions/day with stable profitability and consistent patient retention.
Beyond that, the honest answer is that longer-term plans depend on how the first 18 months go. Extended hours, a second pharmacist, a second location, those are real options, but we’re not projecting them into the numbers. We’ll know what’s feasible once the base is built.
Products & Services
CommunityCare Pharmacy generates revenue from 3 sources. Prescription dispensing is the core of the business, accounting for approximately 92% of projected revenue. Over-the-counter retail sales contribute roughly 6%, and immunization and clinical services make up the remaining 2%.
Revenue Streams
| Revenue Stream | % of Revenue | Avg. Transaction Value | Year 1 Revenue |
| Prescription Dispensing | ~92% | $48 net/Rx | $951,600 |
| OTC/Front-End Sales | ~6% | $14/transaction | $76,860 |
| Immunizations/Clinical Services | ~2% | $30/administration | $15,000 |
| Total | 100% | $1,043,460 |
The $48 average net reimbursement/prescription is what the pharmacy actually collects after PBM adjudication, blended across commercial insurance, Medicare Part D, and cash pay. This is the single most important number in the model. A $2 shift either way changes annual revenue by roughly $40,000 at Year 1 volumes and nearly $80,000 by Year 3.
We manage that exposure by prioritizing generic dispensing, maintaining a cash-pay option, and keeping COGS tight through wholesaler contract terms. If rates compress beyond projections, we defer our own salaries and cut discretionary spending before touching anything patient-facing.
Prescription Medications
Prescription medications are the primary driver of the pharmacy’s revenue and daily operations. The business model is built around consistent dispensing volume generated by patients managing chronic health conditions that require regular refills. Because most prescriptions are filled on a monthly cycle, this creates predictable repeat transactions once patients establish the pharmacy as their regular provider.
| Category | Description |
| Chronic-care Medications | – Make up the majority of dispensing volume. |
| – Patients with diabetes, hypertension, and high cholesterol typically refill prescriptions monthly. | |
| – A single patient on 3 chronic medications generates 30-36 transactions annually. | |
| – These patients create a stable revenue foundation. Switching costs are high due to synchronized prescriptions. | |
| Acute Treatments | – Includes antibiotics, short-course prescriptions, and seasonal medications. |
| – Generates volume but not repeat prescriptions. A patient with a sinus infection may only fill one prescription and not return for months. | |
| Generic vs. Brand-name Medications | – Generic dispensing is prioritized where clinically appropriate for better margins after PBM clawbacks and DIR fees. |
| – Brand-name medications are maintained only when no generic equivalent exists or when specifically required by a physician. | |
| – Dr. Patel will adjust the generic-to-brand ratio based on local prescribing patterns, which will become clearer over time. | |
| Controlled Substances | – Stocked based on clinical need, not speculative volume. |
| – Schedule II through V medications are maintained based on current patient demand and reordered through DEA-compliant channels. | |
| – Overstocking creates regulatory exposure and ties up cash; understocking may result in turning patients away. | |
| – Stock levels are adjusted weekly based on dispensing velocity. |
Over-the-Counter Products
The OTC section occupies approximately 900 square feet of retail floor space. Product categories include:
- Pain relievers and cold/flu medications
- Vitamins and supplements
- First-aid supplies
- Basic durable medical supplies (glucose meters, blood pressure monitors, braces)
OTC inventory is stocked at $25,000 at launch with a 60% cost of goods, leaving a 40% gross margin/transaction. While OTC sales contribute a smaller share of total revenue, the per-transaction margin is higher than prescription dispensing (40% vs. 24% on Rx). The product selection is intentionally narrow. CommunityCare isn’t competing with H-E-B or Walmart on breadth or pricing. The front-end exists to serve patients who are already in the store picking up prescriptions. A patient collecting a blood pressure medication may also purchase a home blood pressure monitor. That’s the buying behavior the OTC section supports.
Slow-moving OTC items are the most common inventory mistake in small pharmacies. Every dollar sitting in a vitamin bottle that doesn’t sell for 3 months is a dollar not available for prescription inventory, which turns faster and at a higher total margin. OTC purchasing decisions will be reviewed monthly against actual sales data, not supplier promotions.
Immunization and Clinical Services
Dr. Patel is certified to administer immunizations under Texas pharmacy law. The pharmacy will offer flu shots, shingles vaccines, and routine immunizations: 500 administrations projected in Year 1 at $30 a dose, growing to ~1,343 by Year 3. COGS runs at 35%, which makes this the highest-margin stream by percentage. It’s still seasonal and modest. Volume sits between October and February; outside flu season, it’s sporadic. During peak months, we’ll put signage up, coordinate with nearby employer groups, and offer walk-ins. This stream won’t move break-even on its own. The real value is that immunized patients come through the door, and some of them transfer their prescriptions. That’s what we’re actually after.
The pharmacy also offers medication counseling, prescription transfers, and medication synchronization. Sync is worth explaining: it aligns all of a patient’s refills to a single monthly pickup date. We don’t bill for it separately, but a chronic-care patient whose medications are synchronized here has very little practical reason to fill anywhere else. That retention is the point. No compounding, no specialty oncology, no high-cost infusion; same reasoning that shaped every other scope decision in this plan.
Market Analysis
Industry Overview
The U.S. pharmacy market is large and, in practice, not particularly welcoming to new entrants right now. Prescription drug spending exceeds $700 billion annually. Independent pharmacies represent about 35% of all retail pharmacy locations, nearly 19,000 stores, but they’re operating at a 10-year low in gross profits, driven by PBM reimbursement structures that, in some cases, pay below cost, and wages that have climbed faster than reimbursement rates have followed.
We know this is going in. That’s not a reason to stop. It’s a reason to be precise about how we structure the business.
Service Area and Local Market
Southwest Austin’s 78749 corridor checks the boxes that matter for a prescription-volume business. Not every box, in practice, but the ones we care most about:
- Median household income of $93,658, well above the national median. Higher-income households carry commercial insurance with prescription benefits. That means less exposure to cash-pay-only transactions, which is where independents get squeezed hardest.
- Seniors on Medicare Part D fill more prescriptions per month and are more likely to actually want to talk to their pharmacist. That’s our patient.
- Medical offices, dental clinics, and urgent care facilities are within walking distance on the West William Cannon corridor. Those providers generate e-prescribe volume without us having to chase it.
Competitive Landscape
Chain pharmacies, like CVS, Walgreens, H-E-B, and Walmart, dominate Austin’s pharmacy landscape. They have things we don’t: 24-hour locations, drive-throughs, in-store clinics, and broader OTC selection. Some patients want exactly those things and will never switch. CommunityCare doesn’t need those patients.
What’s happened with chain closures nationally is worth noting, but we’re not counting on it. CVS has shuttered roughly 900 locations since 2022, with another 270 planned for this year. Walgreens has announced 1,200 more over the next 3 years. Those closures create gaps in access in some markets, maybe here too, maybe not. The opportunity for CommunityCare isn’t a structural vacancy. It’s patient behavior.
Patients leave chain pharmacies for reasons that have nothing to do with whether the chain has closed:
- Wait times of 20-45 minutes at peak hours
- A different pharmacist every visit, with no continuity and no one who knows their medication history
- Automated phone systems that can’t answer a clinical question
- Medication sync is offered inconsistently, if at all
Those patients exist in this zip code right now. A pharmacy that answers the phone directly, keeps wait times under 15 minutes, and has the same pharmacist behind the counter every day will capture some of them. We need 65 prescriptions a day in Year 1. In a zip code of 35,000 people, that’s a small fraction of existing demand.
Scope Decisions
We excluded sterile compounding, specialty infusion, mail-order, and 24-hour operations before signing a lease. Each one adds licensing, equipment requirements, insurance costs, and staffing complexity that would have pushed startup capital past $1.2 million. More importantly, each one competes with Sarah’s time at the prescription counter. The constraint isn’t capital, in practice. It’s the pharmacist’s hours. Keeping the scope narrow is what keeps this viable at $700,000 and manageable for one licensed pharmacist and two technicians.
The reimbursement pressure that’s closing chain locations squeezes independents too. We’re entering this market knowing the economics. We think the operating model, small footprint, narrow scope, chronic-care focus, survives those economics better than a pharmacy trying to do everything.
Customer Segments
Not all customers contribute equally to revenue. CommunityCare pharmacy’s patient base breaks down into 4 segments, ranked by importance:
| Segment | Revenue Priority | Prescription Behavior | Estimated Share of Rx Volume |
| Chronic-care patients | Primary | 10-12 refills/year/medication; monthly visits | ~60% |
| Seniors (65+) | High | Multiple medications; Medicare Part D; value pharmacist interaction | ~20% |
| Families/acute-care | Supplemental | Sporadic; antibiotics, pediatric Rx, seasonal | ~15% |
| OTC-only shoppers | Incidental | No prescriptions; convenience purchases | ~5% |
Chronic-care patients are the foundation. A single patient managing diabetes with two medications and a cholesterol prescription generates 30-36 transactions/year. 50 such patients represent over 1,500 annual prescriptions. The pharmacy needs approximately 19,825 prescriptions in Year 1 to hit revenue targets. Building a base of 150-200 chronic-care patients who refill monthly gets the pharmacy roughly a third of the way there.
Seniors overlap with the chronic-care segment but warrant separate attention. Many seniors are accustomed to asking their pharmacist questions they wouldn’t raise during a physician visit. Chain pharmacies staffed by rotating pharmacists can’t provide that continuity. An independent pharmacy with the same pharmacist behind the counter every day can.
Market Risks
PBM reimbursement pressure is the most significant market-level risk. A 2024 survey of community pharmacists found that more than 50% reported losing money on at least 30% of the prescriptions they fill, and 85% stated that DIR fees threaten the viability of their business. CommunityCare can’t eliminate this risk. It manages it through generic prioritization (generics carry better reimbursement spreads), disciplined wholesaler purchasing, and maintaining enough cash-pay and immunization volume to partially offset compression. Independent pharmacies saw a 10-year high in the cost of goods in 2024. That trend isn’t reversing soon.
The second risk is patient acquisition speed. The financial model assumes a ramp from 40 prescriptions/day in Q1 to 85/day by Q4 of Year 1. If physician referrals and prescription transfers develop more slowly, the ramp extends, and cash reserves absorb a longer loss period. This is the primary reason the owners suppressed Year 1 salaries and maintained a cash reserve.
Third risk: A new competitor entering the immediate area. A second independent or a relocated chain within one mile would pressure acquisition. The best defense is building a loyal chronic-care base quickly. Patients whose prescriptions are synchronized rarely switch.
A fourth risk is reimbursement pressure on high-cost GLP-1 medications. Industry surveys indicate that a large majority of independent pharmacies lose money dispensing these drugs due to unfavorable reimbursement terms. If demand for GLP-1 prescriptions increases in this service area, CommunityCare will take a controlled approach to stocking them. Inventory levels will be limited, prescriptions may be filled on an order-by-need basis, and dispensing decisions will consider reimbursement terms to avoid consistent negative margins.
Marketing & Sales Strategy
CommunityCare’s marketing operates under a practical constraint: both owners are working in the pharmacy most days. Marketing channels are therefore selected based on reliability and low ongoing time requirements. The strategy prioritizes physician referrals, prescription transfers, insurance network visibility, and digital tools that allow patients to find and interact with the pharmacy easily.
Marketing Budget
| Year | Budget | Focus |
| Year 1 | $12,000 | Signage, print materials, physician outreach, local awareness |
| Year 2 | $10,000 | Prescription transfer campaigns, online visibility, patient retention |
| Year 3 | $8,000 | Maintenance marketing and referral-driven growth |
Spending is front-loaded during the first year when the pharmacy is establishing its patient base. As prescription relationships build and refill cycles stabilize, word-of-mouth and repeat patients become the primary drivers of growth.
Primary Acquisition Channels
Physician and clinic referrals
This remains the primary acquisition channel. Dr. Patel will visit physician offices, urgent care clinics, and medical practices within roughly a two-mile radius during the early months before prescription volume reaches full capacity. Leave-behind materials include contact details, accepted insurance networks, hours, and medication synchronization information. Physicians who send prescriptions electronically can quickly route them to CommunityCare once the pharmacy is established in their systems.
Prescription transfers
Patients frequently move prescriptions away from chain pharmacies due to wait times or difficulty contacting staff. CommunityCare will handle prescription transfer requests by phone and through the pharmacy’s online system. The goal is to make transferring prescriptions simple and completed within the same business day whenever possible.
Insurance directory visibility
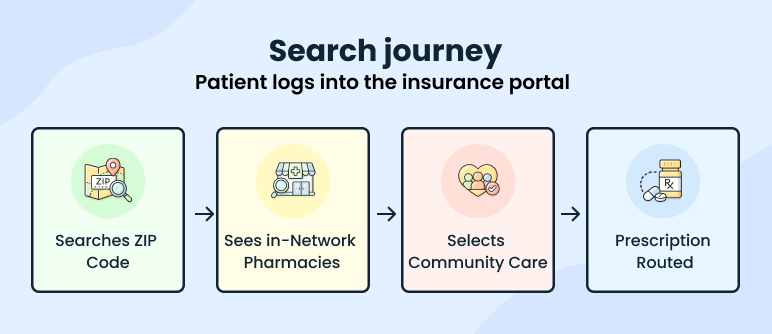
Many patients locate pharmacies through their insurance provider’s pharmacy search tools. Participation in major pharmacy benefit manager networks ensures CommunityCare appears in these directories when patients search by ZIP code. Being listed in these networks functions as a passive but important acquisition channel.
Digital Discovery and Patient Access
Although social media isn’t expected to drive prescription volume directly, digital visibility is important for local discovery and patient convenience. CommunityCare maintains an online presence that supports patient access rather than ongoing content marketing.
Key digital components include:
- Google Business Profile and search visibility, allowing patients searching for nearby pharmacies to find hours, phone number, and directions.
- Online prescription refill requests through the pharmacy management platform allow patients to request refills without calling.
- Automated refill reminders via text or phone notifications to improve adherence and capture repeat prescriptions.
- Prescription transfer forms on the pharmacy website, allowing new patients to initiate transfers online.
These systems reduce phone volume, improve refill compliance, and allow patients to interact with the pharmacy outside of business hours.
Patient Retention
Acquiring a patient matters less than keeping them. Medication synchronization is the primary retention mechanism. Sync aligns all of a patient’s refills to a single monthly pickup date. A patient on 3 chronic medications who syncs at CommunityCare visits once a month on a predictable schedule. That routine is hard to break. Synchronized patients rarely transfer out because moving multiple prescriptions simultaneously is inconvenient and risks gaps in medication supply. Every chronic-care patient will be offered sync at their first counseling session.
Contingency for Slow Acquisition
The front-loading of physician outreach in months 1 through 3 is deliberate. Once daily volume reaches 60-70 prescriptions, Dr. Patel’s time at the counter becomes the priority. Marketing outreach is the first thing that slips when volume picks up. The plan accounts for that by concentrating on relationship-building before the ramp.
If physician referrals or prescription transfers grow more slowly than expected, the pharmacy will increase community outreach through health fairs, employer flu shot clinics, and local print advertising. These tactics require modest incremental spend and can be deployed without pulling Dr. Patel off the prescription counter.
Management & Staffing
CommunityCare operates with a lean staffing structure designed to match prescription volume while keeping payroll manageable during the early ramp period. The pharmacy is owner-operated, with both owners actively involved in daily operations. Clinical oversight remains with the licensed pharmacist, while administrative and financial responsibilities are handled separately to ensure operational efficiency.
Management Team
Dr. Sarah Patel, Pharmacist-in-Charge
Sarah is the reason this pharmacy can operate. Texas law requires a licensed Pharmacist-in-Charge for drug storage, dispensing accuracy, controlled substance oversight, and compliance. Without that license, the pharmacy can’t open. That’s not a formality; it shapes every staffing and scheduling decision in this plan.
She brings 8 years of community pharmacy experience, including two years managing a high-volume medication synchronization program that taught her more about patient preference patterns and dispensing velocity than anything else she’s done. That background is the direct ancestor of how CommunityCare is thinking about chronic-care patient retention and medication synchronization.
Her responsibilities at the counter:
- Prescription verification and clinical review
- Medication counseling and patient interaction
- Controlled substance oversight and DEA compliance
- Immunization administration
- Physician relationship development and e-prescribe coordination
- Medication synchronization program management
Michael Patel, Operations and Finance
Michael’s role exists because of one reality: every hour Sarah spends on bookkeeping or vendor calls is an hour she’s not verifying prescriptions or counseling patients. He handles everything that would otherwise pull her away from the counter.
His responsibilities:
- Financial management and lender reporting
- Inventory purchasing coordination and wholesaler relationships
- Vendor negotiations and insurance renewals
- Regulatory filings and payroll oversight
- PBM network enrollment and insurance directory maintenance
Both owners are active daily. No silent partners, no outside investors, no planned equity dilution.
Staffing Structure
The pharmacy launches with a small team focused on prescription processing efficiency and patient service.
| Position | Role | Primary Responsibilities |
| Pharmacist-in-Charge (Dr. Patel) | Clinical leadership | Prescription verification, patient counseling, immunizations, compliance oversight |
| Pharmacy Technician – Full-Time | Prescription processing support | Intake, insurance claim submission, medication filling, packaging |
| Pharmacy Technician – Part-Time | Workflow support | POS transactions, prescription pickup, inventory support |
Technicians handle steps 1 through 3 and 6 of the prescription workflow, allowing the pharmacist to concentrate on clinical verification and patient counseling.
Staffing Growth Plan
Staffing expands only when prescription volume justifies additional labor costs.
- Mid–Year 2: An additional part-time technician is scheduled during peak hours to maintain prescription processing speed as daily volume approaches 100 prescriptions.
- Future Expansion: If daily volume consistently exceeds 120–140 prescriptions, the pharmacy may schedule a relief pharmacist through a local staffing agency to support verification workload and extended service hours.
This incremental staffing approach prevents over-hiring during the early months while ensuring patient wait times remain manageable as prescription volume grows.
Training and Compliance
All pharmacy staff receive training in:
- HIPAA privacy and patient data protection
- Controlled substance handling and DEA compliance
- Prescription processing procedures
- Pharmacy management software and POS systems
Continuing education for licensed staff follows Texas State Board of Pharmacy requirements to maintain licensure and stay current with clinical standards.
Operations Plan
Operating Hours
Monday–Friday: 9:00 AM–6:00 PM
Saturday: 9:00 AM–1:00 PM
Sunday: Closed
This schedule provides 49 hours/week and 305 operating days/year. The hours align with the work schedules of the target patient base: chronic-care patients and seniors who fill prescriptions during standard business hours. Saturday morning hours capture patients who can’t visit during the workweek. Sunday closure and early Saturday close keep payroll manageable for a 3-person clinical team.
Prescription Workflow
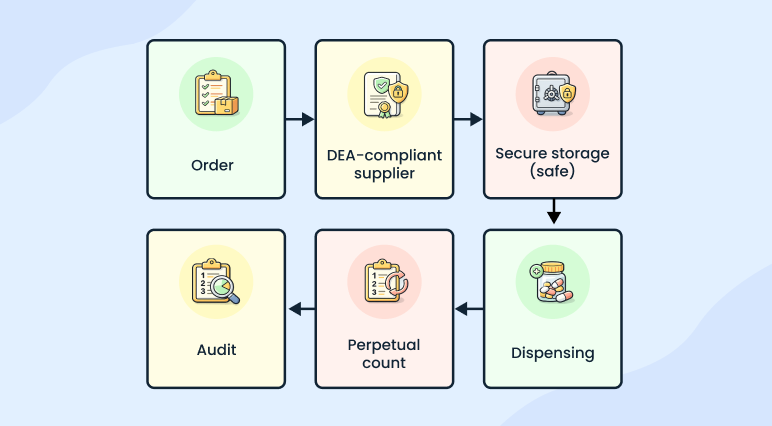
Every prescription follows a 6-step process from intake to patient pickup:
| Step | Activity | Performed By |
| 1. Intake | Receive prescription via e-prescribe, fax, phone, or walk-in | Pharmacy technician |
| 2. Insurance adjudication | Submit real-time claim to PBM; resolve rejections or prior authorizations | Pharmacy technician |
| 3. Filling | Pull medication, count, label, package | Pharmacy technician |
| 4. Pharmacist verification | Clinical review of drug interactions, dosage, and patient history | Dr. Patel (PIC) |
| 5. Patient counseling | Discuss medication use, side effects, adherence; documented in pharmacy management software for compliance tracking | Dr. Patel (PIC) |
| 6. Payment and pickup | Collect copay or cash payment at POS; release prescription | Pharmacy technician |
Step 4 is the bottleneck. Every prescription must be verified by a licensed pharmacist before it leaves the counter. Dr. Patel can verify approximately 120-150 prescriptions/day with technician support, handling steps 1 through 3 and step 6.
Once daily volumes consistently exceed 120, the pharmacy will evaluate relief pharmacist scheduling. If volumes exceed 140/day, a relief pharmacist at $50-$60/hour becomes necessary for sustained coverage. That threshold is a Year 3 or Year 4 decision based on actual dispensing data.
During seasonal peaks such as flu season, when immunization volume adds to the daily workload, the pharmacy will bring in the additional part-time technician (hired mid-Year 2). This is for extended shifts to keep prescription processing on schedule while Dr. Patel handles both verifications and immunization administrations.
Technology Systems
CommunityCare uses integrated pharmacy technology to support prescription accuracy, compliance, and daily workflow. With a small clinical team, these systems reduce manual work and help maintain service speed as prescription volume increases. The setup covers prescription intake, insurance processing, patient communication, and secure recordkeeping.
The pharmacy management software handles core functions such as prescription processing, PBM claim adjudication, patient profiles, drug interaction alerts, e-prescription intake, and counseling documentation. It connects directly with e-prescribing networks, allowing prescriptions to flow electronically from physician systems into the pharmacy. This reduces errors and speeds up intake.
Automated refill reminders notify patients by text or phone when medications are due, helping improve adherence and increasing refill volume. A point-of-sale system manages payments, OTC sales, and receipts, and is fully integrated with the pharmacy software so both prescriptions and retail items can be processed in a single checkout.
The pharmacy also uses a pharmaceutical-grade refrigerator for vaccines and temperature-sensitive drugs, with continuous monitoring and alerts. Security cameras and an alarm system support compliance requirements for controlled substances and provide after-hours protection.
If systems go down, staff switch to paper-based intake and manual payment processing until service is restored. Patient data is backed up daily to a secure off-site server in line with HIPAA requirements.
Inventory Management
The pharmacy sources from a primary pharmaceutical wholesaler with a daily ordering cycle. Orders are placed by end-of-the-day based on that day’s dispensing activity and delivered the following morning. This keeps the on-hand inventory lean and reduces the risk of expired stock. If the primary wholesaler experiences a supply disruption or backorder, the pharmacy maintains a secondary wholesaler account to source critical medications without interrupting patient care.
| Inventory Category | Steady-State Target |
| Prescription drugs | 3 weeks of Rx COGS |
| OTC products | 4 weeks of OTC COGS |
| Vaccines | 2 weeks of vaccine COGS |
As prescription volume grows, inventory buffers will be adjusted upward for high-velocity medications based on dispensing data. The purchasing pattern shifts from conservative launch-phase stocking to demand-driven replenishment once 6 months of dispensing history establishes reliable usage patterns.
Controlled substances (Schedules II through V) are ordered through DEA-compliant channels. The pharmacy maintains a DEA-compliant safe, conducts perpetual inventory counts, and complies with biennial DEA inventory audit requirements. Stocking levels are adjusted weekly based on dispensing velocity.
Slow-moving prescription inventory is returned to the wholesaler under return-goods policies where available. CommunityCare purchases prescription drugs through a primary pharmaceutical wholesaler contract negotiated via an independent pharmacy buying group. This structure allows the pharmacy to access member pricing tiers and periodic rebates tied to purchasing volume rather than negotiating directly as a single store. OTC purchasing decisions are reviewed monthly against point-of-sale data. Supplier promotions are not a basis for stocking decisions; actual patient demand is.
Licensing and Regulatory Compliance
| Requirement | Issuing Authority/Purpose |
| Pharmacy facility license | Texas State Board of Pharmacy |
| Pharmacist license (Dr. Patel) | Texas State Board of Pharmacy |
| Pharmacy technician registrations | Texas State Board of Pharmacy |
| DEA registration | U.S. Drug Enforcement Administration; controlled substances |
| NPI number | CMS; required for insurance billing |
| Medicare and Medicaid enrollment | CMS; government-program patients |
| PBM contracts (Caremark, Express Scripts, Optum, or equivalents) | Third-party insurance claim processing |
| HIPAA compliance program | Federal requirement: privacy policies, staff training, breach protocols |
| Professional liability insurance | Malpractice coverage for pharmacist clinical activities |
| General liability insurance | Premises liability, property damage |
Financial Plan
The pharmacy is a capital-intensive startup due primarily to medication inventory requirements, regulatory build-out standards, and technology systems. Our financial planning, therefore, emphasizes liquidity management, inventory control, and a predictable operating cost structure.
Capital Structure
| Source | Amount |
| Bank of America SBA Term Loan (7.95% fixed, 10 years) | $525,000 |
| Owner equity contribution | $175,000 |
| Total | $700,000 |
Loan Terms
- Loan Amount: $525,000
- Term: 10 years
- Interest Rate: 7.95% fixed
- Personal Guarantees: Provided by both owners
The debt structure spreads repayment over a 10-year amortization period, which reduces immediate cash pressure compared to shorter-term financing. The fixed interest rate provides predictability in long-term debt servicing.
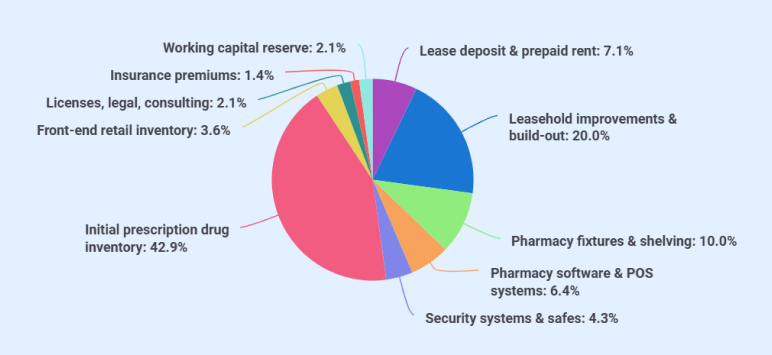
Startup costs
Total startup costs align precisely with total capital raised.
| Category | Amount |
| Lease deposit & prepaid rent | $50,000 |
| Leasehold improvements & build-out | $140,000 |
| Pharmacy fixtures & shelving | $70,000 |
| Pharmacy software & POS systems | $45,000 |
| Security systems & safes | $30,000 |
| Initial prescription drug inventory | $300,000 |
| Front-end retail inventory | $25,000 |
| Licenses, legal, consulting | $15,000 |
| Insurance premiums | $10,000 |
| Working capital reserve | $15,000 |
| Total Startup Costs | $700,000 |
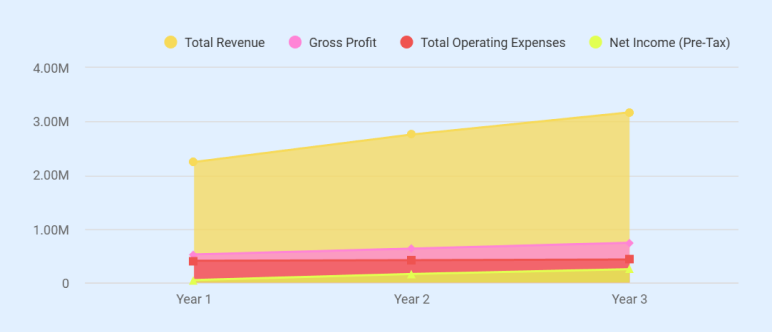
Profit & Loss Statement (3-Year Projection)
| Line Item | Year 1 | Year 2 | Year 3 |
| REVENUE | |||
| Prescription Revenue | $951,600 | $1,610,400 | $1,903,200 |
| OTC Revenue | $76,860 | $106,750 | $128,100 |
| Immunization/Clinical Services | $15,000 | $30,000 | $40,300 |
| Total Revenue | $1,043,460 | $1,747,150 | $2,071,600 |
| COST OF GOODS SOLD | |||
| Rx COGS (76%) | $723,216 | $1,223,904 | $1,446,432 |
| OTC COGS (60%) | $46,116 | $64,050 | $76,860 |
| Immunization COGS (35%) | $5,250 | $10,500 | $14,105 |
| Total COGS | $774,582 | $1,298,454 | $1,537,397 |
| GROSS PROFIT | $268,878 | $448,696 | $534,203 |
| Gross Margin % | 25.8% | 25.7% | 25.8% |
| OPERATING EXPENSES | |||
| Owner salary — Dr. Sarah Patel | $55,000 | $85,000 | $120,000 |
| Owner salary — Michael Patel | $30,000 | $42,000 | $55,000 |
| Pharmacy technician — full-time | $38,000 | $38,000 | $38,000 |
| Pharmacy technician — part-time | $20,000 | $20,000 | $20,000 |
| Additional part-time tech | $0 | $10,000 | $20,000 |
| Payroll taxes & benefits (18%) | $25,740 | $35,100 | $45,540 |
| Rent | $43,200 | $44,496 | $45,831 |
| Prepaid rent consumed (startup) | $40,000 | $0 | $0 |
| Insurance | $14,400 | $14,400 | $14,400 |
| Prepaid insurance consumed (startup) | $10,000 | $0 | $0 |
| Licenses/legal/consulting (startup) | $15,000 | $0 | $0 |
| Licenses & permits (annual renewals) | $3,000 | $3,000 | $3,000 |
| Marketing & advertising | $12,000 | $10,000 | $8,000 |
| Utilities | $9,600 | $9,888 | $10,185 |
| Pharmacy software subscriptions | $7,200 | $7,200 | $7,200 |
| Telephone & internet | $3,000 | $3,000 | $3,000 |
| Office supplies & packaging | $3,600 | $3,600 | $3,600 |
| Credit card processing (1.5%) | $15,652 | $26,207 | $31,074 |
| Continuing education & professional fees | $2,400 | $2,400 | $2,400 |
| Miscellaneous/contingency | $3,600 | $3,600 | $3,600 |
| Total Operating Expenses | $351,392 | $357,891 | $430,830 |
| EBITDA | ($82,514) | $90,805 | $103,373 |
| Depreciation | $37,286 | $37,286 | $37,286 |
| EBIT (Operating Income) | ($119,800) | $53,519 | $66,087 |
| Interest Expense | $40,787 | $37,819 | $34,607 |
| NET INCOME (Pre-Tax) | ($160,587) | $15,700 | $31,480 |
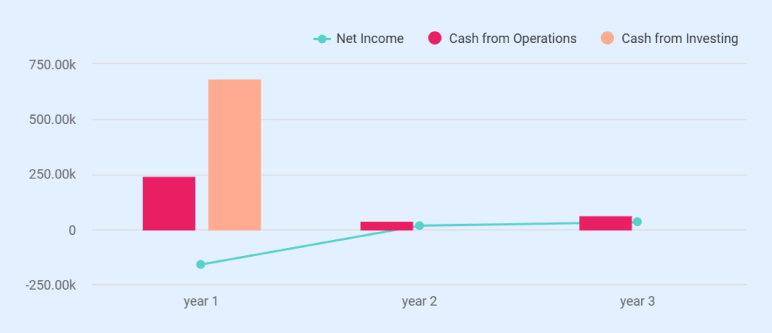
Cash Flow Statement
| Line Item | Year 1 | Year 2 | Year 3 |
| CASH FROM OPERATIONS | |||
| Net Income | ($160,587) | $15,700 | $31,480 |
| Add back: Depreciation | $37,286 | $37,286 | $37,286 |
| Working Capital Changes: | |||
| (Increase)/Decrease in Accounts Receivable | ($8,327) | ($5,764) | ($2,562) |
| (Increase)/Decrease in Inventory | $279,518 | ($30,473) | ($13,964) |
| (Increase)/Decrease in Prepaid Expenses | $65,000 | $0 | $0 |
| Increase/(Decrease) in Accounts Payable | $29,792 | $20,148 | $9,191 |
| Total Working Capital Changes | $365,983 | ($16,089) | ($7,335) |
| Cash from Operations | $242,682 | $36,897 | $61,431 |
| CASH FROM INVESTING | |||
| Capitalized assets (fixed assets) | ($285,000) | $0 | $0 |
| Lease deposit (refundable) | ($10,000) | $0 | $0 |
| Initial inventory purchase | ($325,000) | $0 | $0 |
| Initial prepaid expenses (rent + insurance + licenses) | ($65,000) | $0 | $0 |
| Cash from Investing | ($685,000) | $0 | $0 |
| CASH FROM FINANCING | |||
| Loan proceeds | $525,000 | $0 | $0 |
| Owner equity contributions | $175,000 | $0 | $0 |
| Loan principal repayments | ($35,821) | ($38,789) | ($42,001) |
| Cash from Financing | $664,179 | ($38,789) | ($42,001) |
| NET CHANGE IN CASH | $221,861 | ($1,892) | $19,430 |
| Beginning Cash | $0 | $221,861 | $219,969 |
| Ending Cash | $221,861 | $219,969 | $239,399 |
Spreadsheets are exhausting & time-consuming
Build accurate financial projections w/ AI-assisted features

Balance Sheet
| Line Item | Year 1 | Year 2 | Year 3 |
| ASSETS | |||
| Current Assets | |||
| Cash | $221,861 | $219,969 | $239,399 |
| Accounts Receivable | $8,327 | $14,091 | $16,653 |
| Inventory | $45,482 | $75,955 | $89,919 |
| Prepaid Expenses | $0 | $0 | $0 |
| Total Current Assets | $275,670 | $310,015 | $345,971 |
| Non-Current Assets | |||
| Lease Deposit (refundable) | $10,000 | $10,000 | $10,000 |
| Gross Fixed Assets | $285,000 | $285,000 | $285,000 |
| Less: Accumulated Depreciation | ($37,286) | ($74,572) | ($111,858) |
| Net Fixed Assets | $247,714 | $210,428 | $173,142 |
| Total Non-Current Assets | $257,714 | $220,428 | $183,142 |
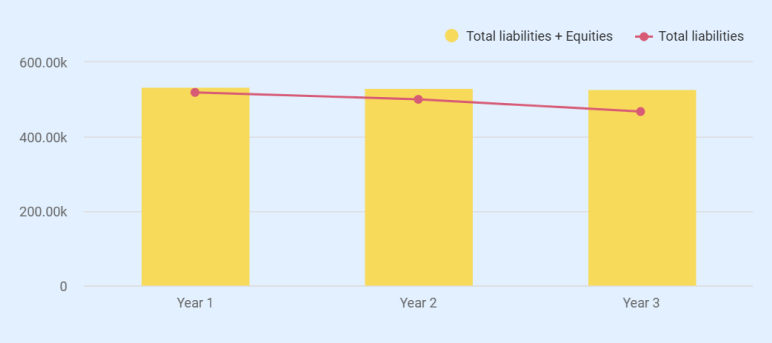
| TOTAL ASSETS | $533,384 | $530,443 | $529,113 |
| LIABILITIES | |||
| Current Liabilities | |||
| Accounts Payable | $29,792 | $49,940 | $59,131 |
| Current Portion of Loan | $38,789 | $42,001 | $45,481 |
| Total Current Liabilities | $68,581 | $91,941 | $104,612 |
| Long-Term Liabilities | |||
| Long-Term Loan | $450,390 | $408,389 | $362,908 |
| Total Long-Term Liabilities | $450,390 | $408,389 | $362,908 |
| TOTAL LIABILITIES | $518,971 | $500,330 | $467,520 |
| EQUITY | |||
| Contributed Capital | $175,000 | $175,000 | $175,000 |
| Retained Earnings | ($160,587) | ($144,887) | ($113,407) |
| Total Equity | $14,413 | $30,113 | $61,593 |
| TOTAL LIABILITIES + EQUITY | $533,384 | $530,443 | $529,113 |
Break-Even Analysis
| Metric | Value |
| Monthly fixed costs (Year 2 basis) | $33,899 |
| Blended variable cost ratio | 75.8% |
| Contribution margin % | 24.2% |
| Monthly break-even revenue | $140,079 |
| Annual break-even revenue | $1,680,948 |
| Break-even Rx/day (with OTC + immunization support) | ~105 Rx/day |
| Year 2 actual revenue | $1,747,150 |
| Year 2 surplus over break-even | $66,202 |
| Year 2 Net Income | $15,700 |
| Break-even achieved | Year 2 |
Loan Repayment Summary
| Year | Opening Balance | Interest Paid | Principal Paid | Total Payment | Closing Balance |
| Year 1 | $525,000 | $40,787 | $35,821 | $76,608 | $489,179 |
| Year 2 | $489,179 | $37,819 | $38,789 | $76,608 | $450,390 |
| Year 3 | $450,390 | $34,607 | $42,001 | $76,608 | $408,389 |
| Year 4 | $408,389 | $31,127 | $45,481 | $76,608 | $362,908 |
| Year 5 | $362,908 | $27,355 | $49,253 | $76,608 | $313,655 |
| Year 6 | $313,655 | $23,265 | $53,343 | $76,608 | $260,312 |
| Year 7 | $260,312 | $18,826 | $57,782 | $76,608 | $202,530 |
| Year 8 | $202,530 | $14,005 | $62,603 | $76,608 | $139,927 |
| Year 9 | $139,927 | $8,764 | $67,844 | $76,608 | $72,083 |
| Year 10 | $72,083 | $3,061 | $73,547 | $76,608 | $0 |
| Loan Detail | Value |
| Loan amount | $525,000 |
| Interest rate | 7.95% fixed |
| Term | 10 years (120 months) |
| Monthly payment | $6,384 |
| Annual payment | $76,608 |
| Total interest paid over life | $241,080 |
| Total paid over life | $766,080 |
The Quickest Way to turn a Business Idea into a Business Plan
Fill-in-the-blanks and automatic financials make it easy.
Upmetrics
Upmetrics is the #1 business planning software that helps entrepreneurs and business owners create investment-ready business plans using AI. We regularly share business planning insights on our blog. Check out the Upmetrics blog for such interesting reads. Read more