If you’re writing a business plan for an SBA loan, bank financing, investors, or even just to test whether your idea makes sense, the market analysis section is often where you get stuck.
You probably know there’s demand for your business. But proving it on paper is the harder part. That’s because you’re not sure what lenders actually expect to see, how detailed it should be, where to find reliable data, how to estimate market size, or how to research competitors without guessing.
That confusion leads to one of the biggest problems I’ve seen in business plans: vague market analysis sections. Unsupported numbers, generic customer descriptions, and surface-level competitor research. All of these make the entire plan less credible.
Let me help you fix that. In this guide, I’ll walk you through how to write a market analysis section that shows real data, clear customer insights, and realistic market assumptions. There’s also a practical example you can use as a reference.
What is a market analysis in a business plan? (& why it matters)
A market analysis is the key section of a business plan where you explain the market your business will operate in, and show that there’s enough demand for what you’re selling.
It brings together research about your target customers, market size, industry conditions, market trends, and competitors to make the case that your business idea is actually viable. Not just a good hunch.
In simple terms, this section answers questions like:
- Who will buy from this business?
- How big is the opportunity?
- Who else is already going after these customers?
- Why is there still room for this business?
This section matters because lenders, investors, and partners use it to judge whether your idea is backed by actual market demand or just assumptions.
Before they’ll trust your financial projections, they want proof that customers exist, the market is large (or focused) enough to support the business, and you understand the space you’re entering.
And competitors do not automatically weaken your plan. In many cases, they prove demand is already there. What matters is whether you can show where your business fits and why customers would choose you.
It’s also important for you. Writing it forces you to check if the opportunity is real and where the gaps are before you put money on the line.
What to include in your market analysis section?
I’ve noticed that almost all market analysis sections follow a similar structure across business plans. They explain who the business serves, how big the opportunity is, what’s driving the demand, and where the business fits against the competition.
To organize that information clearly, your section needs to cover these seven components:
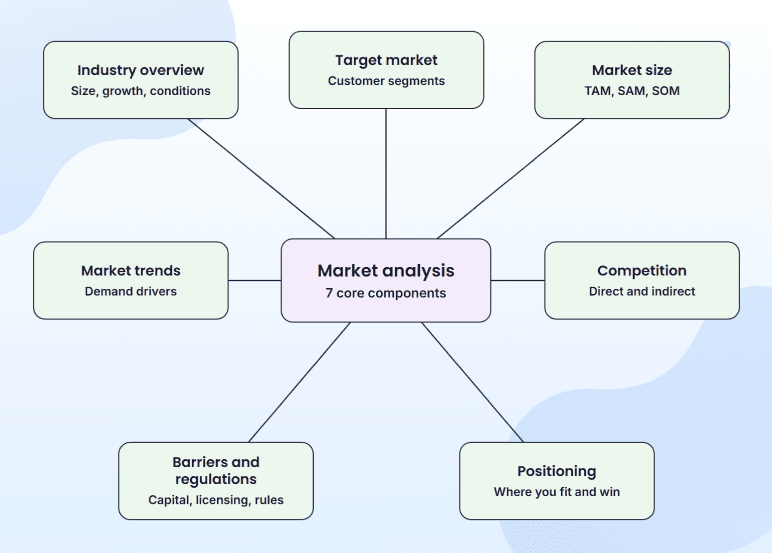
Here’s what each one is:
1. Industry overview
A quick look at the industry you’re entering, with its size, growth, and current conditions. This tells the reader whether the market itself is growing, stable, or in trouble.
2. Target market and customer segments
A clear description of the customers you plan to serve and which groups you’ll focus on first. This shows you have a specific buyer in mind, not “anyone who might want this.”
3. Market size and growth
An estimate of how big the demand is and how much of it you can realistically reach. This is where TAM, SAM, and SOM come in, and your SOM sets the limit on what you can earn in year 1.
4. Market trends and demand drivers
What’s actually driving demand right now: customer behavior, technology, pricing, or local conditions. This shows your business is built around how the market looks today, not how it looked a few years ago.
5. Competition (direct & indirect)
A look at who customers might choose instead of you, plus their pricing, weaknesses, and positioning. This is where you explain why customers will pick you over what’s already out there.
6. Barriers to entry and regulations
The licenses, permits, costs, and other challenges to getting started. This shows you’ve looked at what it really takes to run the business, not just the opportunity side.
7. Business positioning and opportunity
A short summary of where your business fits and what gap it’s filling. This is the answer to “why does this business have a real chance to work?”
That order matters. Anyone reviewing the plan typically reads the market broad to narrow: industry first, then your target customer, then the competition. Following that structure makes the section easier to follow and trust.
Now, let’s understand how to research and write each part.
How to write a market analysis? (Step-by-step guide)
It’s hard to write market analysis without spending two weeks on research or padding the section with numbers you can’t back up. The easiest way is to approach it step by step. Start broad, then narrow down.
Step 1 – Define and describe your industry
Start by clearly defining the industry your business operates in. This gives readers the context they need before evaluating your target market, competitors, or financial projections.
A common question I get here: “How specific should I get? Is ‘restaurants’ enough?”
Not really. “Restaurants” covers everything from a McDonald’s drive-through to a steakhouse, and you can’t pull useful data on a category that broad.
You need a sharper category: limited-service restaurants, specialty bakeries, or fast-casual Mexican restaurants. The narrower you go, the easier it gets to find credible market data, estimate market size, and identify the competitors.
The cleanest way to narrow it down is by finding your NAICS code. The Census Bureau’s NAICS classification tool lets you search by keyword and gives you the six-digit industry code that government databases, investors, and industry researchers all use.
Once you have the code, you can pull free industry data from a few places. Census Business Builder, Bureau of Labor Statistics Industries at a Glance, and Bureau of Economic Analysis industry-data tables.
Once you have those numbers, here are the three data points to focus on:
- How big the industry is (national revenue)
- How fast it’s growing (year over year, plus a 3-5 year projection if you can find one)
- What’s shifting right now (regulation changes, demand trends, supply chain, etc.)
Sources like the BLS and the BEA publish this kind of data for free. No IBISWorld or Statista subscription needed.
Once you have the industry data, write a short paragraph that explains your specific industry category, the current market condition, and one or two trends that directly affect your business. Avoid adding broad numbers unless you explain why they matter.
Step 2 – Identify and segment your target market
Define the customers your business is built to serve, then break that group into the specific segments you’ll target first.
Your target market is the full group that could realistically buy from you. Your customer segments are smaller groups within it that share similar traits, locations, or buying habits.
When founders sit down to define theirs, the first thing they might ask: How narrow is too narrow? Won’t the reader think I’m shrinking my market?
The opposite is usually true. A reviewer who reads “our target market is anyone who eats food” assumes you haven’t thought it through. A reviewer who reads “households earning $90K+ within 3 miles of our Arcadia location” sees a founder who knows who the business is trying to reach.
Then segment the target market across four dimensions:
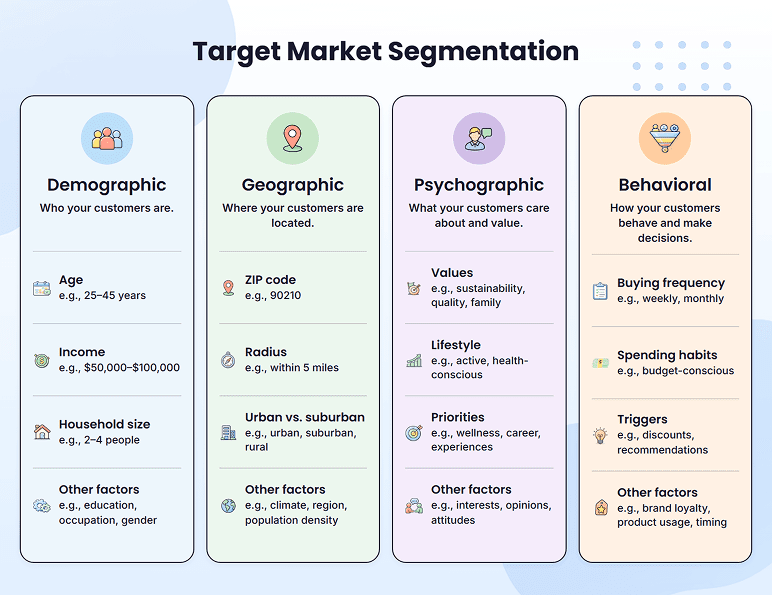
Here’s what I’d recommend: lead with one primary segment, then name one or two secondary segments you’ll target later. The plan reads stronger when you commit to one customer first. It makes the rest of the market analysis, pricing, and sales forecast easier to back up with real data.
Step 3 – Size your market (TAM, SAM, SOM)
This is usually the point where you need to estimate how big your market is.
I see founders often struggle here because they aren’t sure what readers expect. Some use huge national industry numbers that have nothing to do with their business. Others skip the section entirely because they don’t know how to calculate the estimates.
But you don’t need to predict the market perfectly. You need to show your numbers are realistic and supported by logic that anyone reviewing your plan can verify.
To do that, use these three market-size estimates:
- TAM (Total Addressable Market): This one is the total demand for your type of product or service.
- SAM (Serviceable Available Market): It’s the part of the market your business can realistically serve.
- SOM (Serviceable Obtainable Market): This is the share you expect to capture in the first few years.
For local businesses, SAM and SOM matter far more than the national TAM number. Lenders (& investors) already know the national figure. They want to see how you got from there to a number that actually applies to your business.
Here’s how it might look for a restaurant opening in Phoenix’s Arcadia neighborhood (ZIP 85018):
| Layer | Estimate | How it was estimated |
| TAM | ~$1.55 trillion | Total US restaurant and foodservice sales in 2026. National figure, useful as context but too broad to claim. |
| SAM | ~$69.4 million | 17,598 households in ZIP 85018 (Census Reporter) × $3,945 average annual household spend on food away from home (BLS Consumer Expenditure Survey 2024). |
| SOM | ~$1.4 million | 2% of SAM, a defensible year-1 capture rate for a single-location restaurant in a competitive trade area. |
Now turn those numbers into a short paragraph instead of adding the calculations only:
“The US restaurant and foodservice industry is projected to reach $1.55 trillion in 2026. Within ZIP 85018, the Arcadia/Biltmore corridor we’re targeting, roughly 17,598 households are spending an average of $3,945 per year on food away from home. So, about $69.4 million in addressable annual restaurant spending.
We expect to capture around 2% of that in year 1, or roughly $1.4 million in revenue, in line with comparable single-location restaurants in similar Phoenix trade areas.”
One thing to watch on SOM: if you’re projecting more than 5% of SAM in year 1 for a single-location business, expect pushback from reviewers. New businesses rarely capture more than a few percent of their addressable market that fast.
So your SOM should be based on realistic customer reach, spending patterns, and your business operating capacity.
Step 4 – Research market trends and demand drivers
After estimating market size, the next step is explaining what’s shaping demand in your market over the next 3-5 years.
A useful trend isn’t something “popular.” It’s a real change in how customers buy, what they spend money on, or where the market is heading. Look for trends in:
- Customer behavior
- Pricing and spending habits
- Technology
- Regulations
- Local economic and population changes
You don’t need complex reports for this. Pull data from Google Trends, BLS, BEA, Census data, or your industry’s trade publications.
For each trend, write one sentence that covers: what’s changing, the source where you saw it, and why it matters for your business.
“Coffee is popular” doesn’t count. A stronger version points to a specific shift and ties it to your business. For example: “Demand for quick morning coffee supports our focus on weekday commuters.” That shows what the trend is and why it matters.
Step 5 – Analyze your direct and indirect competitors
The next step is understanding who customers may choose instead of your business.
I know first-time founders often worry that too much competition makes the opportunity look weak. But that’s not true. Competition signals real demand, and what lenders actually want to see is how your business will compete within that market.
There are two types of competitors to research:
- Direct competitors: Businesses selling a similar product or service to the same customer.
- Indirect competitors: Businesses solving the same problem in a different way.
For a coffee shop, direct competitors are nearby cafés and chains. Indirect competitors might include convenience stores, bakery counters, fast-food breakfast options, or even office coffee machines.
Run a Google Maps search for your category within a 3-5 mile radius. Then check who’s ranking on Google for your category plus your city. Those two lists help you find almost every competitor worth mentioning.
From there, focus on 3-5 competitors that matter most, and include at least one indirect competitor. That’s what readers notice. Compare them in a simple matrix:
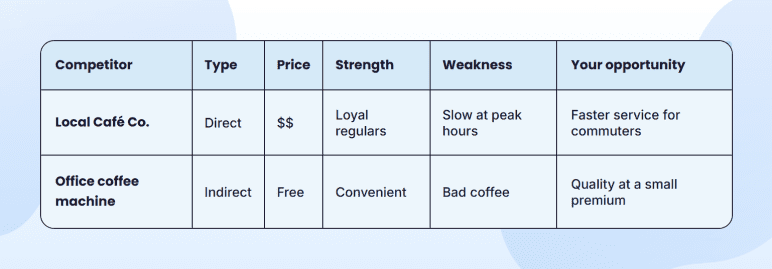
Don’t just compare prices. Read what customers complain about in reviews. Look for product gaps, service hours that don’t fit working schedules, weak online presence, or customer groups nobody’s serving well.
Free sources like Google Maps, Yelp, competitor websites, Reddit, and local directories help get more details.
The point isn’t to make competitors look bad. It’s to figure out what your customers already deal with and where you can offer something better.
Step 6 – Identify barriers to entry and regulations
This is where you show you’ve thought about the practical side of running the business. Not just the opportunity.
Founders often skip this step because they worry that barriers make the plan look risky. But it’s not true.
Anyone reading “we don’t expect any major obstacles” assumes you haven’t looked. Whereas anyone reading “kitchen buildout will cost $80K-150K, and our state’s food permit takes 4-6 weeks after inspection” assumes you have.
You don’t need to list every possible risk. Just cover the ones that genuinely apply to your business. Common barriers include:
- Startup costs
- Licensing requirements
- Supplier access
- Hiring challenges
- Equipment costs
- Customer trust
And most importantly, regulatory requirements vary a lot by industry. A restaurant needs food permits and health inspections. A trucking business needs DOT (Department of Transportation) compliance. A childcare center needs state licensing. So, find the two or three that apply to you, and write them down with the real details.
A simple rule: be specific about each barrier and regulation. Include the actual permit fee, the time it takes, and who issues it. So anyone could verify it in a quick search.
Step 7 – Connect your research to the rest of the business plan
Your market analysis isn’t a standalone section. It should back up everything else in your plan, especially your pricing, marketing, positioning, and sales forecast.
By now, your research should clearly answer who the business serves, why demand exists, how big the opportunity is, and where you position in the market. That matters because investors don’t read this section on its own. They use it to check whether the rest of the plan holds up.
So your target market should match the customers in your marketing plan. Your SOM should support your revenue projections. And your competitor research should explain why customers will pick you over what’s already out there.
Here’s the mistake I’ve caught founders making a hundred times: writing the market analysis and financials as two separate documents, then noticing too late that the numbers don’t match. The plans that get funded are the ones where everything tells the same story.
Before you finalize this section, ask yourself:
- Does the target market match my pricing?
- Do my revenue projections line up with SOM?
- Does the competitor research support my positioning?
- Do the market trends back up the opportunity?
If any of those don’t connect, fix the gap before you submit.

Market analysis example from a funded business plan
Here’s an example of a complete market analysis section for a neighborhood coffee shop in Phoenix’s Arcadia corridor. Use it as a starting point while drafting yours. Your numbers will be different, but the math should always follow the same logic.
Industry overview
Sunrise Coffee operates within the US restaurant and foodservice industry, projected at $1.55 trillion in 2026. The overall US coffee market is valued at approximately $24.98 billion. Specialty coffee continues to grow faster, driven by daily morning-use customers.
The category is highly fragmented, with no single chain controlling more than ~40% of the specialty coffee segment.
Target market
Sunrise Coffee serves two customer groups:
Primary segment
Weekday commuters and professionals aged 28-50 within 3 miles of our Arcadia location. They buy coffee 3-5 mornings a week, usually on the way to work.
Secondary segments
Weekend leisure visitors and remote workers use the shop as a daytime workspace.
Market size
| Layer | Estimate | How it was estimated |
|---|---|---|
| TAM | ~$1.55 trillion | Total US restaurant and foodservice sales, 2026 |
| SAM | ~$10.4 million | 17,598 households × ~$590 annual coffee-shop spend (~15% of the $3,945 BLS food-away-from-home, BLS) |
| SOM | ~$310,000 | 3% of SAM, year 1, based on comparable single-location specialty coffee shops |
- Specialty coffee spending grew 10%+ annually, supporting our focus on daily morning customers.
- Mobile order-ahead now drives 70%+ of specialty coffee transactions, which is why our launch plan includes a Square-based mobile ordering system.
Competitor analysis
| Competitor | Type | Strength | Weakness |
|---|---|---|---|
| Starbucks (0.4 mi) | Direct | Brand familiarity, mobile app | Slow during the 7-9 am rush |
| Dutch Bros (2.2 mi) | Direct | Drive-through speed | No in-store seating, generic menu |
| McDonald’s, 7-Eleven | Indirect | Lowest price | Not specialty-grade |
No competitor currently combines both speed and quality at our price point. That’s the gap we fill.
Positioning summary
Sunrise Coffee’s edge is speed without sacrificing quality. We serve specialty-grade coffee in under 3 minutes at an average drink price of $4.75. Based on the $310,000 SOM above, our financials project $275,000 in year-1 revenue, or about 89% of SOM. Year 2 grows to $340,000 as we add catering and a small grab-and-go food menu.
You’ve got the structure. Now here’s what to avoid as you write the market analysis section.
Common market analysis mistakes to avoid
These are the mistakes that show up more often in market analysis sections (the ones that get a plan sent back). Fix them in your draft before you submit.
Inflated TAM
Claiming “the US food industry is worth $1.5 trillion, so capturing 0.001% gives us millions” is a major red flag. Build your SOM bottom-up from a realistic customer reach instead.
Generic customer descriptions
“Anyone who likes good food” or “small businesses” isn’t a target market. Name the specific group, with geography, income range, or behavior. That’s what helps you make real pricing and marketing decisions.
Industry stats with no source
Every statistic in your section should trace to a named source like Census, BLS, or an industry report from IBISWorld or a trade association. If it can’t, readers assume it’s just a guess.
Skipping indirect competitors
Listing only your direct competitors and ignoring substitutes, DIY options, or alternative spending categories makes the section feel incomplete. Lenders, investors, and partners specifically look for where customers spend.
Disconnected financials
SOM in the market section says $1.4M, financials say $4M. If the two sections don’t align, readers lose trust in both sections.
Outdated data
Citing 2022 numbers in a 2026 plan signals an out-of-touch operator. Use the most recent reliable data available, and don’t cite old numbers when newer ones exist.
Conclusion
A strong market analysis doesn’t try to prove that every customer in the area will buy from you. It just shows you’ve thought about it:
- Who your customers are
- How large is the realistic opportunity
- What competitors already offer
- Why your business still has room in the market
And yes, the section should support the rest of your plan. Target market, pricing, positioning, and sales forecasts should all tell the same story. If they don’t, anyone reading your plan will notice the gaps before you do.
If you’d rather not figure this out on your own, Upmetrics can help. It guides you through every section of the plan, pulls real market data with an AI research assistant, and turns your numbers into investor-ready financials.
So you’re not starting from a blank page. You’re working from a structure that lenders and investors actually look for.
The Quickest Way to turn a Business Idea into a Business Plan
Fill-in-the-blanks and automatic financials make it easy.
Frequently Asked Questions
What's the difference between market analysis and market research?
What's the difference between industry analysis and market analysis?
How do I estimate market size for a local business?
How long should the market analysis section be in a business plan?
What free tools can I use for market analysis?
How often should I update my market analysis?
Can I use AI to do my market analysis?
Upmetrics
Upmetrics is the #1 business planning software that helps entrepreneurs and business owners create investment-ready business plans using AI. We regularly share business planning insights on our blog. Check out the Upmetrics blog for such interesting reads. Read more