Most forecasting advice is written for businesses that already have revenue, invoices, and profit-and-loss sheets.
But what if you’re just getting started? What if there’s no historical data to lean on?
You still need a financial forecast—especially if you want to avoid running out of cash, like 38% of newly launched businesses do in their first year.
In this post, we’ll show you how to build a financial forecast without historical data using a very practical and easy approach.
You don’t need historical data to forecast financials
Having a baseline of historical data indeed makes financial forecasting easier. It helps you project trends for sales, revenue, and cash flow without making you play darts in the dark.
But….
Should not having historical data stop you from building forecasts? (👀You know the answer already)
You see, it’s possible to build financial forecasts for your business plan without having an archive of data. And, much to your surprise, those forecasts won’t be baseless if you have answers to these core business fundamentals:
- Your business model: How exactly will you make money, i.e., by selling products, services, or subscriptions?
- Revenue streams: Will you have one income source or multiple ones, and which ones will generate the most money first?
- Startup cash requirements: How much money do you need before your first sale, i.e., equipment, inventory, and operating expenses?
- Your market position: Who are your customers, and how much will they pay?
- Cost structure: What are your fixed costs (rent, salaries) versus variable costs (materials, commissions)?
Financial spreadsheets are clunky and boring
Make accurate forecasts without spreadsheets or historical data

Before you start making financial forecasts, consider….
As you proceed to build projections, remember that you only have control over certain aspects of your financials (think, fixed costs) at this stage. Aspects like sales and their associated direct costs won’t be much within your direct control.
It’s alright. This process of building projections is supposed to be experimental and dynamic. So bear these considerations in mind as you proceed further:
- Build on realistic assumptions: Don’t tend to underestimate costs or overestimate sales/ revenue—always move with a buffer that allows room for unexpected chaos
- Document your assumptions: To avoid projection mistakes, keep a written record for every assumption you build, i.e., why the sales will increase by 40% in Q2 or why there will be a cash crunch in July
- Get feedback: Have someone (possibly an outsider or a finance person) review your numbers; they’ll spot blind spots you’ve missed and challenge unrealistic expectations
- Set a realistic planning horizon: Focus on projecting cash and revenue position for the next 12-18 months to keep your projections grounded in reality
- Focus on possibilities: Not everything will happen as planned(or go wrong)—the idea is to play with different progressive and aggressive scenarios, visualizing how your business will perform under different scenarios
- Focus on leading indicators: Track metrics that predict future performance, i.e., website traffic, lead generation, or customer inquiries, rather than obsessing over vanity metrics
Lastly, don’t obsess over perfection so much that you spend weeks building a workable projection.
A couple of hours should be sufficient to build the financial section of your startup business plan from scratch. Specifically so, if you are using Upmetrics’ financial forecasting to get a structured start. It builds forecasts in the backend while you make assumptions about revenue, sales, and expenses.
Making financial forecasts with no historical data (Practical steps)
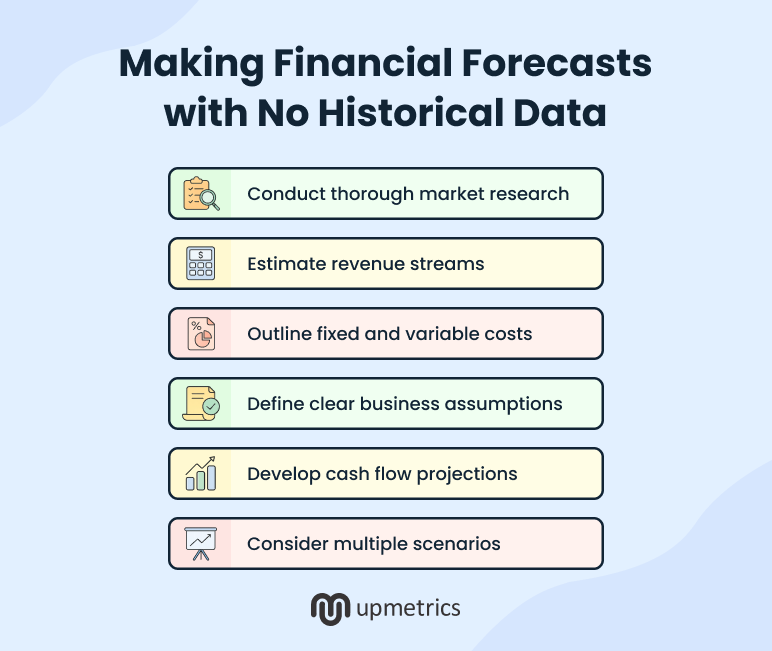
Now that you’re somewhat convinced to build forecasts for your (pre-launch or newly launched) startup, let’s walk you through a step-by-step guide that won’t be overwhelming or confusing.
1. Conduct thorough market research
An understanding of your market is non-negotiable. Especially so when you have no historical data to build your projections upon.
Now, there’s no right way to approach market research. However, taking a macro to micro niche overview will give you an innate understanding of how much sales you should be making, market dips, how consumer preferences are affecting demand, and what your competitors are up to.
Here’s what you should be doing:
| How should you approach it? | What kind of findings to extract? | |
|---|---|---|
| Industry research |
|
|
| Competitor research |
|
|
| Target audience research |
|
|
Document the key data points from your research—you’ll use them to build assumptions and justify the numbers you plug into your forecast.
2. Estimate revenue streams
Map out different ways your business would be generating money.
For instance, a newly emerging clothing brand could make money by selling garments (trousers, dresses, blouses) to young, fashionable females.
They may also sell accessories (scarves, belts, chunky neckpieces) as secondary products to earn revenue.
In both cases, instead of mentioning each product as a different revenue stream, you can group them into the broader categories (i.e., winter wear, summer wear, accessories) to make calculations easier.
Further, this brand may sell products through a website, application, a third-party shopping platform, and through their retail outlets, i.e., revenue channels.
It’s important to understand margins, traffic potential, and volume each revenue channel may carry. This way, you can group them or forecast their volume separately.
Ideally, based on your business, categorize your revenue streams into 3-5 core groups to simplify forecasting.
3. Outline fixed and variable costs
Your cost structure determines profitability at every revenue level. Instead of listing down every possible expense and making a micro assumption about it, categorize your expenses into core categories.
Fixed costs categories:
- Salaries: Founders and permanent staff
- Utilities: Electricity, water, insurance
- Rent & leases: Office, store, or warehouse spaces
- Software subscriptions: Tools like CRMs, email platforms, etc.
- Professional services: Accounting, legal retainers
Layer fixed costs on the basis of your milestones.
For instance, you may only hire after reaching 100 customers. Or you may upgrade tools after 6 months. Document these assumption triggers in your calculations for a more thorough projection.
Variable costs categories:
- Cost of goods sold (COGS): Raw materials, packaging, manufacturing
- Freight & shipping: Per-order delivery charges
- Commissions & transaction fees: Marketplace or card processing fees
- Ad spend (if performance-linked): PPC, influencer payouts, affiliate fees

Pro-tip
Build Accurate Financial Projections Faster Using Upmetrics
Upmetrics can make the projection process easy. It can help you create financial forecasts for your pre-revenue startup without any historical data.
Built for early-stage startups, Upmetrics offers end-to-end process automation with its AI-powered forecasting tool.
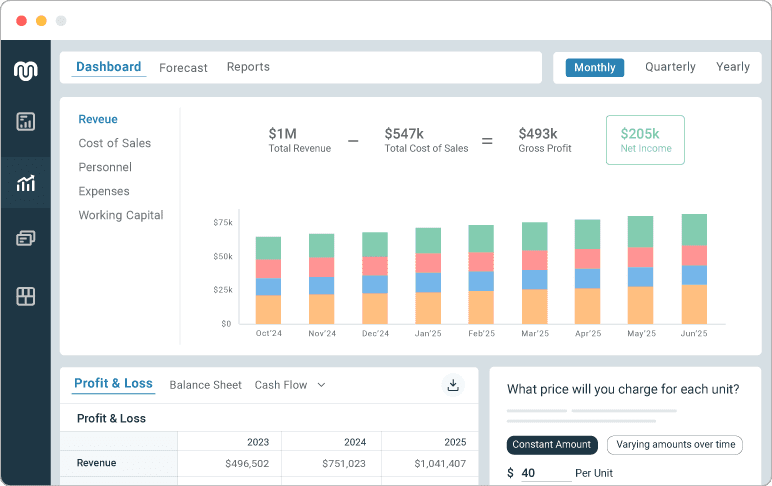
- AI-powered forecasting assistance: Simply enter your business idea and get AI suggestions for the cost of sales, expenses, revenue, and payroll relevant to your business.
- No-formula workflow: Enter your assumptions about costs, revenue, sales, and assets, and get fully detailed (and accurate) 3-way financial statements
- Automated Visual Dashboard: Get a complete visual overview of your financials with easy-to-read charts and reports
- What-if analysis: Model scenarios for various uncertainties while toggling effortlessly between various financial components
- Long-term projections: You can visualize up to 10 years in the future with this easy-to-use, intuitive tool
4. Define clear business assumptions
Financial forecasts are, after all, educated guesses you make about your future. And, since you have no prior data, you base your hypotheses on your research.
Here are the two core areas to define clearly:
Customer acquisition
How many customers will you realistically gain each month?
Don’t just pick a number. Base it on your marketing capacity, sales process, and market size.
For instance, if you can handle 10 sales calls per week and close 20% of them, you’re looking at 8-10 new customers monthly.
Pricing and revenue model
Once you’ve estimated how many customers you’ll get, map out what each customer is worth to the business.
Start with the basic questions such as:
- Are you selling one-time products, recurring subscriptions, or project-based services?
- What price will each customer pay?
- How often will they buy, i.e., monthly, quarterly, or irregularly?
Then get deeper to unlock patterns:
| Key metrics | Details | Example |
|---|---|---|
| Average order value | Based on your pricing and expected buying behavior. | If customers typically spend $40 per order, use that baseline |
| Customer retention | How long do you expect them to stick around? | If 10% of users cancel a subscription each month, your average customer lifespan is around 10 months |
| Churn rate | This is the percentage of customers who stop buying in a given period. | If you’re assuming a 5% monthly churn, only 95% of your customers will carry over to the next month. That affects monthly revenue flow and lifetime value |
| Lifetime value | Multiply the average revenue per customer by the number of months they stay. When churn increases, LTV drops |
If a customer pays $30/month and stays for 4 months, LTV = $120. If churn increases, LTV drops. |
5. Develop cash flow projections
You can be profitable on paper and still run out of money. That’s because cash flow isn’t the same as revenue.
Let me explain:
- Say you made $10,000 in sales, but only $6,000 actually hits your account this month due to 60-day payment terms. While your business may look profitable on P&L, you may not have enough cash to cover rent, salaries, and bills
- Or say you stock up on three months of inventory, paying upfront. While the costs would be distributed in your P&L across months, you may face cash crunches in that particular month due to big expenditures
To avoid these kinds of surprises where you don’t have cash to keep you afloat, you need a cash flow forecast that tracks the movement of cash in and out of your business each month.
The process is quite simple (or at least the formula):
- Opening cash balance: In case of a pre-launch startup, this is a personal investment or a loan amount you would invest in your business
- Cash inflows: Add expected cash inflows from sales for a given time (generally a week or month), but make sure to align it with your cash collection timeline
- Cash outflows: Subtract cash outflows for that period, i.e., rent, salaries, loan repayments, marketing spends, software tools, inventory, and any other expenses (again, considering the timeline for expenses)
And there you have your closing cash balance.
Opening cash + inflows – outflows = closing cash balance
While cash flow forecasting seems extremely simple here, you do need a tool that makes calculations across weeks and months easier.
With Upmetrics, simply enter your expenses and sales, set your receivable and payable timelines, and the cash flow forecast will build automatically, showing you the real cash position of your business (at any given time).
6. Consider multiple scenarios
As we said earlier, there’s no way things would fall exactly the way you have planned. Similarly, everything you plan can’t go wrong either.
Rather than sticking to a single forecast, consider preparing scenario-based forecasts that can help you leverage a lucrative opportunity or navigate difficult times without running out of cash.
But to model scenarios, you need to prepare a baseline projection. This is an ideal case projection where things aren’t too optimistic nor regressive.
From there, you can think of different worst-case scenarios. For instance,
- What if a key supplier delays your shipment?
- What if ad costs rise and customer acquisition slows down?
- What if your sales take twice as long to ramp up?
Don’t stop yet. Think of various best-case scenarios as well, i.e., what if your conversion rate improves or customer retention turns out better than expected? Would you have the capacity to meet demand? Or need more inventory and cash?
All these scenarios would affect your business finances drastically (in a good and bad manner). Having these scenarios (and their effect) mapped in your costs, sales, cash flow, and revenue makes decision-making easier.
And that’s all the theory of building a forecast from scratch without any data. Moving to practicals…
Find financial spreadsheets tedious and overwhelming?
Build 3-way financial forecasts using Upmetrics AI
Tools and resources for financial forecasting
You’ve got the framework for building projections from scratch. Let’s now discuss two prominent ways you could be building your forecasts without getting bogged down in complex formulas.
1. Financial forecasting software
These are dedicated forecasting tools with pre-built templates, visual dashboards, and built-in formulas supporting different forecasting methods. These tools automate calculations and build statements on their own, as you enter assumptions about your costs, sales, revenue, and payroll.
Many of these tools now even have an AI functionality that helps you build reasonable assumptions by understanding your business.
The process of building forecasts with such software is pretty simple:
- Import your existing data from accounting books and CRM (If you have the historical data.)
- Input assumptions about revenue, cost of sales, personnel, and other expenses
- Set the timeline for accounts receivable and payable, inventory, and tax
- Get a completely structured P&L, cash flow forecast, balance sheet, and even break-even (without entering a single formula).
- Now build different projections (scenario-wise) and visualize how it will impact different aspects of sales, cash flow, and break-even.
2. Spreadsheets and templates
The other way to build projections is using a good old spreadsheet. However, this includes a lot of staring at a blank screen since you have no idea or experience in how to get started.
You can download 3-way forecasting templates from the web. These templates include the core financial statements (P&L, cash flow, balance sheet) with input tabs for things like price, units sold, fixed costs, and growth rate.
However, this too comes with a set of limitations:
- Spreadsheets can’t sync data in real-time, meaning you won’t be getting a real-time view of your finances like the forecasting tool offers
- Calculations and formulas aren’t inbuilt. You will have to spend a lot of time building the fundamental blocks
- You don’t get a visual interactive dashboard like you get with a forecasting tool, meaning difficulty in visualizing the finances
- You spend more time getting the projections right rather than spending time strategizing and in decision making decisions
Of course, financial forecasting tools make more sense over Spreadsheets, especially so if you’re just starting out.
These tools take care of everything, i.e., calculations, structure, formulas—while you just need to figure out what assumptions make more sense for your business.
Spreadsheets are exhausting & time-consuming
Build accurate financial projections w/ AI-assisted features
You’re already ahead of the curve.
You’re forecasting without historical data means you aren’t in operations yet. But the fact that you’re planning your business means you’re already ahead of many. No one knows your business better than you do, so don’t worry……
Just follow the steps we shared to shape a forecast that reflects how your business could perform.
And if the process of getting started seems overwhelming, Upmetrics is here for you.
The tool automates the entire forecasting process with its intuitive interface, automated calculations, pre-built formulas, and interactive dashboards. You also get an AI assistant to help figure out your revenue, expenses, and payroll streams for your startup.
And just when you start accumulating real data, you can integrate your accounting software with Upmetrics to get a real-time view of your finances.
Ready to get started? Sign up now
Frequently Asked Questions
Can I forecast my finances even if I have zero customers or revenue right now?
How do investors evaluate financial forecasts for a startup with no track record?
When making forecasts, is it better to overestimate or underestimate figures (revenue, costs, etc.)?

Vinay Kevadia
Vinay Kevadiya is the founder and CEO of Upmetrics, the #1 business planning software. His ultimate goal with Upmetrics is to revolutionize how entrepreneurs create, manage, and execute their business plans. He enjoys sharing his insights on business planning and other relevant topics through his articles and blog posts. Read more