If you’re writing a bar business plan, you probably already know the sections you need to cover. The harder part is making the plan feel realistic: how many customers you need, what they’ll spend, how you’ll fill slower nights, what staffing will look like, and whether the numbers actually support the concept.
To make that easier, I’ve created a complete sample plan for The Corner Room, a hypothetical neighborhood bar in Denver. It shows how the menu, target market, marketing, operations, staffing, funding, and financials fit together.
Use this fictional example as a starting point and build your own bar business plan.
Executive Summary
The Corner Room, LLC is a new neighborhood bar in Denver’s Berkeley neighborhood, on Tennyson Street. It will serve draft beer, cocktails, wine, and simple food from a limited kitchen. The space is about 2,600 sq. ft. with roughly 70 seats, 14 bar stools, and a seasonal 20-seat patio. The bar plans to open in February 2027.
Most bars fill up on Friday and Saturday and sit quiet the rest of the week. But rent, payroll, and utilities run seven days a week. The Corner Room is built to earn steady business Sunday through Thursday, with a fixed program every night, a daily happy hour, and a loyalty program that turns neighbors into regulars. It competes through repeat visits, not novelty.
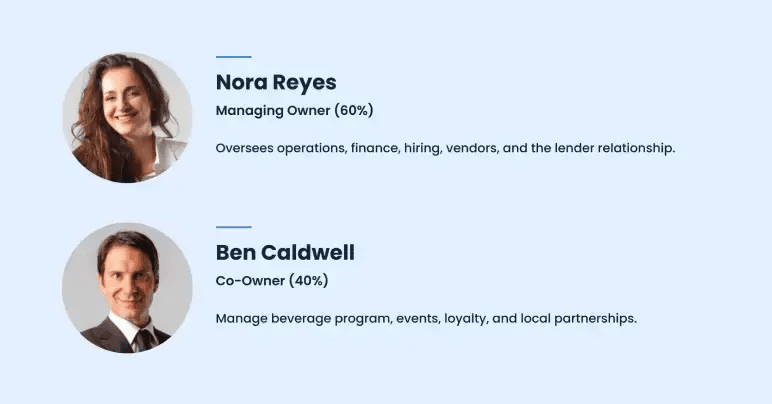
The bar is owned by Nora Reyes (60%) and Ben Caldwell (40%), who have 23 years of hospitality experience between them. Reyes runs operations, finance, hiring, and vendors. Caldwell runs the beverage program, events, loyalty, and local partnerships.
Market Opportunity
Fewer Americans are drinking. The US bar market is shrinking slightly, and only 54% of adults now drink, a record low.
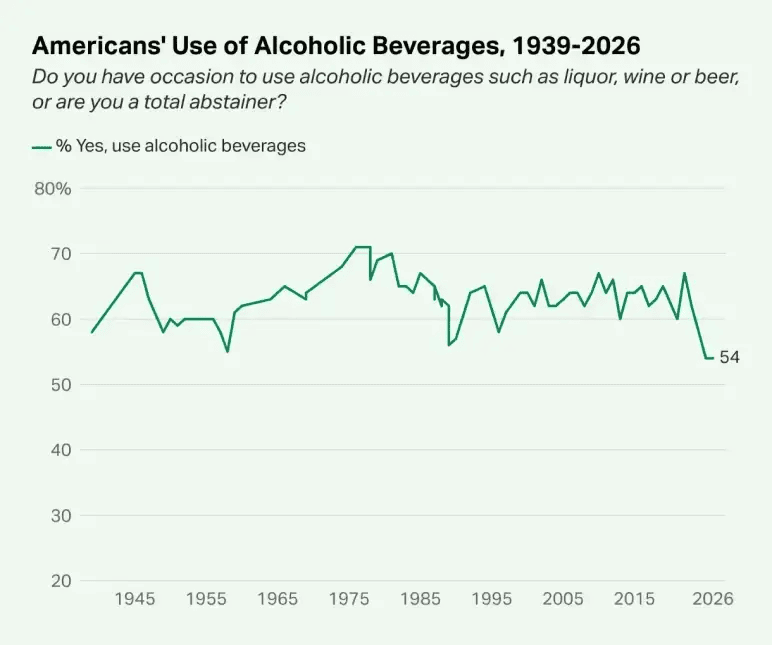
That means a new bar cannot rely on growing demand. So The Corner Room focuses on people who live nearby.
About 9,153 people live in Berkeley, with a median age in the high 30s. A one-mile walk from the site also reaches parts of neighboring areas such as West Highland, Sunnyside, and Regis.
We estimate this brings the total to about 25,000 residents. The plan is to turn 1,500 of them into regulars who join the loyalty program by the end of Year 2. Regulars are what keep the bar busy on weeknights.
Target Customers
The Corner Room mainly serves:
- Neighborhood regulars aged 30 to 55 who walk in on weeknights
- Young professionals aged 25 to 40 who come for happy hour and events
- Local industry and service workers who come late on weeknights
- Weekend social groups who spend more per visit
Neighborhood regulars and weekday customers will be strategically more important than occasional destination visitors because the business model depends on visit frequency.
Financial Outlook
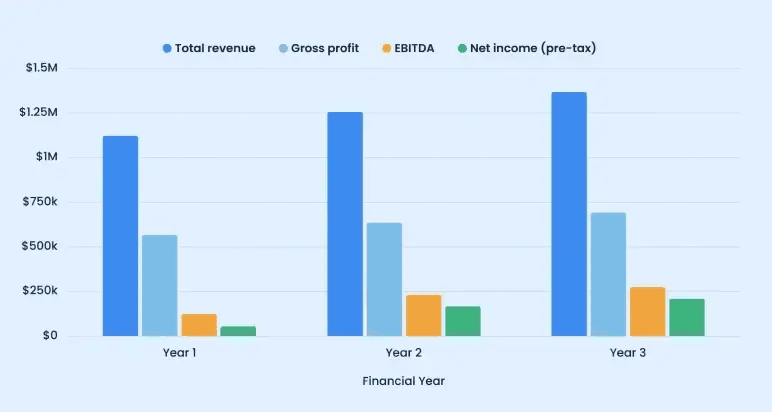
The Corner Room expects revenue to grow from $1.12 million in Year 1 to $1.37 million in Year 3, with the $28 average check held flat. Net income is lower in Year 1 because it absorbs $56,000 of one-time opening costs.
| Item | Year 1 | Year 2 | Year 3 |
| Annual customers (covers) | 40,000 | 44,800 | 48,832 |
| Total revenue | $1,120,000 | $1,254,400 | $1,367,296 |
| Gross profit | $567,728 | $635,855 | $693,082 |
| Net income (pre-tax) | $54,525 | $164,857 | $209,901 |
| Ending cash | $190,208 | $368,598 | $589,917 |
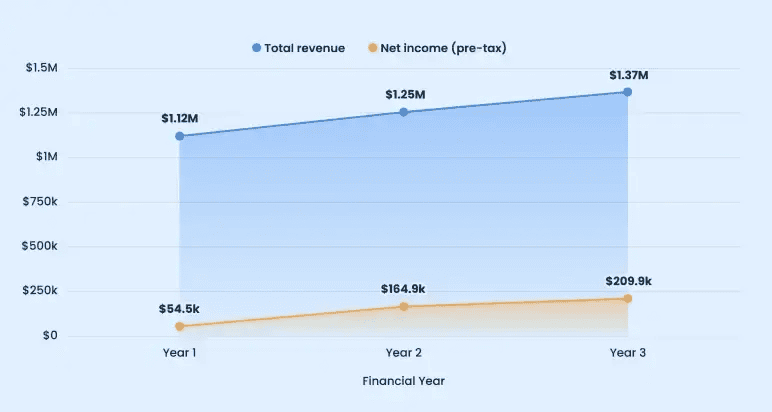
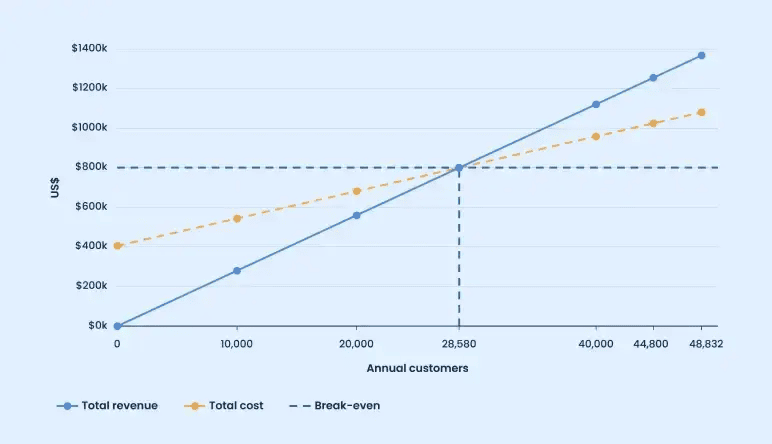
The bar breaks even at about $800,000 in sales, or about 78 customers a day. Friday and Saturday together bring in about $504,000 a year, so the weekday program is what carries the bar past break-even.
Funding Requirement
The Corner Room is asking for a $300,000 SBA 7(a) loan from First Summit Community Bank. The owners will add $110,000 of their own money, which is 27% of the $410,000 total. Operating profit before depreciation (EBITDA) covers the yearly loan payment 2.4 times in Year 1.
Business Overview
The Corner Room is a neighborhood-first bar, not a large entertainment venue or a full-service restaurant. Its purpose is simple: give Berkeley residents a comfortable place to return to for drinks, casual food, and familiar weekly events. That choice shapes everything else.
The kitchen is compact, prices stay low enough for repeat visits, events run on a fixed schedule, and marketing targets nearby customers, not all of Denver.
Legal Structure and Location
The Corner Room, LLC is a Colorado multi-member limited liability company. This structure protects the owners’ personal assets.
The bar will lease about 2,600 sq. ft. on Tennyson Street, between W 41st and W 44th Avenues, in northwest Denver. The final address will be set when the lease is signed. The proposed layout includes about 70 dining and lounge seats, 14 bar stools, and a seasonal patio with about 20 seats.
The location fits the concept. Tennyson is a walkable street of restaurants and shops with homes behind it, so the bar has neighbors who can walk over on a Tuesday.
Ownership
The two owners split the work by strength. Reyes handles the numbers and the operation. Caldwell handles what customers see and taste.
Mission Statement
To provide Berkeley residents with a dependable neighborhood gathering place for approachable drinks, with fair prices, casual food, and familiar weekly experiences.
Vision Statement
To establish The Corner Room as a well-known neighborhood bar with a loyal base of customers who visit regularly throughout the week.
Business Model
The Corner Room will generate revenue primarily from on-premise beverage and food sales.
Approximately 70% of sales are expected to come from alcoholic and non-alcoholic beverages, with food contributing the remaining 30%. The menu, pricing, staffing, and kitchen setup will remain relatively simple so the business can concentrate on its core bar operation without taking on the cost structure of a full-service restaurant.
The projected average customer check is approximately $28, made up of about $19.60 of drinks and $8.40 of food. Two drinks, or a drink and a shareable, reach that check.
Business Goals
Year 1:
- Serve 40,000 customers, about 110 a day.
- Earn at least 55% of weekly revenue from Sunday to Thursday.
- Sign up loyalty members at the point of sale from opening week.
- Stay profitable from Year 1 and keep the loan on schedule.
Years 2 to 3:
- Reach 1,500 loyalty members by the end of Year 2.
- Grow to 44,800 customers in Year 2 and 48,832 in Year 3.
- Hold the 70/30 beverage-to-food mix and reach about $1.37 million in revenue by Year 3.
- Lift pre-tax margin from 4.9% in Year 1 to 15.4% in Year 3.
Keys to Success
- Build regulars, not just traffic. The bar does not need every Denver resident. It needs a smaller group of neighbors to return often. A guest who spends $28 twice a month is worth about $672 a year.
- Keep labor matched to demand. A 65-customer Monday cannot carry the same crew as a 175-customer Saturday.
- Protect beverage and food margins. Overpouring, comps, spoilage, and loose purchasing can erase the margin a bar earns on drinks.
- Give slow nights a purpose. Each programmed weeknight has a clear reason to visit, not just a discount.
Menu and Beverage Offering
The menu is built to be ordered twice a week, not once a quarter. It is small, priced for regulars, and simple to run. Drinks generate about 70% of revenue and food about 30%.
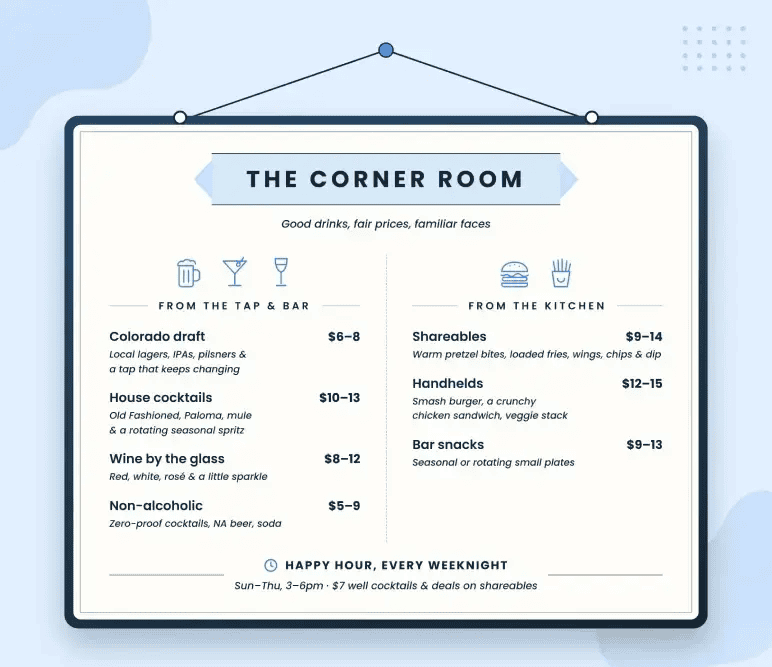
Draft beer is the frequent, repeat-friendly purchase and anchors event nights. Cocktails are the higher-value sale, kept below premium cocktail-bar prices.
The kitchen stays intentionally limited, which means fewer ingredients to buy, less spoilage, simpler prep, easier training, and faster service. Ingredients are cross-used across dishes so no item needs its own low-volume supplier.
Direct materials are budgeted at 26% of revenue across all categories. That is above what the draft and food targets alone imply, and it leaves room for happy hour discounts, comps, and spillage.
Pricing Strategy
The Corner Room prices for visit frequency, not maximum spend per visit. A $28 check can be reached with two drinks, or one drink and a food item, so guests do not need a special occasion to come in.
Happy hour uses a short list of drink and food offers that still protect the contribution margin, instead of discounting the whole menu. Read more on pricing strategy for a business plan.
The Weekly Experience
A neighborhood bar has to give people a reason to come in on an ordinary Tuesday, not just a Friday. So beyond drinks and food, The Corner Room offers a fixed weekly lineup: one program every night, on the same schedule each week, so regulars can build a habit around it.
The schedule keeps Sunday through Thursday busy, which is where most bars go quiet. The aim is for those five nights to bring in at least 55% of weekly revenue.
| Night | Program | How it works | Target customers |
| Sunday | Industry night | 15% off with a work ID, and the kitchen stays open late. | 70 |
| Monday | Loyalty night | Member-only pricing on a rotating draft, plus new-member sign-ups. | 65 |
| Tuesday | Team trivia | Weekly host starts at 7:30 p.m., prizes are bar tabs. | 95 |
| Wednesday | Live acoustic | A local artist at 8 p.m., no cover, about $125 per artist. | 95 |
| Thursday | Partnership night | A local business, league, office, or brewery hosts. | 100 |
| Friday | Group night | Group reservations for six or more. | 170 |
| Saturday | Group night | Group reservations for six or more. | 175 |
That adds up to about 770 customers a week, with 55% of them coming Sunday through Thursday. A fixed program beats a rotating one: guests learn that Tuesday means trivia, instead of the bar having to sell a new idea every week.
The owners review attendance by night each week and rework any program that runs well under target, so every night keeps earning its place.
Market Analysis
A neighborhood bar wins or loses on local behavior: who lives nearby, how often they go out, and what they pay. National and state figures set the scene, but the sizing below is built from Berkeley up.
US Bar Market
The US bar market is large but flat. IBISWorld values US bars and nightclubs at about $38.6 billion in 2026. The industry is highly fragmented, with no company holding more than a 5% share. One analysis counts nearly 70,000 bars nationwide.
A new bar competes with other local bars, not a national brand. Typical profit is around 5 to 6% of revenue, so margin comes from controlling fixed costs and keeping slow nights busy.
People are also drinking less often. In Gallup’s 2025 survey, 54% of US adults said they drink, down from 62% in 2023. Two details matter here:
(1) Age
50% of adults 18 to 34 drink, against 56% of those 35 and older. The bar’s regulars, aged 30 to 55, are in the group that drinks more often.
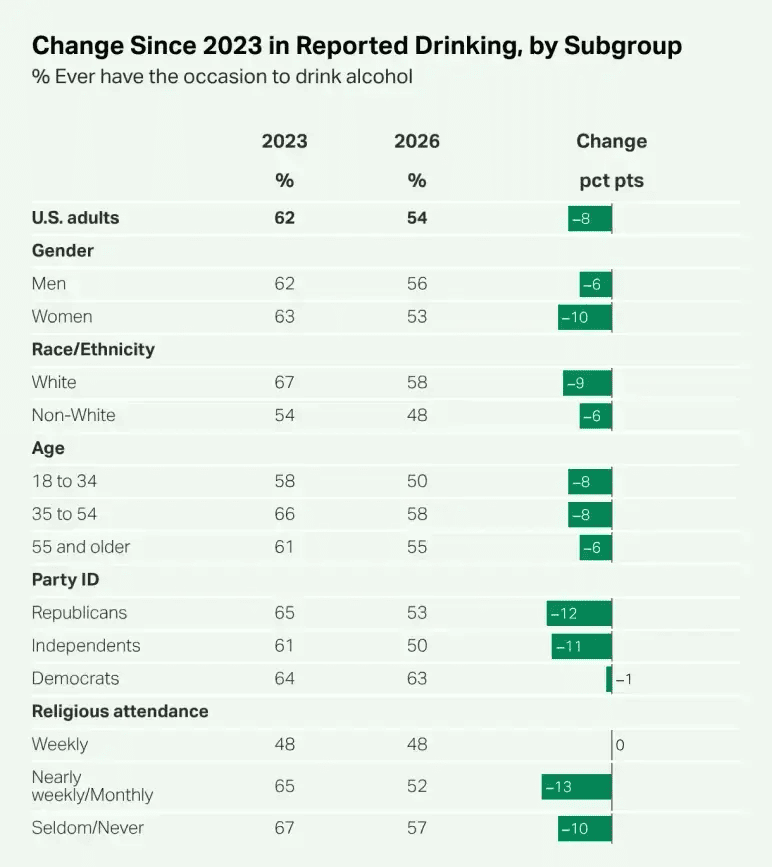
(2) Income
68% of upper-income adults drink, against 43% of lower-income adults. Berkeley’s incomes are on the right side of that gap.
Because fewer people go out casually, a fixed reason to visit works better than a general invitation; the bar also carries zero-proof drinks for guests who drink less.
Denver Market
Denver is an expensive place to run a bar, and diners are price-aware.
- Spending: Denver-area households spent an average of $4,903 on food away from home in 2023-24, and put 6.8% of spending toward entertainment against 4.6% nationally. Guests here go out, but they watch prices.
- Demand: A 2026 report on Denver restaurants, as reported by the Denver Gazette, found menu prices up 28% while earnings fell 20%.
- Labor: Denver’s minimum wage is $19.29 an hour in 2026, with a $16.27 cash wage for tipped workers. Both adjust every January.
- Rent: Denver retail space averaged about $20.63 per sq. ft. in mid-2026, with prime corridors like Tennyson Street commanding more. The bar budgets about $32 per sq. ft. ($84,000 a year on 2,600 sq. ft.)
- Local supply: Colorado craft brewers made nearly 10% more beer in 2025, even though the state lost a net 33 breweries. That gives the bar a deep draft supply and breweries that want partners.
So The Corner Room keeps its menu small, its prices approachable, and its staffing tied to each night’s demand.
Berkeley and Tennyson Street
City documents describe Tennyson Street as a long-standing commercial, civic, and residential street and Berkeley’s neighborhood “main street.” That suits a repeat-visit bar better than a destination nightlife district. Guests can stop in after work, meet friends, or come for weeknight trivia without planning a whole evening around it.
Berkeley has about 9,153 residents with a median age in the high 30s. A one-mile walk from the site reaches into West Highland, Sunnyside, and Regis, bringing the total to an estimated 25,000 residents.
| Measure | Estimate |
| Residents within one mile | About 25,000 |
| Adults 21 and older | About 21,000 |
| Adult drinkers (about 57% of adults 21+, up to 68% at upper incomes) | About 12,000 to 14,300 |
| Visits per drinker per year at plan (40,000 customers) | About 2.8 to 3.3 |
| Visits per drinker per year at break-even (28,580 customers) | About 2.0 to 2.4 |
This counts residents only, so daytime workers and visitors add to it. The plan needs roughly one in eight to one in ten nearby adult drinkers to become a regular, which matches its 1,500-member loyalty goal.
Market Trends
- Loyalty drives return visits. Toast reports that guests in a loyalty program return at higher rates than other guests, which supports building the member list from day one.
- Guests visit less often but more deliberately. Each weeknight has a fixed program so a visit is easy to plan.
- Local products win. The draft list is built around Colorado breweries.
- Low- and no-alcohol demand is growing. Zero-proof beer and cocktails widen the bar’s appeal to groups with mixed preferences.
Target Customers
The Corner Room serves four groups. The first two carry the weeknights, which is where the plan is won or lost.
| Segment | Age | When they visit | What they want | Share of customers | Typical spend |
| Neighborhood regulars | 30 to 55 | Weeknights, walk-in | Consistency and fair prices | 40% | $25 |
| Young professionals | 25 to 40 | Happy hour and events | Good drinks and a reason to meet | 25% | $30 |
| Industry and service workers | 21 to 45 | Late weeknights and Sunday | Value and a late kitchen | 10% | $20 |
| Weekend groups | 25 to 50 | Friday and Saturday | Space for the group | 25% | $34 |
This mix produces the $28 average check. Regulars are the base of the business, and young professionals get a $7 well cocktail before 6 p.m.
Competitive Analysis
Berkeley and the nearby streets already have bars, breweries, and restaurants. Most of them compete for the same two nights. The Corner Room competes for the other five. The competitors below are composites of nearby venue types, not specific businesses.
- Craft cocktail bars on Tennyson pour excellent drinks and draw a date-night crowd, but their prices suit special occasions, not a regular Tuesday, and they run few weeknight events.
- Sports taprooms pack in game-day crowds around wings and burgers, then empty out between games and hold little appeal for anyone who isn’t there for the game.
- Restaurant bars have the stronger kitchens, but the bar is secondary to the dining room, so it isn’t built for someone who just wants a drink and a familiar room.
- Late-night clubs own the weekend with DJs and a dance floor, yet most open only Thursday to Saturday, so they do nothing for a quiet weeknight.
Put these side by side and a pattern appears: they cluster in two corners, either premium and weekend-leaning, or everyday but event-dependent.
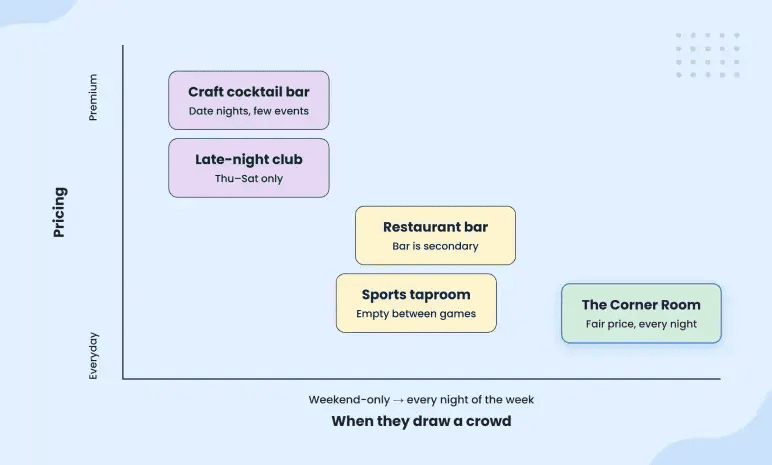
One corner sits empty. The Corner Room takes that open position: fair prices, a bar-first room, and a reason to come in Sunday through Thursday.
Competitive Advantages
The Corner Room competes on a handful of clear strengths, most of them built around the weeknight gap the other venues leave open.
(1) Weeknight programming
Guests always have a reason to visit, not just on weekends. Each weeknight gets one demand driver instead of being treated as an interchangeable slow night.
(2) Fair prices
The $28 average check keeps return visits realistic, instead of turning every outing into a $60 to $80 night.
(3) A loyalty program from day one
Regulars get member-only offers and rewards, and the member list is built from opening week.
(4) Local partnerships
Nearby offices, leagues, and breweries bring in groups on the nights that need them most.
(5) Owner-operated
Both owners work the floor through startup, so decisions are fast, and quality is watched directly, with no absentee-management gap.
Marketing and Sales Strategy
The Corner Room measures marketing by how often people come back, not by how many walk in once. The goal is a repeatable cycle: local discovery, first visit, customer capture, second visit, regular. Programming gives people a reason to return, and marketing tells them it exists.
Sales Strategy
Most revenue comes from on-premise drink and food sales, generated through five occasions:
- Walk-in sales: The main channel, fed by visibility, Google search, word of mouth, foot traffic, and recurring events.
- Happy hour: A short list of drink and food offers from 3 to 6 p.m. pulls customers in during the weakest daypart, without discounting the whole menu.
- Weekly events: Trivia, acoustic night, industry night, and partner night create recurring weekday occasions.
- Group reservations: Small groups, birthdays, team outings, and community events can be booked online or by phone, which fills quiet periods and brings several checks at once.
- Loyalty offers: Members get targeted reasons to come back on specific nights, not blanket discounts.
Launch and Customer Acquisition
The launch budget is $16,000 for branding, signage, a neighborhood soft opening, and local press. Before the public opening, the bar hosts a soft opening for neighbors, nearby business owners, and local hospitality contacts. It tests the operation at lower volume and starts the first customer list.
Grand opening week then uses local press, social content, and neighborhood partnerships. New Regulars members get a free item on their next visit, and each Thursday partner gets a night of its own.
After the first few months, acquisition should lean less on opening promotions and more on search visibility, referrals, events, and repeat visits.
Marketing Channels
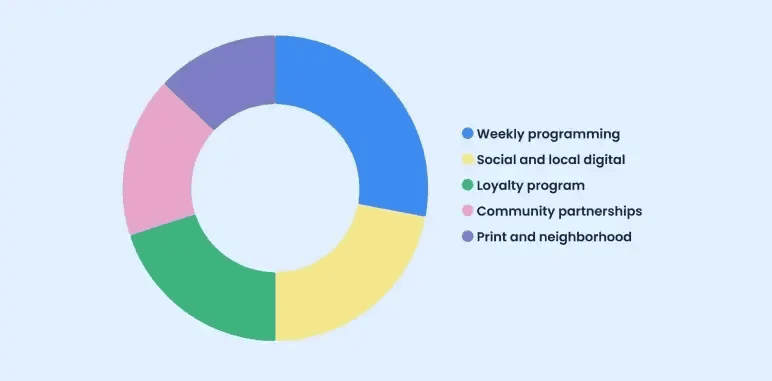
Ongoing marketing is budgeted at 3.2% of revenue, or $35,840 in Year 1, and stays local.
| Channel | Budget | Annual cost | Description |
| Weekly programming | 28% | $10,000 | Artist fees and prizes that give each night a reason to visit. |
| Social and local digital | 22% | $8,000 | Instagram events calendar, Google Business Profile, and local listings. |
| Loyalty program | 20% | $7,000 | Rewards and point-of-sale tools for The Corner Room Regulars. |
| Community partnerships | 17% | $6,000 | Nearby offices, sports leagues, and neighborhood businesses. |
| Print and neighborhood | 13% | $4,840 | A-frame sign, flyers, and neighborhood groups. |
The Regulars Program
The Corner Room Regulars is a points-based loyalty program tied to the point-of-sale system. Guests earn points on every visit, get a free item at a set threshold, and receive a birthday perk, early notice of events, and member-only weeknight offers.
The bar collects sign-ups at checkout from day one, because a member list is the cheapest way to fill a slow Monday. It lets the bar promote a new Tuesday event without paying to reach the same customers through ads again and again. The target is 1,500 members by the end of Year 2.
Sales and Marketing KPIs
Every month the owners track:
- Total customers and customers by night (weekday target: 425 a week)
- Sunday to Thursday share of revenue (55% or more)
- Average check
- First-time versus repeat customers, and repeat-visit rate
- Loyalty enrollment and loyalty-member share of sales (1,500 members by the end of Year 2)
- Event attendance and event-to-repeat conversion
Follower counts and impressions are secondary. What matters is whether a first-time guest comes back.
Operations Plan
The Corner Room’s operating week is built backward from its slowest night. The bar cannot staff every night like a Saturday, but lean weeknight staffing cannot slow service and cost it repeat visits.
Hours of Operation
| Day | Hours |
| Monday to Thursday | 3 p.m. to 12 a.m. |
| Friday | 3 p.m. to 2 a.m. |
| Saturday | 11 a.m. to 2 a.m. |
| Sunday | 11 a.m. to 11 p.m. |
| Happy hour | Sunday to Thursday, 3 to 6 p.m. |
Groups of six or more can reserve areas online or by phone. Weeknights are walk-ins first.
Daily Workflow
A typical Tuesday starts at 2 p.m. with deliveries, inventory checks, bar setup, kitchen prep, and a test of the POS and payment systems. The team reviews the schedule and expected customers.
Doors and happy hour open at 3 p.m. with fast drink service and a few food items. The evening menu starts at 6 p.m., and trivia begins at 7:30 p.m. with a second bartender on the bar.
The bar closes at 12 a.m. with last call, cash-out and POS reconciliation, secured alcohol storage, cleaning, food storage, waste recording, and prep notes for the next day.
Facility and Equipment
The 2,600 sq. ft. space holds the main bar, customer seating, a limited kitchen, beverage and food storage, service areas, restrooms, and a seasonal patio. The layout lets the bar run efficiently on a slow night without opening unused sections.
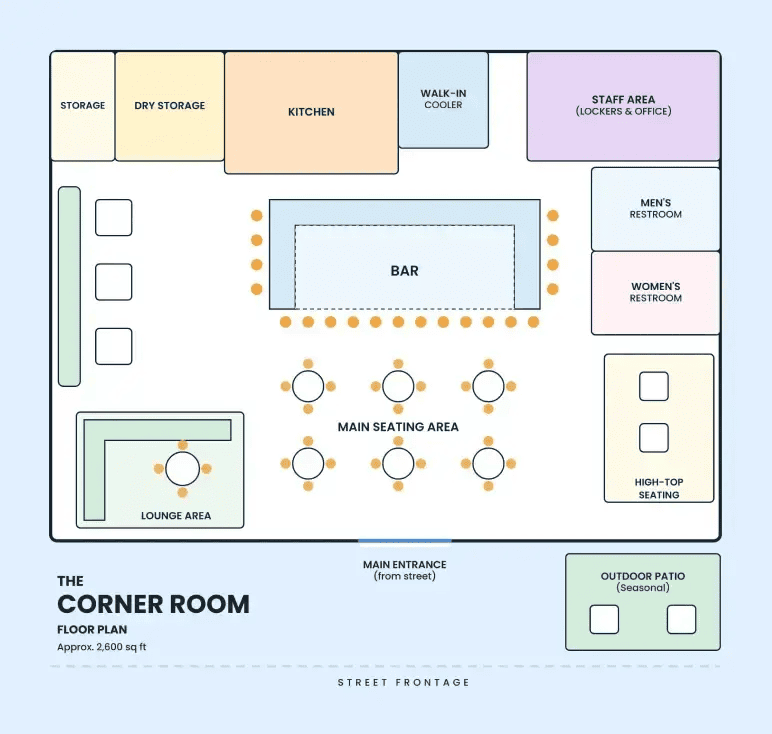
The startup budget covers build-out, bar equipment (draft system, coolers, glass washer, and POS), kitchen equipment, seating, and sound. Rent is $84,000 in Year 1, or about $32 per sq. ft., on a modified gross lease.
Inventory and Purchasing
Beverage margin can disappear through overpouring, breakage, comps, theft, or loose purchasing. The Corner Room sets par levels for each major beverage category and counts key inventory every week. Management reconciles POS sales against expected product use to spot unexplained variance, and the kitchen follows the same approach.
Food purchasing will follow the same basic principle: keep the menu compact and avoid holding unnecessary inventory. Ingredients will be cross-utilized across several dishes where possible, and purchasing frequency will be adjusted according to actual sales so the kitchen can limit spoilage.
The 26% direct materials figure in the financial plan is an operating target reviewed weekly, not just a number checked at year-end.
Vendors and Partners
The bar builds its supply around local relationships:
- Draft beer, wine, and spirits come from Colorado breweries and regional distributors, which keeps the tap list local and gives the bar brewery partners for Thursday events.
- Food comes from a broadline supplier for staples plus local vendors for fresh items, keeping the limited menu simple to reorder.
Ongoing service costs such as insurance, POS and software, and accounting and legal are carried in the Financial Plan.
Compliance and Licensing
Licensing is part of the opening schedule, not a final chore. The Corner Room will hold or apply for:
- Colorado Tavern liquor license
The bar plans to apply for a Tavern license, which allows a bar-first operation with no minimum food requirement. (A Hotel and Restaurant license would require food to be at least 25% of sales.) The final class will be confirmed against the approved food-and-alcohol model.
- Denver approval and public hearing
Denver’s Excise and Licenses department reviews the application and holds a public hearing where registered neighborhood organizations can speak.
- State approval
The Liquor Enforcement Division gives final approval. See the Colorado Liquor Enforcement Division.
In addition, the bar applies for other permits, such as a Denver retail food license, a Colorado sales tax license, health, building, and fire inspections, and a Denver cabaret license if Wednesday live music requires one.
If needed, consider food safety and responsible alcohol service for the whole team, plus age verification, refusal-of-service, and incident documentation procedures.
Colorado licenses take anywhere from about 40 days to six months, so the bar files early in October 2026. The $18,000 licensing budget covers fees, an attorney for the hearing, and permits.
Milestones and Timeline
| Target Date | Milestone | Details |
| October 2026 | Lease and license filing | Sign the lease and file the liquor license application |
| November 2026 | Loan and build-out | Close the SBA loan and start the build-out |
| December 2026 | Key hires | Hire the bar lead and kitchen lead |
| January 2027 | License hearing and training | Attend the license hearing. Train staff |
| February 2027 | Grand opening | Open to the public |
Management and Staffing
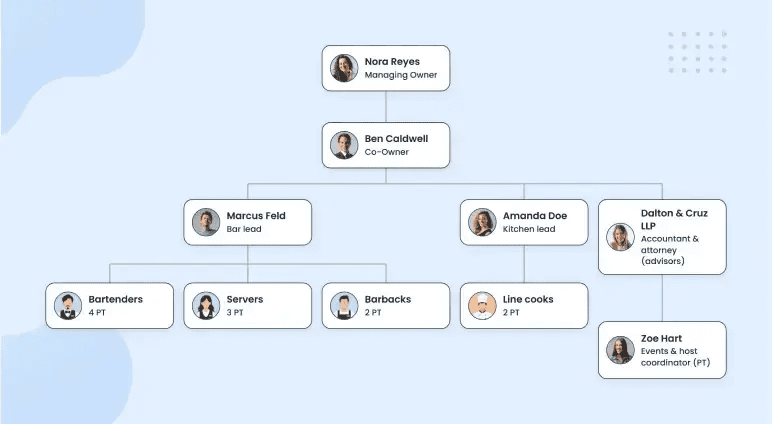
The operation is led by two owners with complementary, hands-on backgrounds in hospitality. Both stay active in daily operations through startup, which removes the need for a full general-manager layer and keeps payroll lean in the critical first year.
Owners
Nora Reyes, Managing Owner
Reyes has about 13 years in restaurant and bar operations, including several years as a general manager responsible for P&L, staffing, inventory, and vendor contracts at a high-volume neighborhood venue. She runs The Corner Room’s finances, hiring, purchasing, licensing, and the lender relationship. Salary: $75,000.
Ben Caldwell, Co-Owner
Caldwell has about 10 years of building beverage programs and running events, from bartender to beverage manager, with a track record of designing menus that hold margin and programming that fills slow nights. He runs the beverage program, weekly events, the loyalty program, and local partnerships. Salary: $55,000.
Together they bring 23 years in hospitality, split cleanly between the numbers side and the guest-facing side, so no major area of the business is left uncovered.
If one owner is unavailable, the bar lead and kitchen lead can cover daily operations, and the owners cross-cover each other’s decision areas.
Staffing Plan
Year 1 runs on about 14 staff plus the two owners, roughly six full-time equivalents once part-time schedules are combined. Direct labor is budgeted at $235,200, or 21% of revenue, which covers about 238 paid hours a week. The bar lead and kitchen lead are hired in December 2026, before opening, and the hourly team is hired and trained in the weeks that follow.
| Role | Headcount | Pay | Duties |
| Bar lead | 1 | $18.00/hour + tips | Runs the bar, orders, and trains bartenders. |
| Bartenders | 4 (part-time) | $16.27/hour + tips | Serve drinks and run events. |
| Servers and runners | 3 (part-time) | $16.27/hour + tips | Serve tables and deliver food. |
| Kitchen lead | 1 | $23.00/hour | Runs the kitchen and orders food. |
| Line cooks | 2 (part-time) | $20.00/hour | Prep and cook. |
| Barback and dish | 2 (part-time) | $19.29/hour | Restock and clean. |
| Events and host coordinator | 1 (part-time) | $20.00/hour | Books programs and greets guests. |
Staffing follows expected customers rather than a fixed roster. Extra bartender, server, and kitchen coverage is scheduled around Friday and Saturday peaks, trivia and partner nights, large reservations, and patio season, while quiet weeknights run on a lean crew. Tipped roles are paid Denver’s tipped minimum of $16.27; non-tipped roles start at or above the $19.29 city minimum.
Organization
A bar lead and a kitchen lead report to the owners and supervise their own teams. Bartenders, servers, and barbacks report to the bar lead. Line cooks report to the kitchen lead. An outside accountant and attorney support tax, payroll, licensing, lender reporting, and lease matters. Staff is cross-trained, so a bartender can run the floor on a quiet night.
Financial Plan
The financial plan shows steady growth over three years. All figures are before tax, because the LLC passes profit through to the owners. Year 1 runs from February 2027 to January 2028.
Startup Costs and Funding
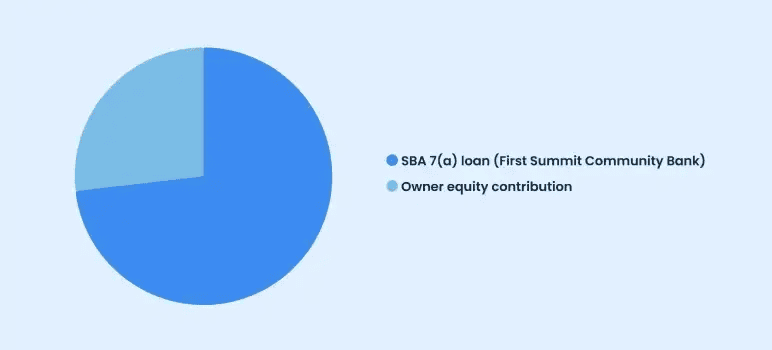
The Corner Room needs $410,000 to open. The money splits into a $300,000 SBA 7(a) loan and $110,000 of owner equity. The plan opens with $107,000 in cash (the $51,000 working-capital reserve plus a float for one-time expenses). The reserve covers about 1.7 months of fixed costs and loan payments if opening runs late.
| Expense | Amount |
| Leasehold improvements / build-out | $120,000 |
| Bar equipment (draft system, coolers, glass washer, POS) | $56,000 |
| Kitchen equipment (limited menu) | $42,000 |
| Furniture and fixtures (seating, bar stools, patio, décor) | $35,000 |
| AV / sound / TVs | $14,000 |
| Opening inventory (beverage + food) | $16,000 |
| Prepaid insurance | $6,000 |
| Security deposit (lease) | $14,000 |
| Liquor license and permits (Colorado) | $18,000 |
| Marketing launch and branding | $16,000 |
| Professional and setup fees (legal, architect, permits) | $12,000 |
| Pre-opening hiring and training | $10,000 |
| Working capital reserve (cash) | $51,000 |
| Total startup costs | $410,000 |
| Source of funds | Amount | Details |
| SBA 7(a) loan (First Summit Community Bank) | $300,000 | 10 years at 11.5%. Monthly payment of $4,217.86. |
| Owner equity contribution | $110,000 | Cash from the owners. |
| Total startup capital | $410,000 |
Financial Assumptions
| Item | Assumption |
| Annual customers | Year 1: 40,000; Year 2: 44,800; Year 3: 48,832 |
| Revenue growth rate | Year 2: +12%; Year 3: +9% |
| Sales mix | ~70% beverage / ~30% food |
| Direct materials (beverage + food goods) | 26% of revenue |
| Direct labor (bar and kitchen staff) | 21% of revenue |
| Payroll tax rate | 11% (FICA + FUTA/SUTA + workers’ comp), on direct labor and owner salaries |
| Owner/admin salaries (fixed) | $130,000 a year (Reyes $75,000 + Caldwell $55,000) |
| Rent | $84,000 Year 1, +3% a year |
| Ongoing marketing | 3.2% of revenue |
| Card processing fees | 2.6% of revenue |
| Supplies/consumables | 1.6% of revenue |
| Accounts receivable | ~2 days of sales (card settlement) |
| Accounts payable | ~15 days of materials cost |
| Inventory on hand | ~20 days of materials cost |
| Depreciation | $33,800 a year, straight-line |
Depreciation Schedule
| Asset | Cost | Useful Life | Annual Depreciation |
| Leasehold improvements | $120,000 | 10 years | $12,000 |
| Bar equipment | $56,000 | 7 years | $8,000 |
| Kitchen equipment | $42,000 | 7 years | $6,000 |
| Furniture & fixtures | $35,000 | 7 years | $5,000 |
| AV / sound / TVs | $14,000 | 5 years | $2,800 |
| TOTAL | $267,000 | $33,800 |
Projected Profit and Loss
| Income statement | Year 1 | Year 2 | Year 3 |
| Customers (annual) | 40,000 | 44,800 | 48,832 |
| Total revenue | $1,120,000 | $1,254,400 | $1,367,296 |
| Direct materials, beverage + food (26%) | $291,200 | $326,144 | $355,497 |
| Direct labor, bar and kitchen (21%) | $235,200 | $263,424 | $287,132 |
| Payroll tax on direct labor (11%) | $25,872 | $28,977 | $31,585 |
| Total COGS | $552,272 | $618,545 | $674,214 |
| Gross profit | $567,728 | $635,855 | $693,082 |
| Gross margin | 50.7% | 50.7% | 50.7% |
| Owner/admin salaries | $130,000 | $130,000 | $130,000 |
| Payroll tax on owner salaries (11%) | $14,300 | $14,300 | $14,300 |
| Rent | $84,000 | $86,520 | $89,116 |
| Insurance (GL + liquor liability + property) | $18,000 | $18,540 | $19,096 |
| Utilities | $30,000 | $31,500 | $33,075 |
| Repairs and maintenance | $12,000 | $12,600 | $13,230 |
| Technology/software | $9,600 | $10,080 | $10,584 |
| Accounting / legal (ongoing) | $9,000 | $9,270 | $9,548 |
| Marketing (ongoing, 3.2%) | $35,840 | $40,141 | $43,753 |
| Supplies/consumables (1.6%) | $17,920 | $20,070 | $21,877 |
| Card processing fees (2.6%) | $29,120 | $32,614 | $35,550 |
| Liquor license and permits (one-time) | $18,000 | – | – |
| Marketing launch (one-time) | $16,000 | – | – |
| Professional and setup fees (one-time) | $12,000 | – | – |
| Pre-opening hiring and training (one-time) | $10,000 | – | – |
| Total operating expenses | $445,780 | $405,636 | $420,129 |
| EBITDA | $121,948 | $230,220 | $272,954 |
| Depreciation | $33,800 | $33,800 | $33,800 |
| EBIT | $88,148 | $196,420 | $239,154 |
| Interest expense | $33,623 | $31,563 | $29,252 |
| Net income (pre-tax) | $54,525 | $164,857 | $209,901 |
| Pre-tax margin | 4.9% | 13.1% | 15.4% |
Projected Cash Flow
| Cash flow statement | Year 1 | Year 2 | Year 3 |
| Beginning cash | $107,000 | $190,208 | $368,598 |
| Net income (pre-tax) | $54,525 | $164,857 | $209,901 |
| Depreciation (non-cash) | $33,800 | $33,800 | $33,800 |
| Change in accounts receivable | ($6,137) | ($736) | ($619) |
| Change in inventory | $44 | ($1,915) | ($1,608) |
| Change in accounts payable | $11,967 | $1,436 | $1,207 |
| Change in prepaid expenses | $6,000 | $0 | $0 |
| Net cash from operations | $100,199 | $197,442 | $242,681 |
| Capital expenditures | $0 | $0 | $0 |
| Loan principal repayment | ($16,991) | ($19,052) | ($21,362) |
| Net change in cash | $83,208 | $178,390 | $221,319 |
| Ending cash | $190,208 | $368,598 | $589,917 |
Projected Balance Sheet
| Opening balance sheet (at launch) | Amount |
| Cash (working-capital reserve + one-time expense float) | $107,000 |
| Inventory | $16,000 |
| Prepaid insurance | $6,000 |
| Security deposit | $14,000 |
| Gross PP&E | $267,000 |
| Total assets | $410,000 |
| SBA term loan | $300,000 |
| Members’ capital (paid-in) | $110,000 |
| Total liabilities + equity | $410,000 |
| Balance sheet | Year 1 | Year 2 | Year 3 |
| Cash | $190,208 | $368,598 | $589,917 |
| Accounts receivable | $6,137 | $6,873 | $7,492 |
| Inventory | $15,956 | $17,871 | $19,479 |
| Prepaid expenses | $0 | $0 | $0 |
| Security deposit | $14,000 | $14,000 | $14,000 |
| Net PP&E | $233,200 | $199,400 | $165,600 |
| Total assets | $459,501 | $606,742 | $796,488 |
| Accounts payable | $11,967 | $13,403 | $14,609 |
| SBA term loan | $283,009 | $263,957 | $242,595 |
| Total liabilities | $294,976 | $277,360 | $257,204 |
| Paid-in capital | $110,000 | $110,000 | $110,000 |
| Retained earnings (cumulative net income) | $54,525 | $219,382 | $429,284 |
| Members’ capital | $164,525 | $329,382 | $539,284 |
| Total liabilities + equity | $459,501 | $606,742 | $796,488 |
Break-Even Analysis
| Item | Value |
| Average revenue per customer | $28.00 |
| Direct materials per customer (26%) | $7.28 |
| Direct labor + payroll tax per customer (23.31%) | $6.53 |
| Total variable cost per customer | $13.81 |
| Contribution margin per customer | $14.19 |
| Contribution margin (%) | 50.7% |
| Annual fixed operating costs (Year 2 basis) | $405,636 |
| Break-even customers per year | 28,580 |
| Break-even customers per month | ~2,382 |
| Break-even revenue (annual) | $800,240 |
Loan Summary
| Loan detail | Value |
| Lender | First Summit Community Bank (SBA 7(a) preferred lender) |
| Loan amount | $300,000 |
| Interest rate | 11.5% |
| Term | 10 years |
| Monthly payment | $4,217.86 |
| Annual payment | $50,614 |
| Total interest over the life of the loan | About $206,000 |
| Interest expense, Years 1 to 3 | $33,623; $31,563; $29,252 |
| Principal repaid, Years 1 to 3 | $16,991; $19,052; $21,362 |
| Loan balance at end of Year 3 | $242,595 |
EBITDA covers the $50,614 yearly loan payment 2.4 times in Year 1, 4.5 times in Year 2, and 5.4 times in Year 3.
The Quickest Way to turn a Business Idea into a Business Plan
Fill-in-the-blanks and automatic financials make it easy.


Upmetrics
Upmetrics is the #1 business planning software that helps entrepreneurs and business owners create investment-ready business plans using AI. We regularly share business planning insights on our blog. Check out the Upmetrics blog for such interesting reads. Read more