Executive Summary
SimpleVend Operations is a startup vending machine business based in Dallas, Texas, developed with a clear focus on steady, repeat cash flow rather than rapid scale. Our business operates refurbished snack and beverage vending machines in workplace environments with regular employee traffic, where demand is routine and predictable.
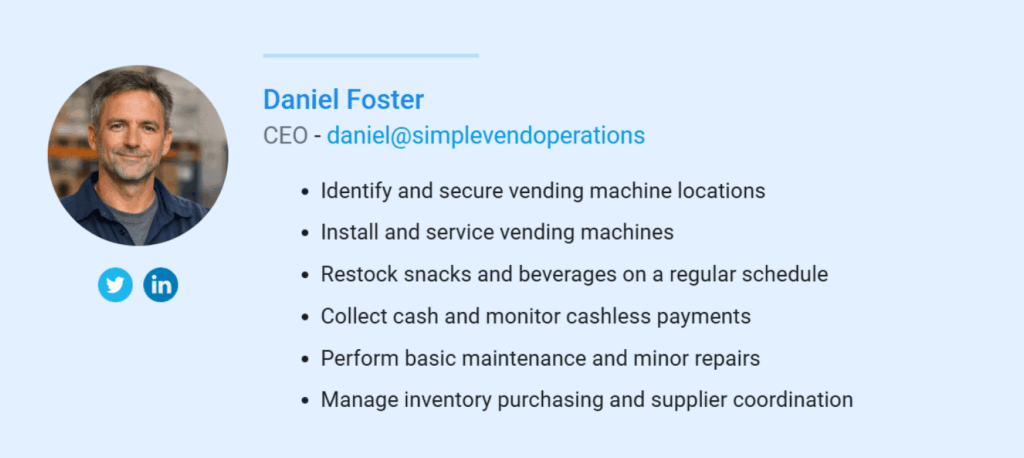
The business is fully owner-operated, with Daniel Foster overseeing all aspects of the business. His involvement spans location selection, machine servicing, inventory management, payment collection, and minor repairs. This direct involvement is intentional and reflects a preference for operational control and firsthand performance monitoring, especially during the early stages of the business.
SimpleVend is designed around practical execution rather than expansion targets, and several structural choices reflect this philosophy:
- Launching with a limited number of refurbished machines
- Operating without employees
- Avoiding marketing, branding, and sales overhead
- Maintaining stable pricing with no early increases
- Expanding only after locations and routes show consistent results
The business model recognizes that uneven daily sales, seasonal slowdowns, and underperforming placements are part of normal vending operations. Instead of compensating for weak locations with rapid expansion, machines are reviewed individually and relocated when necessary. Over time, this approach improves route efficiency and average unit sales while preserving cost discipline and operational stability.
Target Market
Dallas and the surrounding Texas metro areas have a high concentration of warehouses, office parks, and distribution centers that operate long shifts.
Many people working in these office locations rely on vending machines for convenient access to snacks and drinks during work hours or night shifts. SimpleVend’s target audience is anchored in the workplace segment of the vending industry, where demand is driven by employee presence rather than retail foot traffic.
Competition in the vending space is fragmented and includes:
- Small independent operators with limited routes
- Regional vending companies have larger fleets but slower response times
- On-site small food markets or shops that serve large facilities
SimpleVend positions itself between these groups by servicing mid-sized locations that are often overlooked by large operators while maintaining better consistency than part-time operators.
Operating Scale and Revenue Model
The business revenue is generated from per-item sales only. There are no contracts, subscriptions, or receivables.
| Item | Year 1 | Year 2 | Year 3 |
|---|---|---|---|
| Active Machines | 4 (Refurbished) | 6 | 6 |
| Avg Units per Machine per Day | 18 | 26 | 32 |
| Blended Item Price | $2.00 | $2.00 | $2.00 |
| Payment Mix | 60% card / 40% cash | Same | Same |
Funding Requirements
Total startup funding required is $17,000.
| Source of Funds | Amount |
|---|---|
| Bank Term Loan | $12,000 |
| Owner Cash Contribution | $5,000 |
| Total Funding | $17,000 |
Funds are used for refurbished vending machines, cashless payment readers, initial inventory, permits, insurance deposits, and a small working capital buffer.
The financial strategy prioritizes:
- Survival and learning in Year-1
- Stabilization in Year-2
- Consistent profitability by Year-3
Owner compensation is deferred until the business demonstrates reliable cash flow. These low fixed costs allow the business to reach a monthly break-even point at approximately $2,000 to $2,300 in revenue, well below the expected average monthly sales after stabilization.
Want a professional plan like this sample?
Upmetrics AI generate a complete, investor-ready plan for you

Business Overview
The company installs and operates refurbished snack and beverage combination machines in workplace environments where employees have limited access to on-site food options. Our target locations are across the Dallas metro area, where people work for long periods of time:
- Offices
- Warehouses
- Logistics centers
- Light industrial facilities
Legal Structure
SimpleVend Operations is organized as a limited liability company (LLC). This structure separates business activities from the owner’s personal finances while remaining straightforward to manage. The LLC format supports full owner control over operations and financial decisions without outside partners or governing bodies.
Ownership and Management
The business is fully owner-operated by Daniel Foster, with no employees for the first 3 years. All operational responsibilities are handled directly by the owner.
This structure minimizes operating costs and ensures decisions are based on direct observation of machine performance.
Daniel Foster’s background in warehouse environments provides practical insight into shift-based workplaces and employee needs. His experience with industrial sites and route-based logistics directly supports the day-to-day requirements of vending operations.
By managing the business independently, SimpleVend maintains cost discipline, operational accountability, and flexibility to adjust placements and routes based on real performance data.
Business Model
SimpleVend follows a direct-to-location vending model. Revenue is generated through per-item sales made at vending machines using cash and cashless payments. Our company does not rely on contracts, subscriptions, or recurring service fees.
Key elements of the business model include:
- Placement of machines under fixed monthly location agreements
- Sale of packaged snacks and bottled or canned beverages
- Immediate payment collection at the point of sale
- Revenue is driven by unit volume per machine rather than by pricing increases
The model is designed to remain simple, predictable, and manageable for a single owner.
Business Goals
The primary goals of SimpleVend Operations are operational rather than scale-driven.
Key business goals include:
- Establish a stable, repeat cash flow from a small number of well-performing locations
- Maintain low fixed operating costs through owner-operated execution
- Improve average unit sales per machine through better placement and servicing
- Achieve consistent profitability before considering expansion
- Build operational experience and performance data before increasing scale
- Add 2 new vending machines by Year 2
Location Strategy
SimpleVend places machines exclusively in workplace environments that meet basic performance criteria, including sufficient employee headcount, regular shift schedules, and reasonable driving distance from the owner’s base of operations.
These locations primarily include office parks, warehouses, logistics centers, and light industrial facilities within the Dallas metro area. All machines are placed under fixed monthly location fee agreements averaging approximately $75 per machine per month.
This flat-fee structure provides predictable operating costs and avoids the complexity of revenue-sharing arrangements. It also allows the business to assess machine performance based solely on unit sales rather than fluctuating commission terms.
The business does not assume equal performance across all sites. Locations are reviewed regularly, and underperforming placements are replaced as needed to improve route efficiency and average unit sales.
This location-first approach supports predictable operations and gradual performance improvement without increasing overhead or operational strain.
Startup Costs
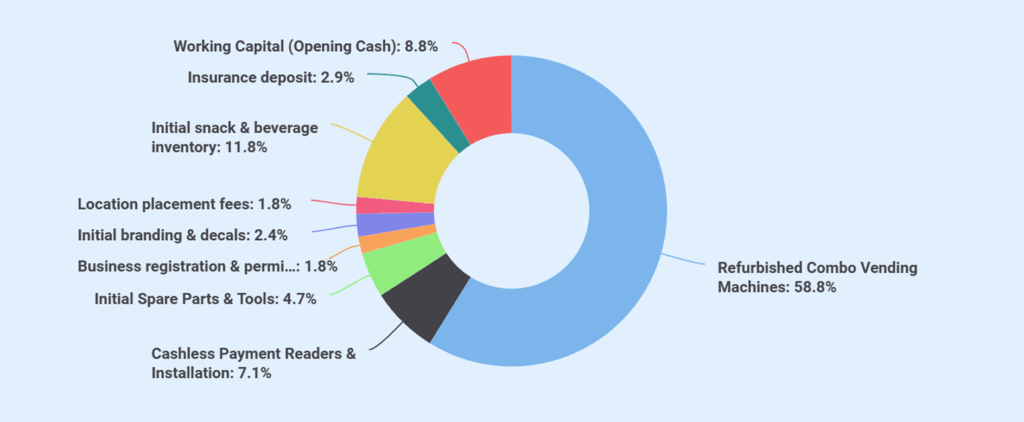
SimpleVend Operations LLC requires a total startup investment of $17,000 to launch operations. This funding covers refurbished vending machines, cashless payment equipment, initial inventory, required permits, insurance deposits, and a modest working capital reserve to support early operations.
| Category | Cost |
|---|---|
| Equipment (Capitalized) | |
| Refurbished Combo Vending Machines (4 × $2,500) | 10,000 |
| Cashless Payment Readers & Installation | 1,200 |
| Initial Spare Parts & Tools | 800 |
| Subtotal (Equipment) | 12,000 |
| Pre-Launch & Setup (Expensed) | |
| Business registration & permits | 300 |
| Initial branding & decals | 400 |
| Location placement fees | 300 |
| Subtotal (Pre-Launch) | 1,000 |
| Opening Inventory & Deposits | |
| Initial snack & beverage inventory | 2,000 |
| Insurance deposit | 500 |
| Subtotal (Inventory & Deposits) | 2,500 |
| Working Capital (Opening Cash) | 1,500 |
| Total Startup Costs | 17,000 |
Market Analysis
Industry Overview
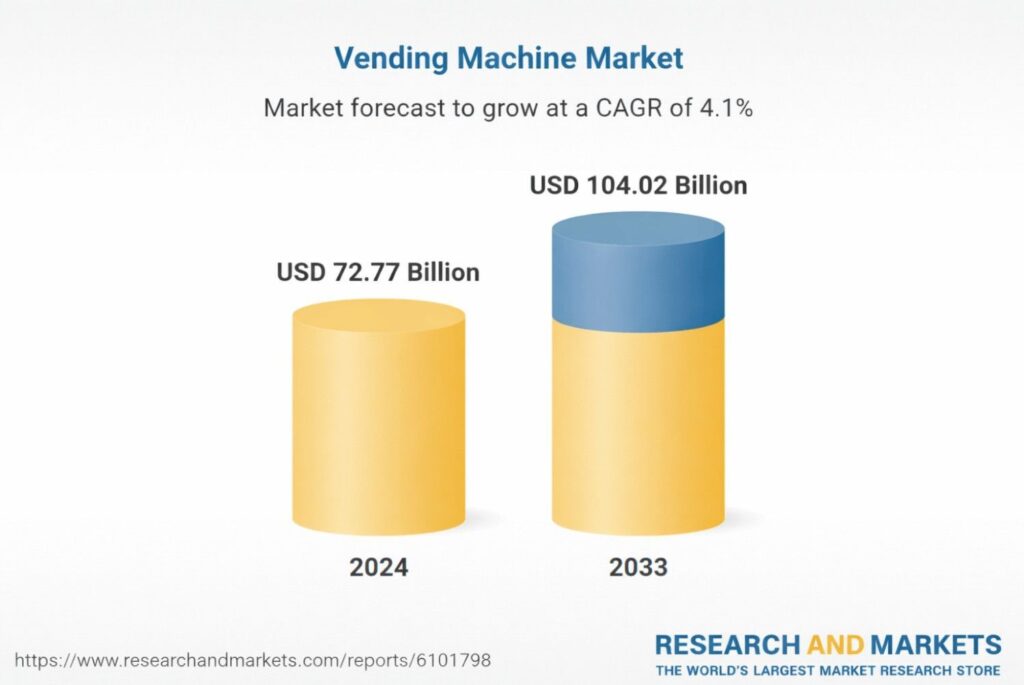
The global vending machine market is also growing steadily. It is expected to rise from $72.77 billion in 2024 to $104.02 billion by 2033, showing that demand will remain healthy for the upcoming years.
U.S. Market Size and Growth
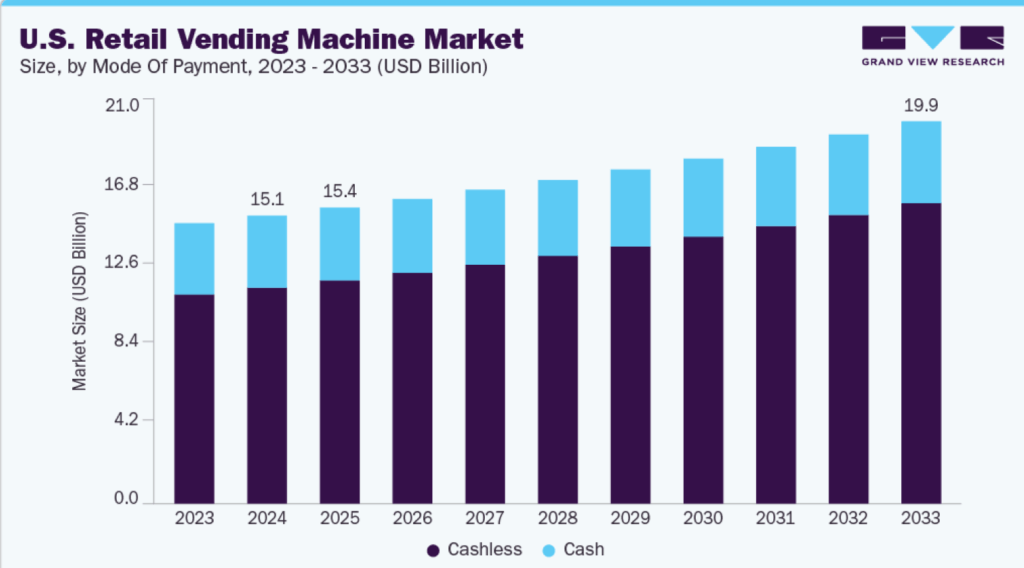
The United States is one of the largest vending markets in the world.
- U.S. market size in 2024: $15.02 billion
- Expected size by 2033: $19.95 billion
- Annual growth rate: 3.2% from 2025 to 2033
Growth is driven by more machine placements, regular daily use, and the shift toward card and mobile payments.
The scale of the U.S. market is significant:
- Over 7 million vending machines are operating nationwide
- About 100 million people use vending machines each day
This level of use shows that vending machines are a routine purchase option for many consumers.
Local Industrial Environment
In Q4 2025, businesses in Dallas used 8.1 million square feet of industrial space, indicating strong demand for warehouses and related facilities.
The use of combination vending machines in the Dallas–Fort Worth metro area is closely tied to daily work routines. More than 4,410,389 people are employed across offices, warehouses, healthcare facilities, and educational institutions in the region.
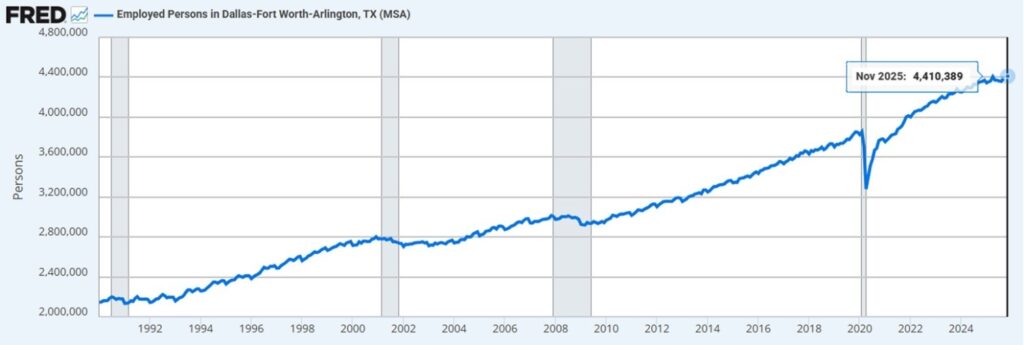
Many of these employees work long shifts in locations with limited access to nearby restaurants or food outlets. As a result, they often rely on combination vending machines for quick snacks and drinks during scheduled break times.
Stop searching the internet for industry & market data
Get AI to bring curated insights to your workspace

Competitive Environment
As the U.S. vending machine industry is made up mostly of small, local operators, there are an estimated 15,867 vending machine businesses operating nationwide.
Texas accounts for approximately 1,553 of these operators. Most run limited routes within a single city or region rather than operating at a national level.
The vending machine market serving workplaces in the Dallas–Fort Worth area is active but fragmented.
These are the local Dallas-based vending machine operators settled around the Dallas industrial metro area.
| Provider | Primary Location Types | Typical Restocking Frequency | Service Response Time |
|---|---|---|---|
| Naturals2Go | Offices, warehouses, apartment communities | Weekly or bi-weekly, adjusted based on location volume | Service requests typically handled within 24–48 hours through local operators |
| Vending Source | Offices, warehouses, mixed-use properties | Depends on operator or client-managed model; often bi-weekly | Response time varies by ownership model; not always operator-managed |
| TGL Vending | Offices, industrial facilities, apartment complexes | Weekly servicing for active locations | Local servicing allows faster response, often within 24–48 hours |
| Starport Vending | Offices, warehouses, commercial workplaces | Weekly or volume-based servicing | Service issues typically addressed within 1–2 business days |
Competitive Positioning
SimpleVend operates in a crowded Dallas–Fort Worth vending market, but it does not compete at a large scale or with service bundles. Large vending operators mainly focus on wide service areas and large campuses, which often leads to less consistent service for smaller and mid-sized locations.
SimpleVend follows an owner-managed model instead of a volume-driven approach.
This position is defined by the following:
- Machines are serviced directly by the owner, not by dispatch teams or third-party technicians
- Faster restocking and quicker response when issues occur
- Focus on mid-sized offices, warehouses, and industrial sites that are often overlooked
- No micro-markets, coffee programs, or bundled service offerings
- Clear placement terms and predictable service schedules
- Regular review of machine performance, with low-performing locations relocated
Rather than competing on price or extra features, SimpleVend competes on consistency and direct attention to each machine. In a market where many providers offer similar services, this hands-on approach provides a clear advantage for workplaces that value reliability over scale.
Target Audience
SimpleVend’s target audience consists of employees working in offices, warehouses, logistics centers, and light industrial facilities across the Dallas–Fort Worth metro area. These environments support steady vending demand because employees spend extended hours on site and rely on vending machines for convenient access to snacks and beverages during work breaks.
Placement Agreements and Rent Structure
SimpleVend Operations utilizes a fixed-fee leasing model for all equipment placements. Unlike industry-standard revenue-sharing or commission-based contracts, SimpleVend pays property owners a set monthly rent per machine. For this plan, the average location fee for year 1 is budgeted at $75 per machine, per month.
This flat-fee structure is a deliberate choice designed to benefit both the company and the host facility:
- Simple contracts: Property managers at offices, warehouses, and industrial sites prefer easy-to-understand agreements. A fixed fee removes the need for sales reports or audits.
- Stable costs: Since rent is not based on sales, our expenses stay steady and easy to plan.
- Easy to track performance: The break-even point for each machine is clear. If a machine is not doing well, we can move it to a better location quickly.
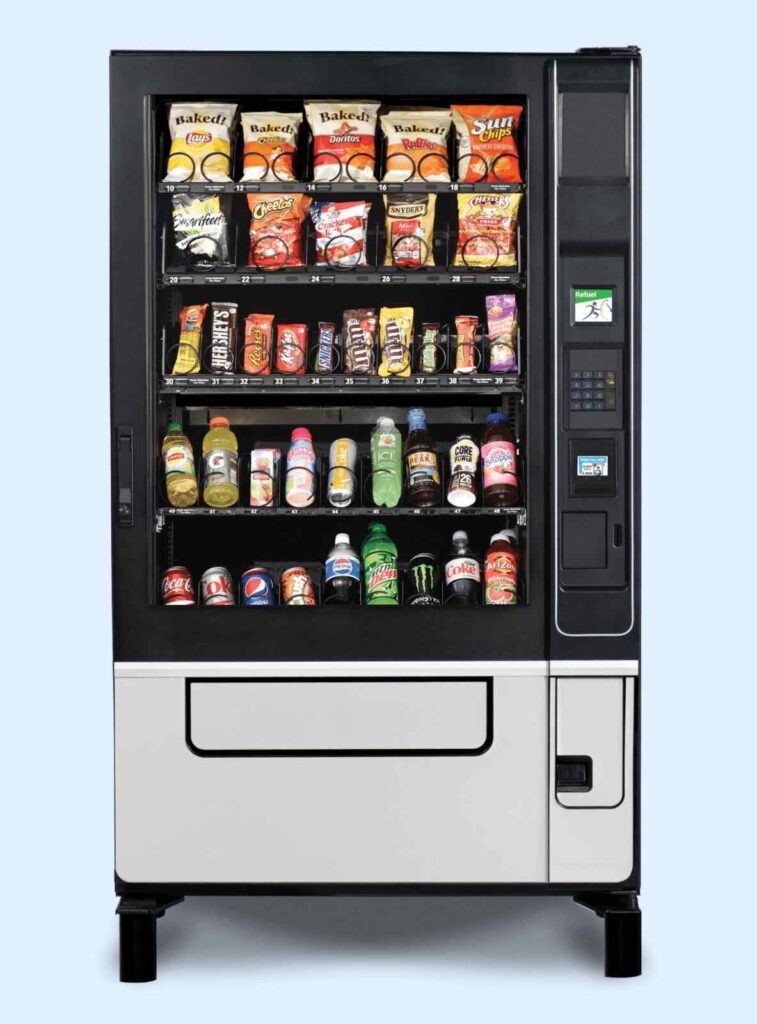
Product Offering
The vending machines include snack items that are widely recognized and popular products, such as:
- Chips (Lay’s, Cheetos, Pringles, Doritos, Sun Chips)
- Candy/bars (Hershey’s, Reese’s, Snickers, Twix, M&M’s)
Beverage or drink options are limited to bottled water, canned soft drinks, and packaged energy or sports drinks, with no fresh food options.
Due to the risks of spoilage, SimpleVend Operations avoids fresh and refrigerated foods in combo machine inventory offerings to ensure food safety and reduce waste. By focusing only on long-lasting snacks and drinks, the business avoids the risk of food going to waste and saves money on lost inventory. This simple selection makes it much easier for one person to manage all the restocking and maintenance duties without extra help or special equipment.
The product mix will include approximately 22–26 slots dedicated to packaged snacks and 12–16 slots allocated to cold beverages.
SimpleVend applies a blended average selling price of approximately $2.00 per item across all machines. Individual product prices may differ slightly by category, but the overall price level is held steady during the first two years of operation.
Payment Methods and Sales Collection
Each combo vending machine in this operation accepts all payment methods, including cash or cashless payments, along with credit cards, debit cards, and mobile wallet transactions. On the basis of current operating assumptions, approximately 60% of sales are cashless, with the remaining 40% paid in cash.
All transactions are collected at the point of sale. This business does not carry any of the following:
- Customer accounts
- Billing cycles
- Delayed payments
Operations Plan
SimpleVend follows a straightforward operating model focused on keeping machines stocked, smoothly working, and easy to service. Daily execution centers on machine uptime, product availability, and efficient routing.
In Year 1, the business operates a four-machine route. Each machine is serviced at least once per week, with higher-volume locations visited twice weekly to avoid stockouts.
Every service visit follows the same routine:
- Restocking products
- Collecting cash
- Checking card readers
- Cleaning the machine’s glass
Sales are tracked at the machine level using weekly cash counts and cashless reports. Machines that stay below expected sales levels for several weeks are reviewed and relocated if needed.
The operating approach allows for uneven sales and gradual improvement. Routes and service frequency are adjusted based on real performance data, helping improve results without adding extra costs or complexity.
The following operating assumptions outline how the business is expected to perform at the machine level over time.
| Operating Metric | Assumption |
|---|---|
| Operating Days | 365 |
| Average Price per Item | $2.00 per item |
| Average Daily Sales – Year 1 | 18 items per machine |
| Average Daily Sales – Year 2 | 26 items per machine |
| Average Daily Sales – Year 3 | 32 items per machine |
Machine Deployment and Scaling Plan
The business launches with 4 refurbished snack and beverage combo vending machines placed across selected office, warehouse, and light industrial locations within the Dallas metro area. These machines are deployed individually rather than in clusters, allowing the owner to assess each location’s sales behavior without committing excess capital.
No additional machines are added during the first year. This period is used to evaluate:
- Location performance consistency
- Average daily unit sales per machine
- Service time per stop
- Travel efficiency between sites
After initial stabilization, 2 additional machines are added at the start of Year 2, bringing the total to 6 machines. No further expansion is assumed beyond this point.
Restocking, Routing, and Time Management
Service Vending machines are serviced on a weekly or bi-weekly schedule, based on sales volume and product turnover at each location. Sites with higher sales activity are serviced more frequently to prevent stockouts, while lower-volume locations are visited less often to control travel time and fuel expenses.
Routes are planned to keep driving distances short and reduce idle time between stops. As locations with weaker performance are replaced, overall route efficiency improves.
Inventory is purchased in small, regular quantities, which aligns with the operating approach of avoiding excess stock and limiting cash tied up in unsold products.
Each service visit is planned as a single, efficient stop. Restocking, payment collection, and basic machine checks are completed during the same visit, allowing service time per machine to remain consistent and manageable.
Owner Capacity Constraints
SimpleVend’s single-owner business structure provides full cost control but creates natural capacity limits.
Operational constraints include:
- A finite number of machines that can be serviced personally
- Time required for restocking, collections, and maintenance
- Driving time between locations
- Administrative tasks handled directly by the owner
These limits are acknowledged and reflected in the business design:
- Machine count is capped at six units by Year 2
- No additional expansion is assumed beyond that level
- Routes are adjusted to reduce travel time
- Restocking schedules are matched to actual sales volume
The business does not assume delegation, staffing, or outsourcing. All projections are based on what a single operator can reasonably manage.
Maintenance, Downtime, and Issue Resolution
Basic machine maintenance and minor repairs are performed by the owner. This includes clearing jams, addressing payment reader issues, and handling routine wear-related problems. More complex repairs are avoided through the use of refurbished machines with known service histories and standardized components.
Maintenance costs are averaged at approximately:
- $60 per machine per month
This reflects minor repairs and replacement parts rather than major mechanical failures. Downtime is addressed promptly during regular service visits, limiting lost sales and maintaining location relationships. Machines with recurring issues are flagged for replacement rather than extended repair, preserving overall route reliability.
Supplier Relationships and Inventory Flow
SimpleVend sources snack and beverage inventory from established wholesale suppliers that offer consistent pricing and product availability. Product selection is standardized across machines, allowing bulk purchasing of core items and simplifying restocking decisions.
Inventory flow is designed to remain lean:
- Products are purchased weekly or bi-weekly
- Stock levels are adjusted based on observed sell-through
- Slow-moving items are reduced or removed rather than discounted
This approach limits spoilage, shrinkage, and excess inventory while supporting steady cash flow. Supplier relationships are transactional and practical, focused on reliability and consistent access to core snack and beverage categories rather than promotional incentives.
Marketing and Location Acquisition
SimpleVend Operations does not use advertising, paid promotions, or digital marketing campaigns. All machine placements are secured through direct, organic outreach to workplace locations.
Location acquisition is handled personally by the owner through:
- Direct contact with office managers, warehouse supervisors, and facility administrators
- On-site visits to assess foot traffic, break schedules, and machine visibility
- Simple placement discussions focused on convenience and reliability rather than commissions or revenue sharing
The value proposition presented to locations is practical and straightforward. SimpleVend provides fully serviced vending machines at no cost to the property owner, with regular restocking, prompt issue resolution, and fixed monthly placement terms. There are no contracts tied to sales performance, and locations are not required to manage inventory, cash handling, or maintenance.
Branding plays a limited but functional role in this process. Machines are kept clean, clearly labeled, and consistently stocked, and each machine is installed in an easy-to-access location near the staff area, waiting area, and canteen or cafeteria.
Branding elements such as decals, how to use posters, and machine appearance are used to signal reliability and professionalism rather than to promote a consumer-facing brand.
This organic, relationship-driven approach benefits SimpleVend to:
- Avoid ongoing marketing expenses
- Maintain full control over placement decisions
- Replace underperforming locations without reputational risk
- Build credibility through service consistency rather than promotion
Location Underperformance
Location performance is the primary driver of revenue at the machine level. Not all placements are expected to perform equally, especially during the first year of operation. Some locations may produce lower-than-expected unit sales due to factors such as employee count, break habits, other brand machines installed, or limited machine visibility.
Key considerations related to location underperformance include:
- Machines are placed under fixed monthly location fee agreements, meaning rent is incurred regardless of sales volume.
- Early placements may include weaker locations as part of the initial learning phase.
- Sales assumptions already reflect uneven performance, particularly in Year 1.
Mitigation approach built into the plan:
- Performance is reviewed regularly at the individual machine level.
- Underperforming locations are not subsidized indefinitely.
- Machines can be relocated without long-term contractual penalties.
- Route efficiency improves over time as weaker sites are replaced.
This approach limits prolonged exposure to low-performing placements while maintaining flexibility.
Seasonality and Volume Volatility
Daily and monthly sales are expected to fluctuate. The business does not assume consistent daily performance or evenly distributed revenue throughout the year. Sales volatility is explicitly modeled in the financial projections.
Observed and expected patterns include:
- Uneven weekly sales
- Seasonal slow periods
- Occasional low-traffic days
- Short-term dips related to staffing changes or holidays
The business is structured to absorb this volatility due to:
- Low fixed operating costs
- Immediate cash and card collection
- No reliance on contracts or guaranteed volume
- A practical break-even revenue range of $2,000–$2,300 per month
Because owner compensation is deferred in Years 1 and 2, the business is not dependent on consistent personal income during periods of lower sales.
Fuel, Repair, and Equipment
Operating costs related to fuel, vehicle use, and machine maintenance represent ongoing exposure, particularly as the owner handles all servicing personally.
Key cost assumptions from the plan:
- Fuel and vehicle costs average approximately $150 per month
- Repairs and minor maintenance average $60 per machine per month
- Machines are refurbished units with known service histories
Risks in this category include:
- Unexpected mechanical issues
- Increased frequency of minor repairs
- Temporary machine downtime
- Rising fuel costs affecting route economics
Mitigation measures already reflected in the operating model:
- Conservative repair cost assumptions applied consistently across all years
- Small route size limits exposure to fuel cost increases
- Regular servicing reduces prolonged downtime
- Machines with recurring issues are candidates for replacement rather than extended repair
This approach prioritizes reliability and cost control over extending the life of underperforming equipment.
Financial Overview
The business’s operations are financed through a conservative funding structure that combines owner capital with a small business term loan. The financial approach is designed to support a low-cost startup, maintain manageable debt obligations, and allow the business to focus on stable cash flow and gradual operational improvement rather than aggressive growth.
Financial Assumptions
The business begins operations with zero opening cash. Startup equipment and setup costs are funded through owner capital, a term loan, and operating cash flow generated during Year 1.
| Item | Assumption |
|---|---|
| Forecast period | 3 years |
| Locations | Third-party sites with fixed monthly location fees |
| Operating days | 365 days/year |
| Average selling price (blended) | $2.00 per item (no price increase in Year 1–2) |
| Payment mix | ~60% card, ~40% cash |
| Owner compensation | $0 in Years 1–2; discretionary in Year 3 only |
| Marketing | None (organic placement only) |
| Capex per refurbished machine | ~$2,500 per machine |
| Depreciation policy | Straight-line over 5 years |
| Loan amount | $12,000 small business term loan |
| Loan term | 5 years, fixed-rate |
| Interest rate (assumed) | ~9% annual |
| Tax treatment | Pre-tax only (educational model) |
Source of Funds
| Source | Amount |
|---|---|
| Bank Term Loan | 12,000 |
| Owner Cash Contribution | 5,000 |
| Total Funding | 17,000 |
Income Statement
| Category | Year 1 | Year 2 | Year 3 |
|---|---|---|---|
| Revenue | |||
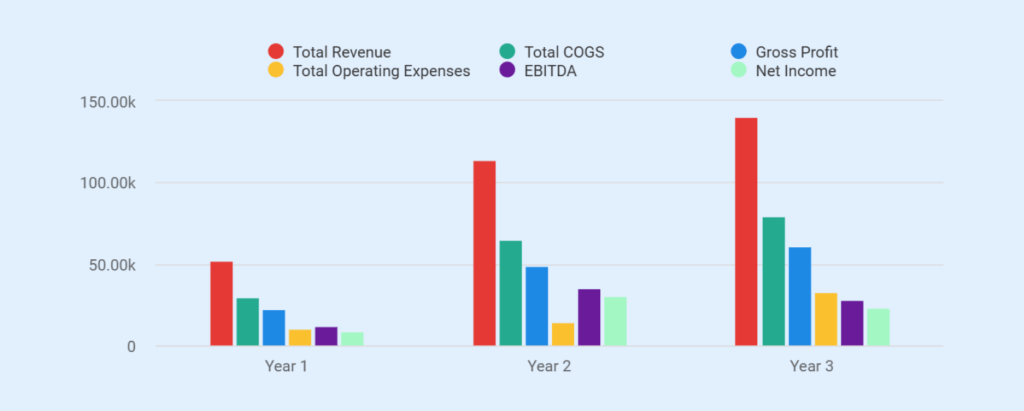
| Snack & Beverage Sales | 52,500 | 113,900 | 140,200 |
| Total Revenue | 52,500 | 113,900 | 140,200 |
| Cost of Goods Sold (COGS) (product inventory + card processing fees) | |||
| Inventory Cost (~55%) | 28,900 | 62,600 | 77,100 |
| Card Processing Fees | 950 | 2,050 | 2,500 |
| Total COGS | 29,850 | 64,650 | 79,600 |
| Gross Profit | 22,650 | 49,250 | 60,600 |
| Gross Margin | 43.1% | 43.2% | 43.2% |
| Operating Expenses (OPEX) | |||
| Location Rent Fees | 3,600 | 5,400 | 5,400 |
| Fuel & Vehicle Costs | 1,800 | 2,200 | 2,400 |
| Insurance | 960 | 1,020 | 1,080 |
| Phone & Software | 600 | 660 | 720 |
| Repairs & Maintenance | 2,880 | 4,320 | 4,320 |
| Misc. Admin & Supplies | 600 | 720 | 840 |
| Owner Compensation | 0 | 0 | 18,000 |
| Total Operating Expenses | 10,440 | 14,320 | 32,760 |
| EBITDA | 12,210 | 34,930 | 27,840 |
| EBITDA Margin | 23.3% | 30.7% | 19.9% |
| Depreciation (Machines) | 2,400 | 3,600 | 3,600 |
| EBIT | 9,810 | 31,330 | 24,240 |
| Interest Expense | 1,050 | 840 | 630 |
| Net Income (Pre-Tax) | 8,760 | 30,490 | 23,610 |
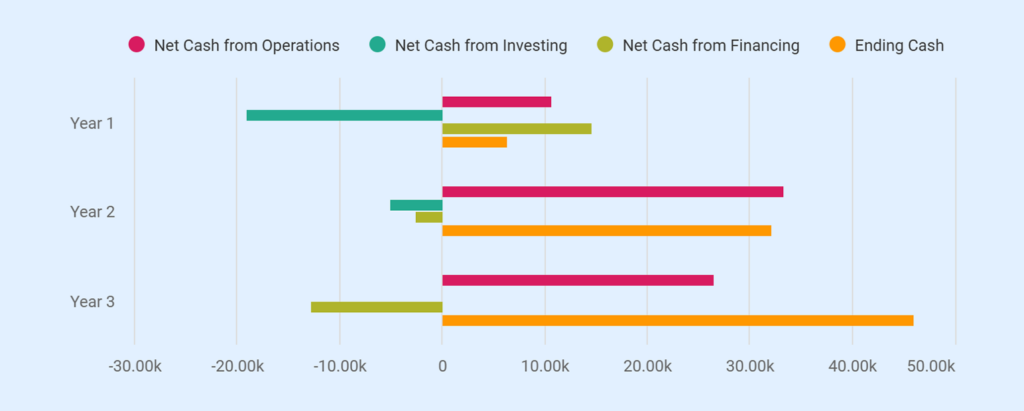
Cash Flow Statement
| Year | Year 1 | Year 2 | Year 3 |
|---|---|---|---|
| Operating Activities | |||
| Net Income (Pre-Tax) | 8,760 | 30,490 | 23,610 |
| Add: Depreciation (Machines) | 2,400 | 3,600 | 3,600 |
| Change in Inventory | (500) | (700) | (700) |
| Change in Payables & Accruals | 0 | 0 | 0 |
| Net Cash from Operations | 10,660 | 33,390 | 26,510 |
| Investing Activities | |||
| Startup Equipment & Machine Setup | (19,000) | 0 | 0 |
| Purchase of Vending Machines (Expansion) | 0 | (5,000) | 0 |
| Net Cash from Investing | (19,000) | (5,000) | 0 |
| Financing Activities | |||
| Bank Loan Proceeds | 12,000 | 0 | 0 |
| Owner Cash Contribution | 5,000 | 0 | 0 |
| Loan Principal Repayment | (2,300) | (2,500) | (2,700) |
| Owner Distributions | 0 | 0 | (10,000) |
| Net Cash from Financing | 14,700 | (2,500) | (12,700) |
| Net Change in Cash | 6,360 | 25,890 | 13,810 |
| Beginning Cash | 0 | 6,360 | 32,250 |
| Ending Cash | 6,360 | 32,250 | 46,060 |
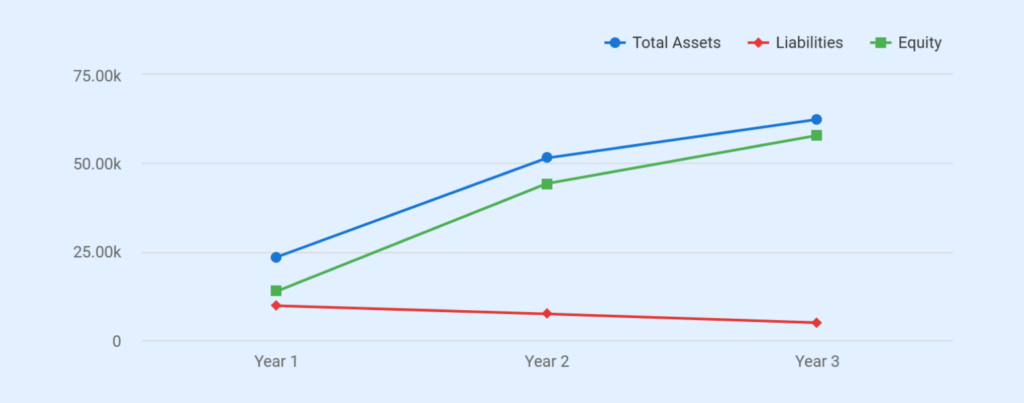
Balance Sheet
| Category | Year 1 | Year 2 | Year 3 |
|---|---|---|---|
| Cash | 6,360 | 32,250 | 46,060 |
| Prepaid Insurance / Deposits | 2,500 | 3,200 | 3,900 |
| CURRENT ASSETS | 8,860 | 35,450 | 49,960 |
| Net Fixed Assets | 14,600 | 16,000 | 12,400 |
| Vending Machines & Readers (Gross) | 17,000 | 22,000 | 22,000 |
| Accumulated Depreciation | (2,400) | (6,000) | (9,600) |
| TOTAL ASSETS | 23,460 | 51,450 | 62,360 |
| LIABILITIES | 9,700 | 7,400 | 4,900 |
| Current Portion of Term Loan | 2,300 | 2,500 | 2,700 |
| Long-Term Term Loan | 7,400 | 4,900 | 2,200 |
| EQUITY | 13,760 | 44,250 | 57,860 |
| Owner Capital Contribution | 5,000 | 5,000 | 5,000 |
| Retained Earnings | 8,760 | 39,250 | 52,860 |
| LIABILITIES + EQUITY | 23,460 | 51,450 | 62,360 |
Don’t waste time using spreadsheets
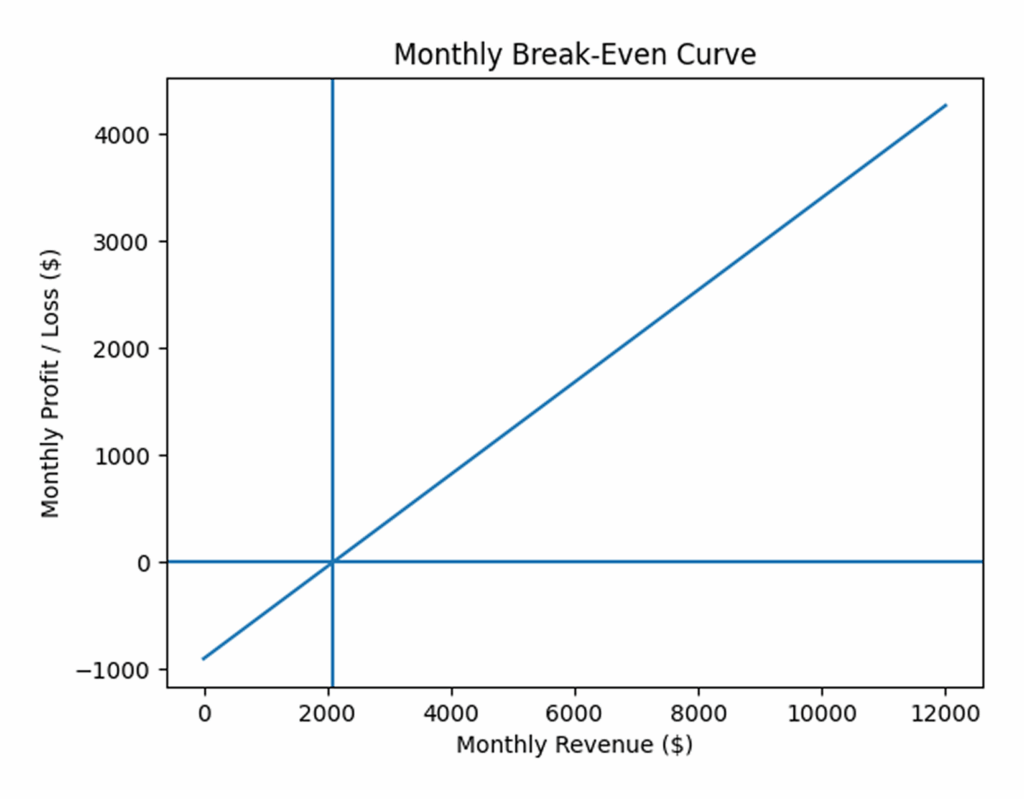
Break-Even Analysis
| Metric | Value / Range |
|---|---|
| Monthly Fixed Operating Costs (OPEX) | $850 – $950 |
| Location Rent (4–6 machines) | ~$300 – $450 |
| Fuel & Vehicle Costs | ~$150 |
| Insurance | ~$80 |
| Phone & Software | ~$50 |
| Repairs & Maintenance (fixed portion) | ~$200 |
| Misc. Admin | ~$100 |
| Average Fixed Costs (Used) | ~$900 / month |
| Variable Cost Ratio (COGS % of Revenue) | ~56 – 58% |
| Inventory Cost | ~55% |
| Card Processing Fees | ~1.5 – 2.0% |
| Contribution Margin | ~42 – 44% |
| Base Monthly Break-Even Revenue | ~$2,100 |
| Practical Break-Even Range | $2,000 – $2,300 |
| Annualized Break-Even Revenue | $24,000 – $27,600 |
| Avg. Monthly Revenue – Year 1 | ~$4,375 |
| Avg. Monthly Revenue – Year 2 | ~$9,500 |
| Avg. Monthly Revenue – Year 3 | ~$11,700 |
The Quickest Way to turn a Business Idea into a Business Plan
Fill-in-the-blanks and automatic financials make it easy.
Upmetrics
Upmetrics is the #1 business planning software that helps entrepreneurs and business owners create investment-ready business plans using AI. We regularly share business planning insights on our blog. Check out the Upmetrics blog for such interesting reads. Read more